CrusaderFrank
Diamond Member
- May 20, 2009
- 146,673
- 69,812
- Thread starter
- #21
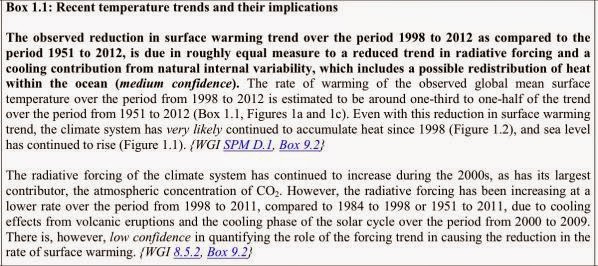
Like this?

This map seems to show high CO2 levels just where you'd expect them. Google says this graphic is from Judith Curry's blog and give this link: Climate/Energy Policy and the GOP Congress but I do not find the graph or any related discussion there. Google or Judy has hosed something.

OCO2 satellite shows that the equatorial rain forests produce most of the CO2