Old Rocks
Diamond Member
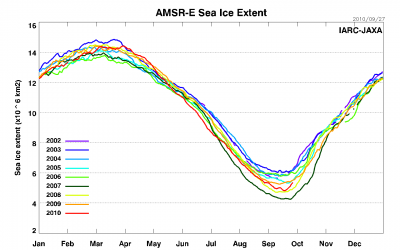
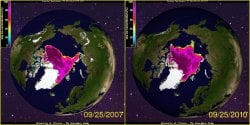
The lowest ever. lol
You are apparently unaware that in the millions of years the planet has been here, the north pole wasn't even at the current location? That the ice caps have been totally melted from time to time? Your crap stinks dude. Just saying.
And you are not aware that we haven't been here for those millions of years? Perhaps you thought Alley Oop was real history?
Look, silly ass, we are not worried about the state of the planet, we are worried about the nearly 7 billion people that inhabit it. There are ample geological evidences for the chaos that an adrupt climate change creates, even for rather sparse populations.
The present warming and retreat of the glaciers and ice caps is occuring at a time when we have a very large population of humans, with a poorly organized system of distribution of food. A major interuption of that distribution system, and you will see the population decline adruptly and painfully.