Misery index the highest in 28 years

Its 2011 by my calendar s0n!!!:up:


This is a POLITICS forum, not a history forum. The perception is..........things are shitty and getting shittier. You can post up 1,000 nutty-ass charts and graphs............wont change the level of shittiness a speck.:fu:


ANyway.........only a k00k would post up a historical look at the debt these days. I cant even think of a hysterical enough analogy that would fit.

In addition that graph means nothing
we created over 40 million jobs from 83-08
and the GOP presidents added about 6 trillion dollars of debt (with mostly a dem congress) during those 12 years they were in charge
with 9-11 and the 19% intrest rates in the early 80s, well you get the picture
Typical CON$ervative fuzzy math, 83-08 is 25 years not 12.

Now, over half of those 40 million jobs were created during Clinton's 8 years, and including interest $12 trillion of the current $14+ trillion in debt came from Reagan, Bush I and Bush II alone.

I am sorry
thats 20 years with 6 trillion in debt
14 trillion?
bull shit
thats a lie and you know it unless you add interest
then Obama has added about 5 trillion

Bush Deficit vs. Obama Deficit in Pictures | The Foundry: Conservative Policy News Blog from The Heritage Foundation
there is GWB
there is Ron Reagan s
Defending the Reagan Deficits | The Heritage Foundation

about 5 trilion there if you allow 50% of 09s to GWB (he had little to do with it) with both of them
this is called truth with links

oh yea you want add interest
There was never a surplus then
your call
 
Last edited:
Who took over complete control of Congress in 07'?

This is one of the tactics I've always found objectionable when partisans (from either party) try to use it as a pseudo get-out-of-jail-free-card to evade responsibility for active policies of their own party by somehow insinuating that a congressional majority by the "other" party means that no responsibility can be attributed to their own party which just so happens to run the executive branch AND, all the cabinet posts, the regulatory boards, and their policy apparatus.

Edit to add: Keep in mind that Bush 43 never vetoed one spending bill (or any bill of any kind) in his first six years in office.

And Bush never wrote one single bill that he signed.

Are you claiming he's a genius or an idiot. Make up your fucken mind on that one because I'm tired of the excuses.

If Bush got nothing but shit bills from Congress the last 2 years of his administration then what he got was nothing to help improve a sinking economy.

There is only so much a President can do by executive order whilst being badgered by a hostile Congress and a hostile press about every friggen problem in the Universe.

This is simply pathetic. Poor George was just POWERLESS. My, oh, my! What could he do? Could he veto anything he didn't like? Yes, in fact Bush DID use his veto power for the first time in his presidency.

And let's not forget the fact that, in the Senate, the minority party can actually block legislation if the majority party doesn't have at least 60 votes to overcome a filibuster.
 
They should call Obama what he is. The President of hopelessness and the President of change for the worse.

Hope And Change gone wrong.

Food and fuel are most definitely included in CPI.

What goods and services does the CPI cover?

The CPI represents all goods and services purchased for consumption by the reference population (U or W) BLS has classified all expenditure items into more than 200 categories, arranged into eight major groups. Major groups and examples of categories in each are as follows:
FOOD AND BEVERAGES (breakfast cereal, milk, coffee, chicken, wine, full service meals, snacks)
HOUSING (rent of primary residence, owners' equivalent rent, fuel oil, bedroom furniture)
APPAREL (men's shirts and sweaters, women's dresses, jewelry)
TRANSPORTATION (new vehicles, airline fares, gasoline, motor vehicle insurance)
MEDICAL CARE (prescription drugs and medical supplies, physicians' services, eyeglasses and eye care, hospital services)
RECREATION (televisions, toys, pets and pet products, sports equipment, admissions);
EDUCATION AND COMMUNICATION (college tuition, postage, telephone services, computer software and accessories);
OTHER GOODS AND SERVICES (tobacco and smoking products, haircuts and other personal services, funeral expenses).

Consumer Price Index Frequently Asked Questions

Is it?

Well yes and no

Transmission of material in this release is embargoed until
8:30 a.m. (EDT) Wednesday, June 15, 2011 USDL-11-0890

Technical information: (202) 691-7000 [email protected] Consumer Price Index (CPI)
Media Contact: (202) 691-5902 [email protected]

Consumer Price Index - May 2011

The Consumer Price Index for All Urban Consumers (CPI-U) increased
0.2 percent in May on a seasonally adjusted basis, the U.S. Bureau of
Labor Statistics reported today. Over the last 12 months, the all
items index increased 3.6 percent before seasonal adjustment.

The index for all items less food and energy increased 0.3 percent in
May, its largest increase since July 2008. The indexes for apparel,
shelter, new vehicles, and recreation all contributed to the
acceleration, rising more in May than in April. These increases more
than offset declines in the indexes for airline fare, tobacco, and
personal care.

The food index rose in May as well. The food at home index repeated
its April increase of 0.5 percent as four of the six major grocery
store food group indexes increased, with the index for meats,
poultry, fish, and eggs rising the most. In contrast, the energy
index, which had been rising sharply, declined in May. The gasoline
index decreased for the first time since last June, although the
index for household energy increased.

The upward trend among the 12 month increases of major indexes
continued in May. The 12 month change in the all items index, which
was 1.1 percent as recently as November, reached 3.6 percent in May.
The energy index has increased 21.5 percent over the last 12 months,
the food index has risen 3.5 percent and the index for all items less
food and energy has increased 1.5 percent. All of these figures have
been rising in recent months.


Table A. Percent changes in CPI for All Urban Consumers (CPI-U): U.S. city
average


Seasonally adjusted changes from
preceding month
Un-
adjusted
Nov. Dec. Jan. Feb. Mar. Apr. May 12-mos.
2010 2010 2011 2011 2011 2011 2011 ended
May 2011

All items.................. .1 .4 .4 .5 .5 .4 .2 3.6
Food...................... .2 .1 .5 .6 .8 .4 .4 3.5
Food at home............. .2 .2 .7 .8 1.1 .5 .5 4.4
Food away from home (1).. .1 .1 .2 .2 .3 .3 .2 2.2
Energy.................... .1 4.0 2.1 3.4 3.5 2.2 -1.0 21.5
Energy commodities....... .7 6.4 4.0 4.8 5.5 3.1 -1.9 36.2
Gasoline (all types).... .7 6.7 3.5 4.7 5.6 3.3 -2.0 36.9
Fuel oil (1)............ 4.2 4.9 6.8 5.8 6.2 3.2 -.8 36.0
Energy services.......... -.8 .6 -.6 1.1 .2 .6 .6 1.1
Electricity............. .6 .3 -.5 .4 .7 .2 .8 1.8
Utility (piped) gas
service.............. -5.3 1.7 -1.2 3.4 -1.4 1.9 -.3 -1.2
All items less food and
energy................. .1 .1 .2 .2 .1 .2 .3 1.5
Commodities less food and
energy commodities.... .0 -.1 .2 .2 .1 .4 .5 1.2
New vehicles............ -.2 -.1 -.1 1.0 .7 .7 1.1 3.4
Used cars and trucks.... .1 -.1 -.3 .1 .8 1.2 1.1 4.1
Apparel................. .1 .1 1.0 -.9 -.5 .2 1.2 1.0
Medical care commodities
(1).................. .2 .1 .5 .7 .5 .5 .0 3.0
Services less energy
services.............. .2 .1 .1 .2 .2 .1 .2 1.6
Shelter................. .1 .1 .1 .1 .1 .1 .2 1.1
Transportation services .4 .2 .6 .5 .5 .2 .1 3.3
Medical care services... .2 .3 -.1 .4 .1 .3 .3 3.0

1 Not seasonally adjusted.


Consumer Price Index Data for May 2011

Food

The food index rose 0.4 percent in May, the same increase as in
April. The food at home index increased 0.5 percent and has risen 3.7
percent since December. Among major grocery store food groups, the
index for meats, poultry, fish, and eggs rose 1.5 percent and the
cereals and bakery products index increased 1.0 percent. The dairy
and related products index and the index for other food at home
posted smaller increases, while the index for nonalcoholic beverages
was unchanged. The only group to decline was the fruits and
vegetables index, which declined 1.3 percent as a sharp decline in
the index for tomatoes caused the fresh vegetables index to fall for
the second straight month after sharp increases early in the year.
The food at home index has risen 4.4 percent over the last 12 months
with all major grocery store food groups posting increases. The index
for food away from home rose 0.2 percent in May after rising 0.3
percent in each of the previous two months.


Energy

The energy index declined 1.0 percent in May ending a series of ten
consecutive advances. After a series of several sharp increases, the
gasoline index declined 2.0 percent in May. (Before seasonal
adjustment, gasoline prices rose 3.6 percent in May.) Despite the May
decline, the gasoline index has increased 23.7 percent over the past
six months. The index for household energy increased in May, rising
0.5 percent after a 0.7 percent increase in April. The index for
electricity rose 0.8 percent, more than offsetting a 0.8 percent
decline in the fuel oil index and a 0.3 percent decrease in the index
for natural gas. The household energy index has risen 2.9 percent
over the last 12 months, with the fuel oil index up 36.0 percent and
the electricity index up 1.8 percent but the index for natural gas
down 1.2 percent.


All items less food and energy

The index for all items less food and energy rose 0.3 percent in May
after increasing 0.1 percent in March and 0.2 percent in April. The
shelter index rose 0.2 percent in May after increasing 0.1 percent in
each of the seven previous months. Both rent and owners' equivalent
rent rose 0.1 percent; the acceleration in shelter was due to the
index for lodging away from home, which rose 2.9 percent in May after
being unchanged in April. The apparel index increased in May, rising
1.2 percent after a 0.2 percent increase in April. The index for new
vehicles rose 1.1 percent in May after increasing 0.7 percent in
April; the index for used cars and trucks also rose 1.1 percent. The
index for recreation, which was unchanged in April, rose 0.3 percent
in May. The medical care index rose 0.2 percent, with the index for
medical care commodities unchanged and the index for medical care
services up 0.3 percent. The index for household furnishings and
operations advanced 0.2 percent, the same increase as in April. In
contrast to these increases, the index for airline fares fell 1.3
percent in May, and the indexes for tobacco and for personal care
both declined 0.2 percent.

The index for all items less food and energy increased 1.5 percent
over the last 12 months, with virtually all of its major component
indexes rising at a faster rate over the past six months than they
did from May to November of 2010.


Not seasonally adjusted CPI measures

The Consumer Price Index for All Urban Consumers (CPI-U) increased
3.6 percent over the last 12 months to an index level of 225.964
(1982-84=100). For the month, the index increased 0.5 percent prior
to seasonal adjustment.

The Consumer Price Index for Urban Wage Earners and Clerical Workers
(CPI-W) increased 4.1 percent over the last 12 months to an index
level of 222.954 (1982-84=100). For the month, the index rose 0.5
percent prior to seasonal adjustment.

The Chained Consumer Price Index for All Urban Consumers (C-CPI-U)
increased 3.3 percent over the last 12 months. For the month, the
index increased 0.4 percent on a not seasonally adjusted basis.
Please note that the indexes for the post-2009 period are subject to
revision.

The Consumer Price Index for June 2011 is scheduled to be released on
Friday, July 15, 2011, at 8:30 a.m. (EDT).

Source

The question is which CPI is the CPI that is used when COLAs are determined?

I'm informed that the CPI used here for Social Secuity is the first one mentioned here...the one that does not include FOOD AND FUEL.

If I have been misinformed (that often happens, ya know?) then by all means point me to someplace where I can get the correct infomation

Since 1975, Social Security's general benefit increases have been based on increases in the cost of living, as measured by the Consumer Price Index. We call such increases Cost-Of-Living Adjustments, or COLAs. Because there has been a decline in the Consumer Price Index, there will be no COLA payable in 2011.

Now...are you trying to tell us that there is NO PRICE RISES in food and Fuel during 2011?

Apparently the CPI that the federal government is using thinks there was no INFLATION in 201o.

Was that YOUR experience in 2010?

It might have been if you didn't purchase any FUEL OR FOOD, but otherwise?

If you take food and energy out of the equation it's like taking Tortillias and beans out the Mexican diet.

It doesn't show the true picture nor does it make any sense unless they're trying to lie to us.
 
Last edited:
As our Massive Debt climbs,things will definitely get worse. We're literally living on borrowed time.
 
If you take food and energy out of the equation it's like taking Tortillias and beans out the Mexican diet.

It doesn't show the true picture nor does it make any sense unless they're trying to lie to us.

First, food and energy are and always have been part of the headline number and the numbers used to calculate benefits.

The CPI-U less food and energy is often preferred by finance guys to look at the smoother picture of the general trend without the frequent changes of food and energy (also available are without shelter or medical costs etc etc).

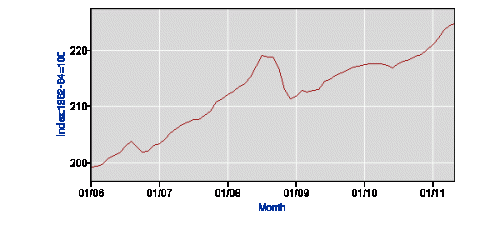
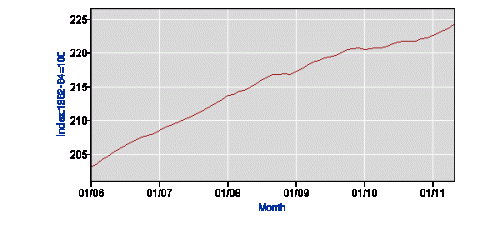
Attached are graphs of the last 5 years both All Items and Less Food and Energy. Which is the smoother curve giving the easier to use trend?
 

Attachments

  • $All Items CPI-U.gif
    $All Items CPI-U.gif
    4.1 KB · Views: 25
  • $CPI-U less food and energy.gif
    $CPI-U less food and energy.gif
    4 KB · Views: 27
As our Massive Debt climbs,things will definitely get worse. We're literally living on borrowed time.

Well, the Dems are starting to face up to the situation, so they've begun to change tactics.

Now that they can't convince everyone the economy is great they're looking for ways to blame the house Republicans for ruining it.

More excuses will be forthcoming from the left.
 
They want us to focus on Afghanistan instead of the economy. Or if the economy is the topic, they'll use the diversionary "war spending" ruse.
 
Yes, when Jimma Cawta was President.

The water is 80 degrees, the margaritas are crisp. What misery? LMAO! I was thinking that if we didn't have partys, who would we blame. Here is the president misery index. :eek: LMAO!!

Natl_Debt_Chart_2006-738252_ef128.gif


Its 2011 by my calendar s0n!!!:up:


This is a POLITICS forum, not a history forum. The perception is..........things are shitty and getting shittier. You can post up 1,000 nutty-ass charts and graphs............wont change the level of shittiness a speck.:fu:


ANyway.........only a k00k would post up a historical look at the debt these days. I cant even think of a hysterical enough analogy that would fit.

History is relevant because the GOP is the party that got us into this mess and they want to be put back in power.
 
Ignoring our terrible problems will not make them go away. The Democrats just want to ignore and pass these terrible problems onto future generations. Is that the right thing to do? I'll let you decide that for yourselves.
 
The water is 80 degrees, the margaritas are crisp. What misery? LMAO! I was thinking that if we didn't have partys, who would we blame. Here is the president misery index. :eek: LMAO!!

Natl_Debt_Chart_2006-738252_ef128.gif


Its 2011 by my calendar s0n!!!:up:


This is a POLITICS forum, not a history forum. The perception is..........things are shitty and getting shittier. You can post up 1,000 nutty-ass charts and graphs............wont change the level of shittiness a speck.:fu:


ANyway.........only a k00k would post up a historical look at the debt these days. I cant even think of a hysterical enough analogy that would fit.

History is relevant because the GOP is the party that got us into this mess and they want to be put back in power.

It's amazing, isn't it? What's even more amazing is that there are a lot of people who have forgotten how we got in this mess and who was in power when it happened. Those people even talk about our current problems as if Obama caused it. And of course, Republicans are MORE than happy to exploit any and all misunderstanding with a unhealthy dose of misinformation.

Do you know what it reminds me of? It reminds me of all those Fox viewers almost a decade ago who believed that Saddam Hussein was connected to the 9-11 terrorist attacks. Republicans, including members of the Bush administration, implied it, and Fox ramped up the rhetoric to compliment the administration's march to war for nonexistent WMDs in a country that never attacked us and was no threat to us despite ALL the talk of a mushroom cloud being the terrifying "smoking gun" of post armeggedon proof that Iraq was a threat.

One can't help but ask why there's so much ignorance both ten years ago AND today.

Leiter Reports: A Philosophy Blog: Never Underestimate the Stupidity of the American Electorate!
 
Last edited:
FWIW, the misery index only caputres part of what economically-speaking makes people's lives happy or miserable.

For instance, it does not measure the recent losses most people experienced in the NET WORTH that came as a result of the real estate crash.


Given that for most Americans net worth is in large part tied into the equity position on their homes, I'd say that today's misery index is HUGELY UNDERSTATING the real state of economic misery.
Isn't there also a difference in the way inflation is calculated today compared to 30 to 40 years ago?

Yes there are at least two things that changed as far as I know

1. Fuel and food are NOT included in CPI

2. Subsitution of purchases is now part of the equasion. (they keep changing the theoretical basket of goods, that way, you see?)

Both of these changes tend to statistically significantly understate the REAL rate of inflation that hits the average person.

And by understating the real rate of inflation on real live consumers, social security and other contracts that are have COLAs lose ground in terms of purhasing power Vs inflation.

The simplistic MISERY Index ought to include things like number of prisoners, bankruptsies, and changes in the percentage of people who go on disability.

They might also include suicides per thousand, and crime rates.

And they would, too if anybody in charge of this society actually gave a rat's ass, I think.

The substitution effect leads to substantially OVERstating inflation - even with an evolving basket of goods.

And food and energy are included in the CPI.
 
Its 2011 by my calendar s0n!!!:up:


This is a POLITICS forum, not a history forum. The perception is..........things are shitty and getting shittier. You can post up 1,000 nutty-ass charts and graphs............wont change the level of shittiness a speck.:fu:


ANyway.........only a k00k would post up a historical look at the debt these days. I cant even think of a hysterical enough analogy that would fit.

History is relevant because the GOP is the party that got us into this mess and they want to be put back in power.

It's amazing, isn't it? What's even more amazing is that there are a lot of people who have forgotten how we got in this mess and who was in power when it happened. Those people even talk about our current problems as if Obama cause it. And of course, Republicans are MORE than happy to exploit any and all misunderstanding with a unhealthy dose of misinformation.

Do you know what it reminds me of? It reminds me of all those Fox viewers almost a decade ago who believed that Saddam Hussein was connected to the 9-11 terrorist attacks. Republicans, including members of the Bush administration, implied it, and Fox ramped up the rhetoric to compliment the administration's march to war for nonexistent WMDs in a country that never attacked us and was no threat to us despite ALL the talk of a mushroom cloud being the terrifying "smoking gun" of post armeggedon fear that Iraq was a threat.

One can't help but ask why there's so much ignorance both ten years ago AND today.

Leiter Reports: A Philosophy Blog: Never Underestimate the Stupidity of the American Electorate!

lol! That's because Obama and the Democrats have caused a lot of our terrible problems. You conveniently ignoring that makes you no better than those you're criticizing. Kind of reminds me of all the Dunces who are now cheerleading for this stupid Libya War. Libya a threat to our Nation? Huh Whaa?? No offense but you're coming off as a very disingenuous hypocrite. Everything you just typed actually applies to you as well. Hmm? A real head-scratcher no? Hmm?
 
As far as employment, those of you who consider something that pays $10 per hour a "job" are dimwits. Sorry but $10 per hour isnt going to keep a family going. SO when BOTH SIDES call a 40 hour a week "job" that pays $10 per hour I just laugh. I dont care if its only picking up cigarette butts. $10 per hour is for kids ONLY, no adults. IN FACT THERE SHOULD BE A LAW AGAINST ANYONE OVER 18 ACCEPTING SUCH A SLAVE PITTANCE. A job is one that pays well, not this Mcdonalds garbage. I hear rush talking about how valuable those jobs are. And he expected someone with half a brain to believe that terrible rubbish. Sicko.

Interesting that you want a law that would bring back child labor. That would make a good book title. JOBS FOR DIMWITTED KIDS.

I read somewhere that a lot of families have both parents working. If they both make $10 an hour the family income comes to $20 an hour. Not great, but a living can be made on that amount.

Most of the good paying jobs go to those with a marketable skill or with an education that meet the requirements of specific jobs. A degree in social studies won't qualify anyone for a job as an Electrical Engineer.

Reading between the lines, are you suggesting that unemployment was low during Bush's terms in office because of jobs at MacDonalds? If you are, I will agree to compare the UE figures minus those jobs with the present 9.1% UE minus those jobs.

You have me at a disadvantage since I don't listen to Rush. Did he offer a rationale for his 'rubbish.?
 
Last edited:
This is one of the tactics I've always found objectionable when partisans (from either party) try to use it as a pseudo get-out-of-jail-free-card to evade responsibility for active policies of their own party by somehow insinuating that a congressional majority by the "other" party means that no responsibility can be attributed to their own party which just so happens to run the executive branch AND, all the cabinet posts, the regulatory boards, and their policy apparatus.

Edit to add: Keep in mind that Bush 43 never vetoed one spending bill (or any bill of any kind) in his first six years in office.

I fault Bush for not using his veto during the six years he had a Republican majority to put a brake on spending, but his policies did keep people employed. You do understand that when the Democrats took control of the purse strings in 2007, things went to hell in a hand basket don't you?

Object all you want too, but that is not a tactic, it is a fact!

It's a fact like the following statement is a fact:

America was not attacked by terrorists on our home soil until Bush 43 became president.

Even IF I could convincingly make a case that Bush wasn't paying much attention to the Aug 6 PDB that Condi Rice presented to Bush while he was on vacation in Texas, I certainly couldn't expect anyone to accept the premise that Bush was the cause of the attack.

In other words, you are using a false premise that there is somehow a cause and effect between Congress being taken over by Democrats in 2006 and the economy tanking in 2007. If you want to do that, present some evidence where the Democratic Congress overturned a presidential veto and forced a spending bill or some kind of other major legislation on the country against the expressed wishes of our then Decider-in-Chief.

Clinton said it much better than I can:

President Clinton put it best today to Chris Cuomo of ABC News:

"I think the responsibility the Democrats have may rest more in resisting any efforts by Republicans in the Congress or by me when I was President to put some standards and tighten up a little on Fannie Mae and Freddie Mac."

Frank and others like him might have had good intentions in pushing Fannie Mae and Freddie Mac to make home loans for low-income, high-risk customers. But from the 1990s to 2007, the Democrats simply closed their eyes to the mounting threat that these reckless, highly secretive operations posed to our entire financial system

The present problem with our economy was caused by the collapse of the housing boom that was aided and abetted by the likes of Barney Frank et al.
 
Its 2011 by my calendar s0n!!!:up:


This is a POLITICS forum, not a history forum. The perception is..........things are shitty and getting shittier. You can post up 1,000 nutty-ass charts and graphs............wont change the level of shittiness a speck.:fu:


ANyway.........only a k00k would post up a historical look at the debt these days. I cant even think of a hysterical enough analogy that would fit.

History is relevant because the GOP is the party that got us into this mess and they want to be put back in power.

It's amazing, isn't it? What's even more amazing is that there are a lot of people who have forgotten how we got in this mess and who was in power when it happened. Those people even talk about our current problems as if Obama caused it. And of course, Republicans are MORE than happy to exploit any and all misunderstanding with a unhealthy dose of misinformation.

Do you know what it reminds me of? It reminds me of all those Fox viewers almost a decade ago who believed that Saddam Hussein was connected to the 9-11 terrorist attacks. Republicans, including members of the Bush administration, implied it, and Fox ramped up the rhetoric to compliment the administration's march to war for nonexistent WMDs in a country that never attacked us and was no threat to us despite ALL the talk of a mushroom cloud being the terrifying "smoking gun" of post armeggedon proof that Iraq was a threat.

One can't help but ask why there's so much ignorance both ten years ago AND today.

Leiter Reports: A Philosophy Blog: Never Underestimate the Stupidity of the American Electorate!

It is rather difficult to imagine the ignorance on display here. One sentence should suffice.

In 1981 Israeli aircraft destroyed the Osirak nuclear reactor at Tuwaitha.

http://www.fas.org/nuke/guide/iraq/nuke/program.htm
 
The water is 80 degrees, the margaritas are crisp. What misery? LMAO! I was thinking that if we didn't have partys, who would we blame. Here is the president misery index. :eek: LMAO!!

Natl_Debt_Chart_2006-738252_ef128.gif


Its 2011 by my calendar s0n!!!:up:


This is a POLITICS forum, not a history forum. The perception is..........things are shitty and getting shittier. You can post up 1,000 nutty-ass charts and graphs............wont change the level of shittiness a speck.:fu:


ANyway.........only a k00k would post up a historical look at the debt these days. I cant even think of a hysterical enough analogy that would fit.

History is relevant because the GOP is the party that got us into this mess and they want to be put back in power.

How did the GOP put us in this mess?
with your deficit chart?
its go what to do with 14 trillion?
they have added about 45% of that and had to fight 2 wars at the same time from 01-08
lets not forget that the dems run congress most of that time also

So I ask you again
what mess?
Obama's?

The misery index shows the path to the truth
you want to defend the man in the white house, PLEASE when, how?
 
What exactly did the GOP do to get us in this mess?
put your reasons on the table

you think the deficit prior to 2008 was a problem?

You think we can fight 2 wars without having debt?

What exactly is it that the failed stimulus as well as HO use of tarp with his health care reform bill that we cannot pay for don't you get?

All I ask of all Liberals is examples
accurate and supported with links
like this one
Defending the Reagan Deficits | The Heritage Foundation

This is a Commentary On
Federal Budget Defending the Reagan DeficitsPublished on June 16, 2004 by Brian Riedl Print
Share
Facebook
Twitter
Email
More
Critics of President Reagan's budget deficits should answer one simple question: Would you trade the collapse of communism, your smaller tax burden, some of your income -- and possibly your job -- in exchange for eliminating that $2.1 trillion in added debt?

Coverage of President Reagan's legacy has been generally fair, with one exception. Many say, "Reagan masterfully won the cold war … but those budget deficits." Or "America needed Reagan's infectious optimism … but those budget deficits."

Not all debt is bad. Mortgage debt and student loan debt are worthy investments. No one criticizes President Franklin Roosevelt for the massive debt that financed World War II. Yet the commentators criticizing President Reagan for the $2.1 trillion in added debt (all numbers are in today's dollars) ignore how that debt won the Cold War, lowered the tax burden, and ignited the largest economic boom in American history.

Those who denounce the Reagan deficits should answer the following questions:

Would you bring back the Soviet empire? President Reagan spent $3 trillion on defense, well above the $2.2 trillion baseline. What did that extra $800 billion buy? The end of the Cold War -- saving, perhaps, a billion lives from nuclear extinction.

No less than former Soviet Union Foreign Minister Alexander Bessmertnykh has been quoted crediting President Reagan's defense buildup for the accelerated collapse of the Soviet Union. The fragile communist economy, already stretched thin by substantial defense spending, could not keep up with America's defense buildup. The possibility of American missile defense, and President Reagan's powerful rhetoric, further persuaded the Soviets they could not win the Cold War, and induced the reforms that culminated in the collapse of the Soviet empire -- without America firing a single shot. It was the best $800 billion investment America ever made.

Would you raise the top income-tax rate back to 70 percent? Commentators also blame the 1980s deficits on President Reagan's insistence on reducing taxes in 1981. Yet President Reagan inherited the worst economy since the Great Depression. Excessively high tax rates were discouraging work and investment and therefore damaging the economy while raising little revenue. President Reagan removed barriers to entrepreneurship by reducing tax rates, cutting red tape, and stabilizing the economy, thereby encouraging risk takers. The centerpiece of this policy was a radical series of across-the-board tax cuts that lowered the top income tax rate from 70 percent to 50 percent, and eventually to 28 percent. (It stands at 35 percent today.)
 
The water is 80 degrees, the margaritas are crisp. What misery? LMAO! I was thinking that if we didn't have partys, who would we blame. Here is the president misery index. :eek: LMAO!!

Natl_Debt_Chart_2006-738252_ef128.gif


Its 2011 by my calendar s0n!!!:up:


This is a POLITICS forum, not a history forum. The perception is..........things are shitty and getting shittier. You can post up 1,000 nutty-ass charts and graphs............wont change the level of shittiness a speck.:fu:


ANyway.........only a k00k would post up a historical look at the debt these days. I cant even think of a hysterical enough analogy that would fit.

History is relevant because the GOP is the party that got us into this mess and they want to be put back in power.

No, the Dems had an overwhelming majority for years and made it twice as bad........so they want to keep finger-pointing till the GOP fixes all of the shit they screwed up.
 
In addition that graph means nothing
we created over 40 million jobs from 83-08
and the GOP presidents added about 6 trillion dollars of debt (with mostly a dem congress) during those 12 years they were in charge
with 9-11 and the 19% intrest rates in the early 80s, well you get the picture
Typical CON$ervative fuzzy math, 83-08 is 25 years not 12.

Now, over half of those 40 million jobs were created during Clinton's 8 years, and including interest $12 trillion of the current $14+ trillion in debt came from Reagan, Bush I and Bush II alone.

I am sorry
thats 20 years with 6 trillion in debt
14 trillion?
bull shit
thats a lie and you know it unless you add interest
then Obama has added about 5 trillion

Bush Deficit vs. Obama Deficit in Pictures | The Foundry: Conservative Policy News Blog from The Heritage Foundation
there is GWB
there is Ron Reagan s
Defending the Reagan Deficits | The Heritage Foundation

about 5 trilion there if you allow 50% of 09s to GWB (he had little to do with it) with both of them
this is called truth with links

oh yea you want add interest
There was never a surplus then
your call
Bush II racked up $6 trillion in debt in his 8 fiscal years alone!!!!!!!
How stupid do you have to be to swallow that phony deficit chart from the extremist Heritage Foundation. I love how you admit the chart is in error showing a surplus for 2000 and 2001 but still you are stupid enough to swallow the rest of the phony chart. :lol: Obviously you something other than the Heritage chart you linked to to claim there was no surplus in 2000 and 2001, so why didn't you use that same source for the Bush II fiscal years???? Don't you see that you reveal that you know you are lying when you deny Bush II ran up $6 trillion in debt!!!
 

Forum List

Back
Top