Obama: Be Prepared for Global Warming Spawned Super Hurricanes

Wasn't Sandy 2012?


Yes. And when the storm came ashore it was barely a Cat 1. If you want to see some truly devastating hurricanes I suggest you go back to the 1950's and 1960's for some real doozies. You idiots are all alike you bleat these warnings about impending doom and ignore the simple fact that the storms of today are much, much less powerful than those from the past. If you want to read about a truly epic storm I suggest you look up the Great Flood of 1862 which struck the west coast of the USA and turned the entire Central Valley of California, all 300 miles of it, into a lake. The storm extended as far east as Colorado and impacted the entire west coast.

Your supposed facts simply are not that compelling in light of actual history.

Perhaps the warning was about people being careful and avoiding harm? You sound like some halfwit whining about having to walk miles to school in the snow back in the tough old days. Wanna tell us about the great Mississippi flood of 1927? It was a doozy. So I guess we don't ever need to pay any attention to flooding anymore.


Avoiding harm would be a very good idea. Speaking of the Mississippi, have you any idea how wide the flood plain is for the river? Just curious about the level of you knowledge. Then, when you come up with the number, answer me why that is important to the conversation.
 
Wasn't Sandy 2012?


Yes. And when the storm came ashore it was barely a Cat 1. If you want to see some truly devastating hurricanes I suggest you go back to the 1950's and 1960's for some real doozies. You idiots are all alike you bleat these warnings about impending doom and ignore the simple fact that the storms of today are much, much less powerful than those from the past. If you want to read about a truly epic storm I suggest you look up the Great Flood of 1862 which struck the west coast of the USA and turned the entire Central Valley of California, all 300 miles of it, into a lake. The storm extended as far east as Colorado and impacted the entire west coast.

Your supposed facts simply are not that compelling in light of actual history.

Perhaps the warning was about people being careful and avoiding harm? You sound like some halfwit whining about having to walk miles to school in the snow back in the tough old days. Wanna tell us about the great Mississippi flood of 1927? It was a doozy. So I guess we don't ever need to pay any attention to flooding anymore.

Simple.. Get folks to pay attention to flooding and building in risk areas WITHOUT exaggerating tales about Global Warming. Then we all agree..

I'm sorry you disagree with the vast majority of the scientific community, not my problem.


Ahhhh, but it IS your problem. What you have resorted to is called a logical fallacy. the reason for that is all of those scientists you reference are all personally invested in their tall tale. The second that personal wealth, and prestige become wrapped up in an issue they lose all credibility. Please show me a single climatologist who does not directly benefit from the fraud that is AGW "theory" who supports it as blindly as you do.
 
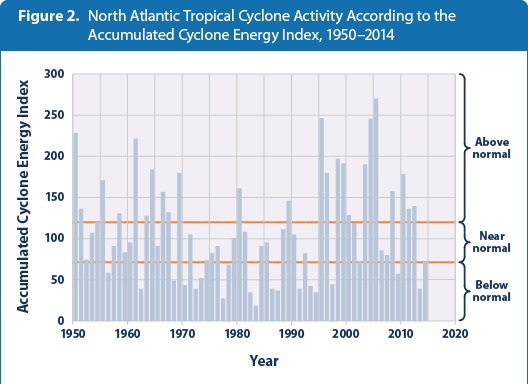
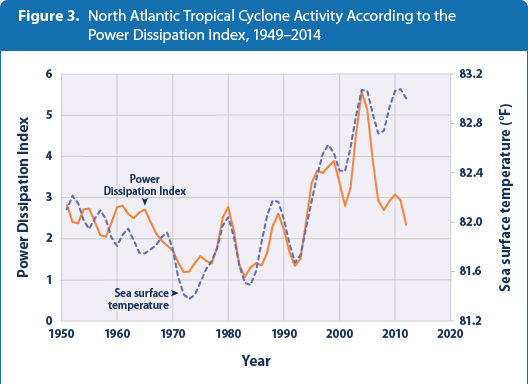
The fallacy is yours Westwall. You are ignoring the increase in the average intensity of storms. If you want to put every storm in the last thousand years up against those of the last 50, you can probably find some doozies, but your comparisons are meaningless. I suggest you read:

National Climate Assessment

Weather and Climate | Climate Change | US EPA

What is the link between hurricanes and global warming?

NATS_frequency.gif


Tropical Cyclone Activity | Climate Change | US EPA

cyclones-figure2-2015.png


cyclones-figure3-2015.png


The average intensity has not risen in any measurable way. Feel free to link to studies that produced those COMPUTER MODELED graphs. Those aren't data silly boy. Those are fiction.
 
Wasn't Sandy 2012?
Sandy was Cat 1, barely a hurricane when it hit the US.

Sounded like quite an event with a sizable economic impact. I’m not sure arbitrary storm categorizations by meteorologists indicate a given universal level of destruction to all locations, but whatever. Has nothing to do with the thread’s purpose.

A real hurricane hit MY in 1938 and made Montauk Point an island for a spell. Sandy was ...meh in comparison
 
Sandy wasn't much for wind but she had developed a doozy of a surge and the effect of that surge was exacerbated by the increased sea level we now enjoy.
 
Trenberth is among the handful of GWarning "scientists" that are activists FIRST and lab coated researchers 2nd. This is the guy who LEFT out the MASSIVE Ocean thermal storage in his 1st famous "energy budget" papers and then DISCOVERED that the oceans store heat only when the temperatures refused to climb at his beckoned call for a couple decades recently. He is ALWAYS inserting himself in every convenient event.

You mean "Earth’s Annual Global Mean Energy Budget" by Kiehl & Trenberth (1997)? Assuming you have actually read the paper, I'd suggest you go find someone to explain it to you, with a particular focus on what the term "equilibrium" means. More likely, you've just read some WUWT / Heartland bull crap, and mindlessly regurgitate that spew.

Thanks for the hurricane primer. I am somewhat aware that the conditions for their formation are somewhat unique, which is why we don't see dozens of these critters every day. However, the trend, as so often, is not your (and your denialist ilk's) friend, as Crick demonstrated above.
 
Sandy wasn't much for wind but she had developed a doozy of a surge and the effect of that surge was exacerbated by the increased sea level we now enjoy.


Wow, a whole millimeter did all of that? :laugh::laugh::laugh::laugh::laugh:
 
Trenberth is among the handful of GWarning "scientists" that are activists FIRST and lab coated researchers 2nd. This is the guy who LEFT out the MASSIVE Ocean thermal storage in his 1st famous "energy budget" papers and then DISCOVERED that the oceans store heat only when the temperatures refused to climb at his beckoned call for a couple decades recently. He is ALWAYS inserting himself in every convenient event.

You mean "Earth’s Annual Global Mean Energy Budget" by Kiehl & Trenberth (1997)? Assuming you have actually read the paper, I'd suggest you go find someone to explain it to you, with a particular focus on what the term "equilibrium" means. More likely, you've just read some WUWT / Heartland bull crap, and mindlessly regurgitate that spew.

Thanks for the hurricane primer. I am somewhat aware that the conditions for their formation are somewhat unique, which is why we don't see dozens of these critters every day. However, the trend, as so often, is not your (and your denialist ilk's) friend, as Crick demonstrated above.


Really? You all have been claiming that the US would be constantly hit by terrible hurricanes and it has been YEARS since a Cat3 or better has made landfall. It seems it's you, and your ilk, who are wrong.
 
Wasn't Sandy 2012?
Sandy was Cat 1, barely a hurricane when it hit the US.

Sounded like quite an event with a sizable economic impact. I’m not sure arbitrary storm categorizations by meteorologists indicate a given universal level of destruction to all locations, but whatever. Has nothing to do with the thread’s purpose.

See that's the thing. Economic impact is NOT the same as the strength of a storm

We are more and more densely populated especially along the coasts so of course any storm will have a bigger economic impact than it would have in the past

Another example of liberal spin

Or another reason to warn citizens in potential storm impact areas to take heed and be safe. Which is all the original Obama message was all about. You're free to keep pretending whatever you like.

Yeah and you didn't build that

Everything Obama says is part of his agenda to politicize everything from soup to nuts
 
Poor Crick with his CantReadAGraph (CRAG) syndrome. Falls for YET MORE SkepshitScience bullshit. But this time -- it's hysterical..


NATS_frequency.gif


Only the cartoonist zealots at SkepShitScience could put a horizontal axis on a graph that ENDS in 2005, and then CRAYON IN --- a point labeled 1998 to 2007... It's a fucking cartoon. Not a chart of anything close to reality.

WHY the fuck do you live in intellectual gutters???

hurricane-frequency.jpg


THIS is what has happened in the Atlantic Since 1945... Lying bastards at SShit will prey on the stupid.. .

When you only look at TROPICAL STORMS --- like those devious SkepShits did (before they got tthe crayons out) you see the advent of satellites capable of FINDING a mere 4 or 6 hour storm that barely triggers the definition of a Trop storm. And satellites like that were around from 1980 on. Also more ocean buoys and P3 flights going out more often to check on "invest areas"..
 
Last edited:
And watch btw.........we'll finally get a landfall hit with a hurricane this summer ( after 10 years of eggs ) and the meatheads will say, "We told you so!!!"

Watch....................waaaaaaaaaaatch!!!:eusa_dance::eusa_dance::eusa_dance:
 
Trenberth is among the handful of GWarning "scientists" that are activists FIRST and lab coated researchers 2nd. This is the guy who LEFT out the MASSIVE Ocean thermal storage in his 1st famous "energy budget" papers and then DISCOVERED that the oceans store heat only when the temperatures refused to climb at his beckoned call for a couple decades recently. He is ALWAYS inserting himself in every convenient event.

You mean "Earth’s Annual Global Mean Energy Budget" by Kiehl & Trenberth (1997)? Assuming you have actually read the paper, I'd suggest you go find someone to explain it to you, with a particular focus on what the term "equilibrium" means. More likely, you've just read some WUWT / Heartland bull crap, and mindlessly regurgitate that spew.

Thanks for the hurricane primer. I am somewhat aware that the conditions for their formation are somewhat unique, which is why we don't see dozens of these critters every day. However, the trend, as so often, is not your (and your denialist ilk's) friend, as Crick demonstrated above.


Crick didn't demonstrate shit because he clings to the worse science website on the web for his info.. Ain't even close to plots of REAL data. See my previous post.

And Yes -- that Trenberth.. Doesn't matter if it assumes EQUILIBRIUM. Because even at equilibrium, A LOT of the forcing power goes into storage. He even took liberties with the term "Energy" because w/m2 is POWER not energy. If you never account for it in an equilibrium snapshot -- it never goes into the ocean. SO -- it would never INCREASE.. But Lo and Behold his explanation circa 2011 for "the hiatus" found a BUNCH of Energy storage in the deep oceans that simply snuck right in without accounting on his "energy budget"..

YET --- this genius managed to balance out 1000s of Watts and find EXACTLY the GW 0.8% or so he was expecting to find in all those GROSS estimates of Power flows. It was literally a God-like moment to pull the EXACTLY expected numbers out of that "envelope" calculation. Even tho 10 yrs or so later -- he finds he missed an "equilibrium imbalance" of a considerable amount due to neglecting the LARGEST pool of global warmth on the planet.

Strange he got the right answer ---- huh???

And if doubt it was an envelope calculation -- Go fetch me the EXACT Global land and ocean IR BlackBody radiation numbers... At least to less than 0.8% precision..


Now who did I need to talk to understand this elementary stuff??? Some of us ARE scientists and can browse a Scientific American with topics outside our immediate day to day work...
 
Last edited:
Trenberth is among the handful of GWarning "scientists" that are activists FIRST and lab coated researchers 2nd. This is the guy who LEFT out the MASSIVE Ocean thermal storage in his 1st famous "energy budget" papers and then DISCOVERED that the oceans store heat only when the temperatures refused to climb at his beckoned call for a couple decades recently. He is ALWAYS inserting himself in every convenient event.

You mean "Earth’s Annual Global Mean Energy Budget" by Kiehl & Trenberth (1997)? Assuming you have actually read the paper, I'd suggest you go find someone to explain it to you, with a particular focus on what the term "equilibrium" means. More likely, you've just read some WUWT / Heartland bull crap, and mindlessly regurgitate that spew.

Thanks for the hurricane primer. I am somewhat aware that the conditions for their formation are somewhat unique, which is why we don't see dozens of these critters every day. However, the trend, as so often, is not your (and your denialist ilk's) friend, as Crick demonstrated above.


Crick didn't demonstrate shit because he clings to the worse science website on the web for his info.. Ain't even close to plots of REAL data. See my previous post.

And Yes -- that Trenberth.. Doesn't matter if it assumes EQUILIBRIUM. Because even at equilibrium, A LOT of the forcing power goes into storage. He even took liberties with the term "Energy" because w/m2 is POWER not energy. If you never account for it in an equilibrium snapshot -- it never goes into the ocean. SO -- it would never INCREASE.. But Lo and Behold his explanation circa 2011 for "the hiatus" found a BUNCH of Energy storage in the deep oceans that simply snuck right in without accounting on his "energy budget"..

YET --- this genius managed to balance out 1000s of Watts and find EXACTLY the GW 0.8% or so he was expecting to find in all those GROSS estimates of Power flows. It was literally a God-like moment to pull the EXACTLY expected numbers out of that "envelope" calculation. Even tho 10 yrs or so later -- he finds he missed an "equilibrium imbalance" of a considerable amount due to neglecting the LARGEST pool of global warmth on the planet.

Strange he got the right answer ---- huh???

And if doubt it was an envelope calculation -- Go fetch me the EXACT Global land and ocean IR BlackBody radiation numbers... At least to less than 0.8% precision..


Now who did I need to talk to understand this elementary stuff??? Some of us ARE scientists and can browse a Scientific American with topics outside our immediate day to day work...

FCT, are you now claiming to be a scientist? PhD? Paid researcher? Are you getting YOUR material published with YOUR name on it?
 
Poor Crick with his CantReadAGraph (CRAG) syndrome. Falls for YET MORE SkepshitScience bullshit. But this time -- it's hysterical..


NATS_frequency.gif


Only the cartoonist zealots at SkepShitScience could put a horizontal axis on a graph that ENDS in 2005, and then CRAYON IN --- a point labeled 1998 to 2007... It's a fucking cartoon. Not a chart of anything close to reality.

WHY the fuck do you live in intellectual gutters???

hurricane-frequency.jpg


THIS is what has happened in the Atlantic Since 1945... Lying bastards at SShit will prey on the stupid.. .

When you only look at TROPICAL STORMS --- like those devious SkepShits did (before they got tthe crayons out) you see the advent of satellites capable of FINDING a mere 4 or 6 hour storm that barely triggers the definition of a Trop storm. And satellites like that were around from 1980 on. Also more ocean buoys and P3 flights going out more often to check on "invest areas"..


Tell us, oh graphing expert, where you would plot an average taken from 1998-2007?
 
Trenberth is among the handful of GWarning "scientists" that are activists FIRST and lab coated researchers 2nd. This is the guy who LEFT out the MASSIVE Ocean thermal storage in his 1st famous "energy budget" papers and then DISCOVERED that the oceans store heat only when the temperatures refused to climb at his beckoned call for a couple decades recently. He is ALWAYS inserting himself in every convenient event.

You mean "Earth’s Annual Global Mean Energy Budget" by Kiehl & Trenberth (1997)? Assuming you have actually read the paper, I'd suggest you go find someone to explain it to you, with a particular focus on what the term "equilibrium" means. More likely, you've just read some WUWT / Heartland bull crap, and mindlessly regurgitate that spew.

Thanks for the hurricane primer. I am somewhat aware that the conditions for their formation are somewhat unique, which is why we don't see dozens of these critters every day. However, the trend, as so often, is not your (and your denialist ilk's) friend, as Crick demonstrated above.


Crick didn't demonstrate shit because he clings to the worse science website on the web for his info.. Ain't even close to plots of REAL data. See my previous post.

And Yes -- that Trenberth.. Doesn't matter if it assumes EQUILIBRIUM. Because even at equilibrium, A LOT of the forcing power goes into storage. He even took liberties with the term "Energy" because w/m2 is POWER not energy. If you never account for it in an equilibrium snapshot -- it never goes into the ocean. SO -- it would never INCREASE.. But Lo and Behold his explanation circa 2011 for "the hiatus" found a BUNCH of Energy storage in the deep oceans that simply snuck right in without accounting on his "energy budget"..

YET --- this genius managed to balance out 1000s of Watts and find EXACTLY the GW 0.8% or so he was expecting to find in all those GROSS estimates of Power flows. It was literally a God-like moment to pull the EXACTLY expected numbers out of that "envelope" calculation. Even tho 10 yrs or so later -- he finds he missed an "equilibrium imbalance" of a considerable amount due to neglecting the LARGEST pool of global warmth on the planet.

Strange he got the right answer ---- huh???

And if doubt it was an envelope calculation -- Go fetch me the EXACT Global land and ocean IR BlackBody radiation numbers... At least to less than 0.8% precision..


Now who did I need to talk to understand this elementary stuff??? Some of us ARE scientists and can browse a Scientific American with topics outside our immediate day to day work...

FCT, are you now claiming to be a scientist? PhD? Paid researcher? Are you getting YOUR material published with YOUR name on it?

Yeah... We've been thru this before.. Ain't gonna refresh your poor memory.. Suggest you take notes and come to class more often.
 
Last edited:
Poor Crick with his CantReadAGraph (CRAG) syndrome. Falls for YET MORE SkepshitScience bullshit. But this time -- it's hysterical..


NATS_frequency.gif


Only the cartoonist zealots at SkepShitScience could put a horizontal axis on a graph that ENDS in 2005, and then CRAYON IN --- a point labeled 1998 to 2007... It's a fucking cartoon. Not a chart of anything close to reality.

WHY the fuck do you live in intellectual gutters???

hurricane-frequency.jpg


THIS is what has happened in the Atlantic Since 1945... Lying bastards at SShit will prey on the stupid.. .

When you only look at TROPICAL STORMS --- like those devious SkepShits did (before they got tthe crayons out) you see the advent of satellites capable of FINDING a mere 4 or 6 hour storm that barely triggers the definition of a Trop storm. And satellites like that were around from 1980 on. Also more ocean buoys and P3 flights going out more often to check on "invest areas"..


Tell us, oh graphing expert, where you would plot an average taken from 1998-2007?

Since when does the AVERAGE conveniently fit onto an existing yearly point anyways. Should have been marked as bar lines. And you don't include any "averages or trend lines" that fit to data OUTSIDE the range of your graph. Didn't even seem to plot from 2004 or 2005.. It's a cartoon Bullwinkly.

And it's purposely deceptive including tropical storms that have been redefined and were largely undetectable prior to about 1980.. The chart I gave above goes back to 1944 or so. THAT's the reality of the Atl. Hurricanes.

THO ---- strangely enough. I could not find ANY CHARTS that went up to 2015.. Since NOAA would be the most likely to publish that crap ---- WHY do you think that might be? (Nobody wants that to be seen).. It's embarrassing..
 
IN 2000 as the pause was just getting started they needed something scary, so they began to name storms before they reached Category 1 status and were nothing more than low probability tropical depressions. SO the graphing by crick that shows this rapid rise in named storms at 2000 was an artifact of simply drumming up fear by changing the metric by which storms were named.

Always smoke and mirrors with alarmists.. These lying bastards will try, say, or lie anything to forward their total control political Agenda.
 
upload_2016-6-2_20-27-42.png


I guess the skeptical crayon kids site is so dam dishonest.. Here is the real info to date..

Source

IF you take the time to read the site you find they are naming tropical depressions reaching just 40mph..
 

Forum List

Back
Top