Translation: you can't read a chart.And what % of green house gases is co2 vs water vapor?
Water vapor has a bigger effect. Now, why do you think that matters?
I'll help you out. Additional water vapor quickly rains out. Additional CO2 stays around.
Unless, of course, CO2 raises the temperature, which raises the amount of water vapor the atmosphere can hold. That's why water vapor is a feedback, not a forcing. More CO2 causes more water vapor. More water vapor does not cause more CO2.
And where's the uncontrolled temperature increase predicted by your consensus? What happened to it?
Which of your kook leaders told you a "uncontrolled temperature increase " was predicted?
I'm being charitable there, by assuming you're just hopelessly brainwashed instead of dishonest. If that's not the case, let us know.
Why are the Polar Bears doing so well? Why haven't they died yet as predicted by your consensus?
Same thing. Did your DearLeaders brainwash you into saying something that crazy, or are you being deliberately dishonest?Oh, ReallyKrazyMoron, of course there is a "cycle for CO2". Every year enormous amounts of CO2 are naturally released and absorbed, and this process had remained in a homeostatic balance for millions of years. However, since the time when mankind started burning fossil fuels, humans have added an un-natural component to the mix in the form of fossil carbon that had been locked away from the atmosphere for tens or hundreds of millions of years. There are no new carbon sinks to absorb this new, extra, un-natural CO2 (although the oceans have absorbed a lot of what mankind has released, but there is a fast approaching limit to how much CO2 they can absorb, plus this process is causing ocean acidification and severely endangering the ocean ecologies), so it has been accumulating in the atmosphere, raising CO2 levels by about 43% so far, from 280ppm to over 400ppm. The residence time of this extra CO2 in our atmosphere is from centuries to several thousand years. That's the time it would take natural processes to remove the extra CO2 and lower CO2 levels to their pre-industrial levels.Moron thinks there's no cycle for CO2. All that excess CO2 just sticks around like unused bacon grease in your fridge till there's no more room in the fridge and we all die!
Common Climate Misconceptions: Atmospheric Carbon Dioxide
Yale University - Climate Connections
Zeke Hausfather —
December 16, 2010
Understanding the carbon cycle is a key part of understanding the broader climate change issue. But a number of misconceptions floating around the blogosphere confuse basic concepts to argue that climate change is irrelevant because of the short residence time of carbon molecules in the atmosphere and the large overall carbon stock in the environment.
It turns out that while much of the “pulse” of extra CO2 accumulating in the atmosphere would be absorbed over the next century if emissions miraculously were to end today, about 20 percent of that CO2would remain for at least tens of thousands of years.
The complex global carbon cycle process involves carbon absorption and release by the atmosphere, oceans, soils, and organic matter, and also emissions from anthropogenic fossil fuel combustion and land-use changes. The figure below shows the best estimate of annual carbon fluxes from main sources and sinks.

View larger image - Figure from Oak Ridge National Laboratories (Units in gigatons of carbon).
At first glance, it may seem that the narrow black arrows representing anthropogenic sources are relatively insignificant, making up only a few percent of the total carbon released to the atmosphere in any given year. To understand why anthropogenic emissions are of concern, it is important to think of the carbon cycle as a balance of sorts; every year around 230 gigatons of carbon dioxide are released to the atmosphere, and around 230 gigatons of carbon dioxide are absorbed by the world’s oceans and biosphere. This balance forms an equilibrium of sorts, with the level of atmospheric carbon dioxide remaining largely unchanged over time. However, anthropogenic emissions throw this process out of kilter, adding a new source of emissions unmatched by additional sinks.
The carbon dioxide record over the past 10,000 years demonstrates this situation: the modern period exhibits a large spike in atmospheric carbon dioxide coincident to the time humans started burning fossil fuels.

Atmospheric CO2 concentrations over the past 10,000 years. From the IPCC AR4 WG1 SPM.
Graphing emissions over the modern period against changes in atmospheric concentrations illustrates a clear relationship between emissions and increasing CO2 concentrations.

Via Wikipedia.
It is important to note that not all anthropogenic emissions are accumulating in the atmosphere. Indeed, about half of annual CO2 emissions are absorbed by the ocean and vegetation, and this percentage of absorption, called the airborne fraction, is currently the subject of vigorous debate over whether or not it is changing over time. Scientists can model the absorption of anthropogenic carbon by year for different sinks.

Image from the Global Carbon Project.
Determining the residence time of carbon dioxide in the atmosphere is a rather complex problem. A common misconception arises from simply looking at the annual carbon flux and the atmospheric stock; after all, with 230 gigatons absorbed by the oceans and land every year, and a total atmospheric stock of 720 gigatons, one might expect the average molecule of CO2 to remain in the atmosphere for only three to four years.
Such an approach poorly frames the issue, however. It is not the residence time of an individual molecule that is relevant. What really matters is just how long it will take for the stock of anthropogenic carbon emissions that has accumulated in the atmosphere to be reabsorbed.
The simplest way to approximate the time it will take to reabsorb the anthropogenic flux is to calculate how long it would take for the atmosphere to revert to preindustrial levels of 280 parts per million if humans could cease emissions immediately. If the current net sink of around 4 gigatons of carbon per year remained constant over time, it would take about 50 years for the atmosphere to return to 280 ppm. However, there is no reason to think that these sinks would remain constant as emissions decrease. Indeed, it is more realistic to anticipate that the net sink would shrink in proportion to the decrease in emissions.
Scientists can approach this problem in a number of different ways. They can use models of carbon sink behavior based on their best knowledge of the physics of ocean carbon absorption and the biosphere. They can also use records of changes in atmospheric carbon dioxide during glacial periods in the distant past to estimate the time it takes for perturbations to settle out.
Using a combination of various methods, researchers have estimated that about 50 percent of the net anthropogenic pulse would be absorbed in the first 50 years, and about 70 percent in the first 100 years. Absorption by sinks slows dramatically after that, with an additional 10 percent or so being removed after 300 years and the remaining 20 percent lasting tens if not hundreds of thousands of years before being removed.
As University of Washington scientist David Archer explains, this “long tail” of absorption means that the mean lifetime of the pulse attributable to anthropogenic emissions is around 30,000 to 35,000 years.

Figure via Global Warming Art.
So while a good portion of warming attributable to carbon and other greenhouse gas emissions would be removed from the atmosphere in a few decades if emissions were somehow ceased immediately, about 10 percent will continue warming Earth for eons to come. This 10 percent is significant, because even a small increase in atmospheric greenhouse gases can have a large impact on things like ice sheets and sea level if it persists over the millennia.Well, of course you are. You demonstrate that fact with every post you make, ReallyKrazyMoron.what a moron..
Right....big words confuse you....LOL.homeostatic balance...
For two and a half million years CO2 levels have not exceeded 300ppm."get this... for "millions" of years.
For two and a half million years CO2 levels have only varied between 270ppm to 300ppm during the interglacial periods and between 170ppm and 190ppm during the periods of heavy glaciation.
For the last ten thousand years CO2 levels levels had remained at about 270-280ppm, until mankind started burning fossil fuels. Natural yearly sources of CO2 emissions were naturally balanced with the natural CO2 sinks and CO2 levels remained naturally balanced. That's called a 'homeostatic balance'. It doesn't mean that nothing changes; it means that the changes in one direction are balanced by the changes in the other direction so things remain in a dynamic balance with general levels of CO2 remaining unchanged. Until mankind came along and upset the balances.
Navigation
Install the app
How to install the app on iOS
Follow along with the video below to see how to install our site as a web app on your home screen.
Note: This feature may not be available in some browsers.
More options
You are using an out of date browser. It may not display this or other websites correctly.
You should upgrade or use an alternative browser.
You should upgrade or use an alternative browser.
2014 On Track To Be Hottest Year On Record
- Thread starter RollingThunder
- Start date
Wyld Kard
Platinum Member
Hilarious. The poor desperate deniers have devolved into all-conspiracy all-the-time nutters. They literally have no other arguments beyond TheGreatSocialistConspiracy.
That's why the whole planet is laughing at them. Get used to your constant humiliation, deniers. After all, you've worked hard to earn all the ridicule you're getting.


And global warming nut-jobs like yourself literally have NOTHING that is based on real science to support the bullshit that you claim.They literally have no other arguments

RollingThunder
Gold Member
- Mar 22, 2010
- 4,818
- 525
- 155
- Thread starter
- #643
Translation: you are too stupid to understand how irrelevant your "chart" is. 4 or 5 hundred million years ago solar output was around 4% lower than current levels. CO2 levels and climate match up quite well under those conditions.Translation: you can't read a chart.And what % of green house gases is co2 vs water vapor?
Water vapor has a bigger effect. Now, why do you think that matters?
I'll help you out. Additional water vapor quickly rains out. Additional CO2 stays around.
Unless, of course, CO2 raises the temperature, which raises the amount of water vapor the atmosphere can hold. That's why water vapor is a feedback, not a forcing. More CO2 causes more water vapor. More water vapor does not cause more CO2.
And where's the uncontrolled temperature increase predicted by your consensus? What happened to it?
Which of your kook leaders told you a "uncontrolled temperature increase " was predicted?
I'm being charitable there, by assuming you're just hopelessly brainwashed instead of dishonest. If that's not the case, let us know.
Why are the Polar Bears doing so well? Why haven't they died yet as predicted by your consensus?
Same thing. Did your DearLeaders brainwash you into saying something that crazy, or are you being deliberately dishonest?Oh, ReallyKrazyMoron, of course there is a "cycle for CO2". Every year enormous amounts of CO2 are naturally released and absorbed, and this process had remained in a homeostatic balance for millions of years. However, since the time when mankind started burning fossil fuels, humans have added an un-natural component to the mix in the form of fossil carbon that had been locked away from the atmosphere for tens or hundreds of millions of years. There are no new carbon sinks to absorb this new, extra, un-natural CO2 (although the oceans have absorbed a lot of what mankind has released, but there is a fast approaching limit to how much CO2 they can absorb, plus this process is causing ocean acidification and severely endangering the ocean ecologies), so it has been accumulating in the atmosphere, raising CO2 levels by about 43% so far, from 280ppm to over 400ppm. The residence time of this extra CO2 in our atmosphere is from centuries to several thousand years. That's the time it would take natural processes to remove the extra CO2 and lower CO2 levels to their pre-industrial levels.Moron thinks there's no cycle for CO2. All that excess CO2 just sticks around like unused bacon grease in your fridge till there's no more room in the fridge and we all die!
Common Climate Misconceptions: Atmospheric Carbon Dioxide
Yale University - Climate Connections
Zeke Hausfather —
December 16, 2010
Understanding the carbon cycle is a key part of understanding the broader climate change issue. But a number of misconceptions floating around the blogosphere confuse basic concepts to argue that climate change is irrelevant because of the short residence time of carbon molecules in the atmosphere and the large overall carbon stock in the environment.
It turns out that while much of the “pulse” of extra CO2 accumulating in the atmosphere would be absorbed over the next century if emissions miraculously were to end today, about 20 percent of that CO2would remain for at least tens of thousands of years.
The complex global carbon cycle process involves carbon absorption and release by the atmosphere, oceans, soils, and organic matter, and also emissions from anthropogenic fossil fuel combustion and land-use changes. The figure below shows the best estimate of annual carbon fluxes from main sources and sinks.
View larger image - Figure from Oak Ridge National Laboratories (Units in gigatons of carbon).
At first glance, it may seem that the narrow black arrows representing anthropogenic sources are relatively insignificant, making up only a few percent of the total carbon released to the atmosphere in any given year. To understand why anthropogenic emissions are of concern, it is important to think of the carbon cycle as a balance of sorts; every year around 230 gigatons of carbon dioxide are released to the atmosphere, and around 230 gigatons of carbon dioxide are absorbed by the world’s oceans and biosphere. This balance forms an equilibrium of sorts, with the level of atmospheric carbon dioxide remaining largely unchanged over time. However, anthropogenic emissions throw this process out of kilter, adding a new source of emissions unmatched by additional sinks.
The carbon dioxide record over the past 10,000 years demonstrates this situation: the modern period exhibits a large spike in atmospheric carbon dioxide coincident to the time humans started burning fossil fuels.
Atmospheric CO2 concentrations over the past 10,000 years. From the IPCC AR4 WG1 SPM.
Graphing emissions over the modern period against changes in atmospheric concentrations illustrates a clear relationship between emissions and increasing CO2 concentrations.
Via Wikipedia.
It is important to note that not all anthropogenic emissions are accumulating in the atmosphere. Indeed, about half of annual CO2 emissions are absorbed by the ocean and vegetation, and this percentage of absorption, called the airborne fraction, is currently the subject of vigorous debate over whether or not it is changing over time. Scientists can model the absorption of anthropogenic carbon by year for different sinks.
Image from the Global Carbon Project.
Determining the residence time of carbon dioxide in the atmosphere is a rather complex problem. A common misconception arises from simply looking at the annual carbon flux and the atmospheric stock; after all, with 230 gigatons absorbed by the oceans and land every year, and a total atmospheric stock of 720 gigatons, one might expect the average molecule of CO2 to remain in the atmosphere for only three to four years.
Such an approach poorly frames the issue, however. It is not the residence time of an individual molecule that is relevant. What really matters is just how long it will take for the stock of anthropogenic carbon emissions that has accumulated in the atmosphere to be reabsorbed.
The simplest way to approximate the time it will take to reabsorb the anthropogenic flux is to calculate how long it would take for the atmosphere to revert to preindustrial levels of 280 parts per million if humans could cease emissions immediately. If the current net sink of around 4 gigatons of carbon per year remained constant over time, it would take about 50 years for the atmosphere to return to 280 ppm. However, there is no reason to think that these sinks would remain constant as emissions decrease. Indeed, it is more realistic to anticipate that the net sink would shrink in proportion to the decrease in emissions.
Scientists can approach this problem in a number of different ways. They can use models of carbon sink behavior based on their best knowledge of the physics of ocean carbon absorption and the biosphere. They can also use records of changes in atmospheric carbon dioxide during glacial periods in the distant past to estimate the time it takes for perturbations to settle out.
Using a combination of various methods, researchers have estimated that about 50 percent of the net anthropogenic pulse would be absorbed in the first 50 years, and about 70 percent in the first 100 years. Absorption by sinks slows dramatically after that, with an additional 10 percent or so being removed after 300 years and the remaining 20 percent lasting tens if not hundreds of thousands of years before being removed.
As University of Washington scientist David Archer explains, this “long tail” of absorption means that the mean lifetime of the pulse attributable to anthropogenic emissions is around 30,000 to 35,000 years.
Figure via Global Warming Art.
So while a good portion of warming attributable to carbon and other greenhouse gas emissions would be removed from the atmosphere in a few decades if emissions were somehow ceased immediately, about 10 percent will continue warming Earth for eons to come. This 10 percent is significant, because even a small increase in atmospheric greenhouse gases can have a large impact on things like ice sheets and sea level if it persists over the millennia.Well, of course you are. You demonstrate that fact with every post you make, ReallyKrazyMoron.what a moron..
Right....big words confuse you....LOL.homeostatic balance...
For two and a half million years CO2 levels have not exceeded 300ppm."get this... for "millions" of years.
For two and a half million years CO2 levels have only varied between 270ppm to 300ppm during the interglacial periods and between 170ppm and 190ppm during the periods of heavy glaciation.
For the last ten thousand years CO2 levels levels had remained at about 270-280ppm, until mankind started burning fossil fuels. Natural yearly sources of CO2 emissions were naturally balanced with the natural CO2 sinks and CO2 levels remained naturally balanced. That's called a 'homeostatic balance'. It doesn't mean that nothing changes; it means that the changes in one direction are balanced by the changes in the other direction so things remain in a dynamic balance with general levels of CO2 remaining unchanged. Until mankind came along and upset the balances.
RollingThunder
Gold Member
- Mar 22, 2010
- 4,818
- 525
- 155
- Thread starter
- #644
Hilarious. The poor desperate deniers have devolved into all-conspiracy all-the-time nutters. They literally have no other arguments beyond TheGreatSocialistConspiracy.
That's why the whole planet is laughing at them. Get used to your constant humiliation, deniers. After all, you've worked hard to earn all the ridicule you're getting.
And global warming nut-jobs like yourself literally have NOTHING that is based on real science to support the bullshit that you claim.They literally have no other arguments
And another extremely ignorant crackpot denier cult retard pops up with more delusional idiocy and bullshit.
The American Geophysical Union (AGU) statement, adopted by the society in 2003, revised in 2007,[54] and revised and expanded in 2013,[55] affirms that rising levels of greenhouse gases have caused and will continue to cause the global surface temperature to be warmer:
“Human activities are changing Earth’s climate. At the global level, atmospheric concentrations of carbon dioxide and other heat-trapping greenhouse gases have increased sharply since the Industrial Revolution. Fossil fuel burning dominates this increase. Human-caused increases in greenhouse gases are responsible for most of the observed global average surface warming of roughly 0.8°C (1.5°F) over the past 140 years. Because natural processes cannot quickly remove some of these gases (notably carbon dioxide) from the atmosphere, our past, present, and future emissions will influence the climate system for millennia.
While important scientific uncertainties remain as to which particular impacts will be experienced where, no uncertainties are known that could make the impacts of climate change inconsequential. Furthermore, surprise outcomes, such as the unexpectedly rapid loss of Arctic summer sea ice, may entail even more dramatic changes than anticipated."
The American Meteorological Society (AMS) statement adopted by their council in 2012 concluded:
There is unequivocal evidence that Earth’s lower atmosphere, ocean, and land surface are warming; sea level is rising; and snow cover, mountain glaciers, and Arctic sea ice are shrinking. The dominant cause of the warming since the 1950s is human activities. This scientific finding is based on a large and persuasive body of research. The observed warming will be irreversible for many years into the future, and even larger temperature increases will occur as greenhouse gases continue to accumulate in the atmosphere. Avoiding this future warming will require a large and rapid reduction in global greenhouse gas emissions. The ongoing warming will increase risks and stresses to human societies, economies, ecosystems, and wildlife through the 21st century and beyond, making it imperative that society respond to a changing climate. To inform decisions on adaptation and mitigation, it is critical that we improve our understanding of the global climate system and our ability to project future climate through continued and improved monitoring and research. This is especially true for smaller (seasonal and regional) scales and weather and climate extremes, and for important hydroclimatic variables such as precipitation and water availability.
Technological, economic, and policy choices in the near future will determine the extent of future impacts of climate change. Science-based decisions are seldom made in a context of absolute certainty. National and international policy discussions should include consideration of the best ways to both adapt to and mitigate climate change. Mitigation will reduce the amount of future climate change and the risk of impacts that are potentially large and dangerous. At the same time, some continued climate change is inevitable, and policy responses should include adaptation to climate change. Prudence dictates extreme care in accounting for our relationship with the only planet known to be capable of sustaining human life.[66]
(source)
Wyld Kard
Platinum Member
Hilarious. The poor desperate deniers have devolved into all-conspiracy all-the-time nutters. They literally have no other arguments beyond TheGreatSocialistConspiracy.
That's why the whole planet is laughing at them. Get used to your constant humiliation, deniers. After all, you've worked hard to earn all the ridicule you're getting.
And global warming nut-jobs like yourself literally have NOTHING that is based on real science to support the bullshit that you claim.They literally have no other arguments
And another extremely ignorant crackpot denier cult retard pops up with more delusional idiocy and bullshit.
The American Geophysical Union (AGU) statement, adopted by the society in 2003, revised in 2007,[54] and revised and expanded in 2013,[55] affirms that rising levels of greenhouse gases have caused and will continue to cause the global surface temperature to be warmer:
“Human activities are changing Earth’s climate. At the global level, atmospheric concentrations of carbon dioxide and other heat-trapping greenhouse gases have increased sharply since the Industrial Revolution. Fossil fuel burning dominates this increase. Human-caused increases in greenhouse gases are responsible for most of the observed global average surface warming of roughly 0.8°C (1.5°F) over the past 140 years. Because natural processes cannot quickly remove some of these gases (notably carbon dioxide) from the atmosphere, our past, present, and future emissions will influence the climate system for millennia.
While important scientific uncertainties remain as to which particular impacts will be experienced where, no uncertainties are known that could make the impacts of climate change inconsequential. Furthermore, surprise outcomes, such as the unexpectedly rapid loss of Arctic summer sea ice, may entail even more dramatic changes than anticipated."
The American Meteorological Society (AMS) statement adopted by their council in 2012 concluded:
There is unequivocal evidence that Earth’s lower atmosphere, ocean, and land surface are warming; sea level is rising; and snow cover, mountain glaciers, and Arctic sea ice are shrinking. The dominant cause of the warming since the 1950s is human activities. This scientific finding is based on a large and persuasive body of research. The observed warming will be irreversible for many years into the future, and even larger temperature increases will occur as greenhouse gases continue to accumulate in the atmosphere. Avoiding this future warming will require a large and rapid reduction in global greenhouse gas emissions. The ongoing warming will increase risks and stresses to human societies, economies, ecosystems, and wildlife through the 21st century and beyond, making it imperative that society respond to a changing climate. To inform decisions on adaptation and mitigation, it is critical that we improve our understanding of the global climate system and our ability to project future climate through continued and improved monitoring and research. This is especially true for smaller (seasonal and regional) scales and weather and climate extremes, and for important hydroclimatic variables such as precipitation and water availability.
Technological, economic, and policy choices in the near future will determine the extent of future impacts of climate change. Science-based decisions are seldom made in a context of absolute certainty. National and international policy discussions should include consideration of the best ways to both adapt to and mitigate climate change. Mitigation will reduce the amount of future climate change and the risk of impacts that are potentially large and dangerous. At the same time, some continued climate change is inevitable, and policy responses should include adaptation to climate change. Prudence dictates extreme care in accounting for our relationship with the only planet known to be capable of sustaining human life.[66]
(source)
And another extremely ignorant crackpot denier cult retard pops up with more delusional idiocy and bullshit.
So says the dumbfuck who drank the Kool-Aid and believed the lies to be true.

Last edited:
Wyld Kard
Platinum Member
It looks like the denier cultists can't stand to face the truth about our rapidly warming planet.
2014 is going to be the hottest year on record which will mean that 14 of the 15 hottest years on record have happened since the beginning of this century.
What a load of bullshit!It looks like the denier cultists can't stand to face the truth about our rapidly warming planet.

The planet has been cooling!
Global warming No the planet is getting cooler World News Daily Express
But I know, dumbfucks like yourself will absolutely refuse to acknowledge or even to consider anything else, if it doesn't support the lies and misinformation that they so faithfully believe in and accept.
Last edited:
ROFL... first the fucking retard says look at the history of co2 levels... then when you show him the history of co2 levels the fucking retard says the history of co2 levels is irrelevant... it's about solar output going up...Translation: you are too stupid to understand how irrelevant your "chart" is. 4 or 5 hundred million years ago solar output was around 4% lower than current levels. CO2 levels and climate match up quite well under those conditions.Translation: you can't read a chart.And what % of green house gases is co2 vs water vapor?
Water vapor has a bigger effect. Now, why do you think that matters?
I'll help you out. Additional water vapor quickly rains out. Additional CO2 stays around.
Unless, of course, CO2 raises the temperature, which raises the amount of water vapor the atmosphere can hold. That's why water vapor is a feedback, not a forcing. More CO2 causes more water vapor. More water vapor does not cause more CO2.
And where's the uncontrolled temperature increase predicted by your consensus? What happened to it?
Which of your kook leaders told you a "uncontrolled temperature increase " was predicted?
I'm being charitable there, by assuming you're just hopelessly brainwashed instead of dishonest. If that's not the case, let us know.
Why are the Polar Bears doing so well? Why haven't they died yet as predicted by your consensus?
Same thing. Did your DearLeaders brainwash you into saying something that crazy, or are you being deliberately dishonest?Oh, ReallyKrazyMoron, of course there is a "cycle for CO2". Every year enormous amounts of CO2 are naturally released and absorbed, and this process had remained in a homeostatic balance for millions of years. However, since the time when mankind started burning fossil fuels, humans have added an un-natural component to the mix in the form of fossil carbon that had been locked away from the atmosphere for tens or hundreds of millions of years. There are no new carbon sinks to absorb this new, extra, un-natural CO2 (although the oceans have absorbed a lot of what mankind has released, but there is a fast approaching limit to how much CO2 they can absorb, plus this process is causing ocean acidification and severely endangering the ocean ecologies), so it has been accumulating in the atmosphere, raising CO2 levels by about 43% so far, from 280ppm to over 400ppm. The residence time of this extra CO2 in our atmosphere is from centuries to several thousand years. That's the time it would take natural processes to remove the extra CO2 and lower CO2 levels to their pre-industrial levels.Moron thinks there's no cycle for CO2. All that excess CO2 just sticks around like unused bacon grease in your fridge till there's no more room in the fridge and we all die!
Common Climate Misconceptions: Atmospheric Carbon Dioxide
Yale University - Climate Connections
Zeke Hausfather —
December 16, 2010
Understanding the carbon cycle is a key part of understanding the broader climate change issue. But a number of misconceptions floating around the blogosphere confuse basic concepts to argue that climate change is irrelevant because of the short residence time of carbon molecules in the atmosphere and the large overall carbon stock in the environment.
It turns out that while much of the “pulse” of extra CO2 accumulating in the atmosphere would be absorbed over the next century if emissions miraculously were to end today, about 20 percent of that CO2would remain for at least tens of thousands of years.
The complex global carbon cycle process involves carbon absorption and release by the atmosphere, oceans, soils, and organic matter, and also emissions from anthropogenic fossil fuel combustion and land-use changes. The figure below shows the best estimate of annual carbon fluxes from main sources and sinks.
View larger image - Figure from Oak Ridge National Laboratories (Units in gigatons of carbon).
At first glance, it may seem that the narrow black arrows representing anthropogenic sources are relatively insignificant, making up only a few percent of the total carbon released to the atmosphere in any given year. To understand why anthropogenic emissions are of concern, it is important to think of the carbon cycle as a balance of sorts; every year around 230 gigatons of carbon dioxide are released to the atmosphere, and around 230 gigatons of carbon dioxide are absorbed by the world’s oceans and biosphere. This balance forms an equilibrium of sorts, with the level of atmospheric carbon dioxide remaining largely unchanged over time. However, anthropogenic emissions throw this process out of kilter, adding a new source of emissions unmatched by additional sinks.
The carbon dioxide record over the past 10,000 years demonstrates this situation: the modern period exhibits a large spike in atmospheric carbon dioxide coincident to the time humans started burning fossil fuels.
Atmospheric CO2 concentrations over the past 10,000 years. From the IPCC AR4 WG1 SPM.
Graphing emissions over the modern period against changes in atmospheric concentrations illustrates a clear relationship between emissions and increasing CO2 concentrations.
Via Wikipedia.
It is important to note that not all anthropogenic emissions are accumulating in the atmosphere. Indeed, about half of annual CO2 emissions are absorbed by the ocean and vegetation, and this percentage of absorption, called the airborne fraction, is currently the subject of vigorous debate over whether or not it is changing over time. Scientists can model the absorption of anthropogenic carbon by year for different sinks.
Image from the Global Carbon Project.
Determining the residence time of carbon dioxide in the atmosphere is a rather complex problem. A common misconception arises from simply looking at the annual carbon flux and the atmospheric stock; after all, with 230 gigatons absorbed by the oceans and land every year, and a total atmospheric stock of 720 gigatons, one might expect the average molecule of CO2 to remain in the atmosphere for only three to four years.
Such an approach poorly frames the issue, however. It is not the residence time of an individual molecule that is relevant. What really matters is just how long it will take for the stock of anthropogenic carbon emissions that has accumulated in the atmosphere to be reabsorbed.
The simplest way to approximate the time it will take to reabsorb the anthropogenic flux is to calculate how long it would take for the atmosphere to revert to preindustrial levels of 280 parts per million if humans could cease emissions immediately. If the current net sink of around 4 gigatons of carbon per year remained constant over time, it would take about 50 years for the atmosphere to return to 280 ppm. However, there is no reason to think that these sinks would remain constant as emissions decrease. Indeed, it is more realistic to anticipate that the net sink would shrink in proportion to the decrease in emissions.
Scientists can approach this problem in a number of different ways. They can use models of carbon sink behavior based on their best knowledge of the physics of ocean carbon absorption and the biosphere. They can also use records of changes in atmospheric carbon dioxide during glacial periods in the distant past to estimate the time it takes for perturbations to settle out.
Using a combination of various methods, researchers have estimated that about 50 percent of the net anthropogenic pulse would be absorbed in the first 50 years, and about 70 percent in the first 100 years. Absorption by sinks slows dramatically after that, with an additional 10 percent or so being removed after 300 years and the remaining 20 percent lasting tens if not hundreds of thousands of years before being removed.
As University of Washington scientist David Archer explains, this “long tail” of absorption means that the mean lifetime of the pulse attributable to anthropogenic emissions is around 30,000 to 35,000 years.
Figure via Global Warming Art.
So while a good portion of warming attributable to carbon and other greenhouse gas emissions would be removed from the atmosphere in a few decades if emissions were somehow ceased immediately, about 10 percent will continue warming Earth for eons to come. This 10 percent is significant, because even a small increase in atmospheric greenhouse gases can have a large impact on things like ice sheets and sea level if it persists over the millennia.Well, of course you are. You demonstrate that fact with every post you make, ReallyKrazyMoron.what a moron..
Right....big words confuse you....LOL.homeostatic balance...
For two and a half million years CO2 levels have not exceeded 300ppm."get this... for "millions" of years.
For two and a half million years CO2 levels have only varied between 270ppm to 300ppm during the interglacial periods and between 170ppm and 190ppm during the periods of heavy glaciation.
For the last ten thousand years CO2 levels levels had remained at about 270-280ppm, until mankind started burning fossil fuels. Natural yearly sources of CO2 emissions were naturally balanced with the natural CO2 sinks and CO2 levels remained naturally balanced. That's called a 'homeostatic balance'. It doesn't mean that nothing changes; it means that the changes in one direction are balanced by the changes in the other direction so things remain in a dynamic balance with general levels of CO2 remaining unchanged. Until mankind came along and upset the balances.
OMFG the fucking retard thinks the sun is heating up because cows are farting on earth... you just can't make up how retarded these libs are.
Old Rocks
Diamond Member
RMK you are the posterboy for willfull ignorance. Your understands of what those posts said is something one might expect of a second grader. A failing one.
Can someone translate this drunken gibberish to English?RMK you are the posterboy for willfull ignorance. Your understands of what those posts said is something one might expect of a second grader. A failing one.
RollingThunder
Gold Member
- Mar 22, 2010
- 4,818
- 525
- 155
- Thread starter
- #650
Thanks for so clearly identifying what you're trying to peddle, retardIt looks like the denier cultists can't stand to face the truth about our rapidly warming planet.
2014 is going to be the hottest year on record which will mean that 14 of the 15 hottest years on record have happened since the beginning of this century.
What a load of bullshit!It looks like the denier cultists can't stand to face the truth about our rapidly warming planet.
YOU ARE SOOOOOO RETARDED!!!The planet has been cooling!
Global warming No the planet is getting cooler World News Daily Express
I cite the Anerican Geophysical Union and the the American Meteorological Society, two preeminent scientific organizations, whose position statements affirm the reality and dangers of anthropogenic global warming and its consequent climate changes, and you respond with some dumbshit article from a rightwingnut British tabloid rag with zero credibility.
So says the dumbfuck who drank the Kool-Aid and believed the lies to be true.
You denier cult retards are always talking to yourselves like this. Why are you all such ignorant clueless imbeciles?But I know, idiots like yourself will absolutely refuse to acknowledge or even to consider anything else, if it doesn't support the lies and misinformation that they so faithfully believe in and accept.
Last edited:
Wyld Kard
Platinum Member
Thanks for so clearly identifying what you're trying to peddle, retardIt looks like the denier cultists can't stand to face the truth about our rapidly warming planet.
2014 is going to be the hottest year on record which will mean that 14 of the 15 hottest years on record have happened since the beginning of this century.
What a load of bullshit!It looks like the denier cultists can't stand to face the truth about our rapidly warming planet.
YOU ARE SOOOOOO RETARDED!!!The planet has been cooling!
Global warming No the planet is getting cooler World News Daily Express
I cite the Anerican Geophysical Union and the the American Meteorological Society, two preeminent scientific organizations, whose position statements affirm the reality and dangers of anthropogenic global warming and its consequent climate changes, and you respond with some dumbshit article from a rightwingnut British tabloid rag with zero credibility.
You denier cult retards are always talking to yourselves like this. Why are you all such ignorant clueless imbeciles?But I know, idiots like yourself will absolutely refuse to acknowledge or even to consider anything else, if it doesn't support the lies and misinformation that they so faithfully believe in and accept.
Do YOU have a problem with the truth, Rolling Blunder? Apparently YOU do.Thanks for so clearly identifying what you're trying to peddle, retard
And what are YOU and the other nut-jobs peddling, hoping to convince others that global warming / climate change is real? Oh, that right, BULLSHIT, upon more BULLSHIT!
YOU ARE SOOOOOO FUCKING IGNORANT! Must be the Kool-Aid!
I cite the Anerican Geophysical Union and the the American Meteorological Society, two preeminent scientific organizations,
Not only do YOU cite bullshit as usual, but apparently YOU can't spell either. The word is American NOT Anerican you dumbfuck!
That's a question YOU should ask yourself and other ignorant shit-for-brains that bought into the bullshit lies and misinformation of global warming / climate change without question.Why are you all such ignorant clueless imbeciles?
Try again!
Last edited:
Old Rocks
Diamond Member
 How temperatures across the globe ranked from January through October 2014.
Click image to enlarge. Credit: NOAA
Warm Ocean Waters Boosting Typhoons Record Heat Climate Central
Some have cited this widespread ocean warmth as the beginning of the end of the pause, or hiatus, in the rate of planetary warming, with rates of warming demonstrably slower over the past few decades than in the previous ones. The ocean stores much of the heat absorbed by the excess greenhouse gases in the atmosphere, so it could be beginning of that heat being unleashed back into the atmosphere.
For the year through October, the average ocean temperature for the planet was a record high,according to NOAA data. That was a significant factor in the same period being the warmest first 10 months on record, 1.22°F higher than the 20th century average of 57.4°F. If November and December continue on pace, 2014 could best 2010 as the warmest year on record and would mean that 14 of the 15 warmest years all occurred in the 21st century
Looks like 2015 is shaping up to be a very warm year, also. Be interesting to have two record years back to back.
SSDD
Gold Member
- Nov 6, 2012
- 16,672
- 1,966
- 280
Every day the hoax becomes more obvious...reality bitch slaps the claims of you wackos at every turn.
The inflated claims of 2014 being the warmest year are based largely on sea surface temperatures, and land masses with very little instrumental coverage. Of particular note is the bit of water just east of Greenland. According to the climate hoaxers the water there is 6C above normal. Let me repeat that....6C above normal.
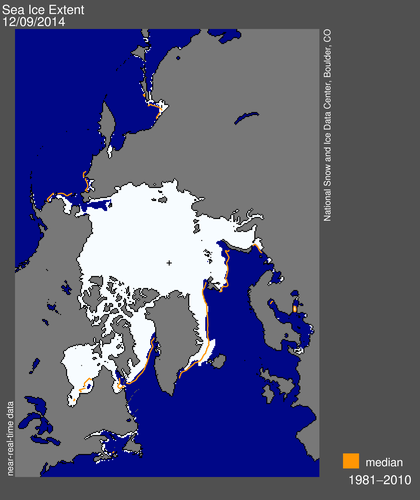
Now look at this satellite image of arctic sea ice. Look at the sea ice in the same area as the data tamperers claim that sea surface temps are 6C above normal... Sea ice above the mean. I guess now warmer water makes more ice. Lets hope that it doesn't get any warmer or shipping may have to come to a halt.
The inflated claims of 2014 being the warmest year are based largely on sea surface temperatures, and land masses with very little instrumental coverage. Of particular note is the bit of water just east of Greenland. According to the climate hoaxers the water there is 6C above normal. Let me repeat that....6C above normal.
Now look at this satellite image of arctic sea ice. Look at the sea ice in the same area as the data tamperers claim that sea surface temps are 6C above normal... Sea ice above the mean. I guess now warmer water makes more ice. Lets hope that it doesn't get any warmer or shipping may have to come to a halt.
Old Rocks
Diamond Member
http://www.ospo.noaa.gov/data/sst/contour/global_small.c.gif
Yes, it is December and the Arctic Ocean is getting cold. But less cold than it has in the past. The result being less ice refreezes, and more melts in the summer, continueing the trend toward an ice free summer in the Arctic.
Yes, it is December and the Arctic Ocean is getting cold. But less cold than it has in the past. The result being less ice refreezes, and more melts in the summer, continueing the trend toward an ice free summer in the Arctic.
SSDD
Gold Member
- Nov 6, 2012
- 16,672
- 1,966
- 280
http://www.ospo.noaa.gov/data/sst/contour/global_small.c.gif
Yes, it is December and the Arctic Ocean is getting cold. But less cold than it has in the past. The result being less ice refreezes, and more melts in the summer, continueing the trend toward an ice free summer in the Arctic.
Guess you didn't notice the red line...that tells you that there is more ice than normal.....idiot.
RollingThunder
Gold Member
- Mar 22, 2010
- 4,818
- 525
- 155
- Thread starter
- #656
More clueless idiocy from the troll SSoooDDuuumb.http://www.ospo.noaa.gov/data/sst/contour/global_small.c.gif
Yes, it is December and the Arctic Ocean is getting cold. But less cold than it has in the past. The result being less ice refreezes, and more melts in the summer, continueing the trend toward an ice free summer in the Arctic.
Guess you didn't notice the red line...that tells you that there is more ice than normal.....idiot.
Sea ice extent in November averaged 630,000 square kilometers (243,000 square miles) below the 1981 to 2010 long-term average. Arctic sea ice extent for November was the 9th lowest in the satellite record (35 years). Through 2014, the linear rate of decline for November extent over the satellite record is 4.7% per decade. (source - NSIDC)
Last edited:
mamooth
Diamond Member
Every day the hoax becomes more obvious...reality bitch slaps the claims of you wackos at every turn.
You're using the unisys maps, which are known to have all kinds of troubles.
Why not go to the NOAA maps?
Oh, that's right. you're a denier. Unaltered data makes you break out in hives.
CrusaderFrank
Diamond Member
- May 20, 2009
- 146,379
- 69,431
- 2,330
How temperatures across the globe ranked from January through October 2014.
Click image to enlarge. Credit: NOAA
Warm Ocean Waters Boosting Typhoons Record Heat Climate Central
Some have cited this widespread ocean warmth as the beginning of the end of the pause, or hiatus, in the rate of planetary warming, with rates of warming demonstrably slower over the past few decades than in the previous ones. The ocean stores much of the heat absorbed by the excess greenhouse gases in the atmosphere, so it could be beginning of that heat being unleashed back into the atmosphere.
For the year through October, the average ocean temperature for the planet was a record high,according to NOAA data. That was a significant factor in the same period being the warmest first 10 months on record, 1.22°F higher than the 20th century average of 57.4°F. If November and December continue on pace, 2014 could best 2010 as the warmest year on record and would mean that 14 of the 15 warmest years all occurred in the 21st century
Looks like 2015 is shaping up to be a very warm year, also. Be interesting to have two record years back to back.
....so, where's the lab work that shows how CO2 does any of this?
RollingThunder
Gold Member
- Mar 22, 2010
- 4,818
- 525
- 155
- Thread starter
- #659
Click image to enlarge. Credit: NOAA
Warm Ocean Waters Boosting Typhoons Record Heat Climate Central
Some have cited this widespread ocean warmth as the beginning of the end of the pause, or hiatus, in the rate of planetary warming, with rates of warming demonstrably slower over the past few decades than in the previous ones. The ocean stores much of the heat absorbed by the excess greenhouse gases in the atmosphere, so it could be beginning of that heat being unleashed back into the atmosphere.
For the year through October, the average ocean temperature for the planet was a record high,according to NOAA data. That was a significant factor in the same period being the warmest first 10 months on record, 1.22°F higher than the 20th century average of 57.4°F. If November and December continue on pace, 2014 could best 2010 as the warmest year on record and would mean that 14 of the 15 warmest years all occurred in the 21st century
Looks like 2015 is shaping up to be a very warm year, also. Be interesting to have two record years back to back.
Here's some of it. A fraction.....so, where's the lab work that shows how CO2 does any of this?
CO2 absorption of infrared (IR), theory:
*Kouzov, A. P., & Chrysos, M. (2009). Collision-induced absorption by CO 2 in the far infrared: Analysis of leading-order moments and interpretation of the experiment. Physical Review A, 80(4), 042703.
*Chrysos, M., Kouzov, A. P., Egorova, N. I., & Rachet, F. (2008 ). Exact Low-Order Classical Moments in Collision-Induced Bands by Linear Rotors: CO 2-CO 2. Physical review letters, 100(13), 133007.
*Buldyreva, J., & Chrysos, M. (2001). Semiclassical modeling of infrared pressure-broadened linewidths: A comparative analysis in CO2–Ar at various temperatures. The Journal of Chemical Physics, 115(16), 7436-7441.
*Kratz, D. P., Gao, B. C., & Kiehl, J. T. (1991). A study of the radiative effects of the 9.4‐and 10.4‐micron bands of carbon dioxide. Journal of Geophysical Research: Atmospheres (1984–2012), 96(D5), 9021-9026.
*Stull, V. R., Wyatt, P. J., & Plass, G. N. (1964). The infrared transmittance of carbon dioxide. Applied Optics, 3(2), 243-254.
CO2 absorption of IR, laboratory measurements:
*R.A. Toth, et al., Spectroscopic database of CO2 line parameters: 4300–7000 cm−1, Journal of Quantitative Spectroscopy and Radiative Transfer, 109:6, April 2008, 906-921.
*Predoi-Cross, A., Unni, A. V., Liu, W., Schofield, I., Holladay, C., McKellar, A. R. W., & Hurtmans, D. (2007). Line shape parameters measurement and computations for self-broadened carbon dioxide transitions in the 30012← 00001 and 30013← 00001 bands, line mixing, and speed dependence. Journal of molecular spectroscopy, 245(1), 34-51.
*Miller, C. E., & Brown, L. R. (2004). Near infrared spectroscopy of carbon dioxide I.[sup] 16[/sup] O[sup] 12[/sup] C[sup] 16[/sup] O line positions. Journal of molecular spectroscopy, 228(2), 329-354.
*Niro, F., Boulet, C., & Hartmann, J. M. (2004). Spectra calculations in central and wing regions of CO[sub] 2[/sub] IR bands between 10 and 20μm. I: model and laboratory measurements. Journal of Quantitative Spectroscopy and Radiative Transfer, 88(4), 483-498.
*Benec'h, S., Rachet, F., Chrysos, M., Buldyreva, J., & Bonamy, L. (2002). On far‐wing Raman profiles by CO2. Journal of Raman Spectroscopy, 33(11‐12), 934-940.
Earth's upward emission of IR:
*Murphy, D. M., Solomon, S., Portmann, R. W., Rosenlof, K. H., Forster, P. M., & Wong, T. (2009). An observationally based energy balance for the Earth since 1950. Journal of Geophysical Research: Atmospheres (1984–2012), 114(D17).
*Trenberth, K. E., Fasullo, J. T., & Kiehl, J. (2009). Earth's global energy budget. Bulletin of the American Meteorological Society, 90(3).
*Wong, T., Wielicki, B. A., Lee III, R. B., Smith, G. L., Bush, K. A., & Willis, J. K. (2006). Reexamination of the observed decadal variability of the earth radiation budget using altitude-corrected ERBE/ERBS nonscanner WFOV data. Journal of Climate, 19(16).
*Harries, J. E. (2000). Physics of the Earth's radiative energy balance. Contemporary Physics, 41(5), 309-322.
*Kyle, H. L., Arking, A., Hickey, J. R., Ardanuy, P. E., Jacobowitz, H., Stowe, L. L., ... & Smith, G. L. (1993). The Nimbus Earth radiation budget (ERB) experiment: 1975 to 1992. Bulletin of the American Meteorological Society, 74(5), 815-830.
*Barkstrom, B. R. (1984). The earth radiation budget experiment (ERBE). Bulletin of the American Meteorological Society, 65(11), 1170-1185.
Changes in Earth's upward IR emission as a result of increased CO2 in the atmosphere:
*Gastineau, G., Soden, B. J., Jackson, D. L., & O'Dell, C. W. (2014). Satellite-Based Reconstruction of the Tropical Oceanic Clear-Sky Outgoing Longwave Radiation and Comparison with Climate Models. Journal of Climate, 27(2).
*Chapman, D., Nguyen, P., & Halem, M. (2013, May). A decade of measured greenhouse forcings from AIRS. In SPIE Defense, Security, and Sensing (pp. 874313-874313). International Society for Optics and Photonics.
*Chen, C., Harries, J., Brindley, H., & Ringer, M. (2007). Spectral signatures of climate change in the Earth's infrared spectrum between 1970 and 2006. Retrieved October, 13, 2009.
*Griggs, J. A., & Harries, J. E. (2007). Comparison of Spectrally Resolved Outgoing Longwave Radiation over the Tropical Pacific between 1970 and 2003 Using IRIS, IMG, and AIRS. Journal of climate, 20(15).
*Griggs, J. A., & Harries, J. E. (2004, November). Comparison of spectrally resolved outgoing longwave data between 1970 and present. In Optical Science and Technology, the SPIE 49th Annual Meeting (pp. 164-174). International Society for Optics and Photonics.
Changes in downwelling infrared from the atmosphere as a result of increased CO2:
*Wang, K., & Liang, S. (2009). Global atmospheric downward longwave radiation over land surface under all‐sky conditions from 1973 to 2008. Journal of Geophysical Research: Atmospheres (1984–2012), 114(D19).
*Wild, M., Grieser, J., & Schär, C. (2008 ). Combined surface solar brightening and increasing greenhouse effect support recent intensification of the global land‐based hydrological cycle. Geophysical Research Letters, 35(17).
*Prata, F. (2008 ). The climatological record of clear‐sky longwave radiation at the Earth's surface: evidence for water vapour feedback?. International Journal of Remote Sensing, 29(17-18 ), 5247-5263.
*Allan, R. P. (2006). Variability in clear‐sky longwave radiative cooling of the atmosphere. Journal of Geophysical Research: Atmospheres (1984–2012), 111(D22).
*Philipona, R., Dürr, B., Marty, C., Ohmura, A., & Wild, M. (2004). Radiative forcing‐measured at Earth's surface‐corroborate the increasing greenhouse effect. Geophysical Research Letters, 31(3).
Formal determination of CO2-temperature causality:
* Attanasio, A., Pasini, A., & Triacca, U. (2013). Granger Causality Analyses for Climatic Attribution. Atmospheric and Climate Sciences, 3, 515.
* Attanasio, A. (2012). Testing for linear Granger causality from natural/anthropogenic forcings to global temperature anomalies. Theoretical and Applied Climatology, 110(1-2), 281-289.
* Attanasio, A., Pasini, A., & Triacca, U. (2012). A contribution to attribution of recent global warming by out‐of‐sample Granger causality analysis. Atmospheric Science Letters, 13(1), 67-72.
* Kodra, E., Chatterjee, S., & Ganguly, A. R. (2011). Exploring Granger causality between global average observed time series of carbon dioxide and temperature. Theoretical and applied climatology, 104(3-4), 325-335.
* Verdes, P. F. (2005). Assessing causality from multivariate time series. PHYSICAL REVIEW-SERIES E-, 72(2), 026222.
I doesn't. They already agreed any measured warming is directly attributable to the sun. CO2 is just something they can tax.
Click image to enlarge. Credit: NOAA
Warm Ocean Waters Boosting Typhoons Record Heat Climate Central
Some have cited this widespread ocean warmth as the beginning of the end of the pause, or hiatus, in the rate of planetary warming, with rates of warming demonstrably slower over the past few decades than in the previous ones. The ocean stores much of the heat absorbed by the excess greenhouse gases in the atmosphere, so it could be beginning of that heat being unleashed back into the atmosphere.
For the year through October, the average ocean temperature for the planet was a record high,according to NOAA data. That was a significant factor in the same period being the warmest first 10 months on record, 1.22°F higher than the 20th century average of 57.4°F. If November and December continue on pace, 2014 could best 2010 as the warmest year on record and would mean that 14 of the 15 warmest years all occurred in the 21st century
Looks like 2015 is shaping up to be a very warm year, also. Be interesting to have two record years back to back.
....so, where's the lab work that shows how CO2 does any of this?
Similar threads
- Replies
- 25
- Views
- 176
- Replies
- 26
- Views
- 326
- Replies
- 9
- Views
- 359
Latest Discussions
- Replies
- 1K
- Views
- 26K
- Replies
- 1K
- Views
- 27K
- Replies
- 23
- Views
- 238
Forum List
-
-
-
-
-
Political Satire 8427
-
-
-
-
-
-
-
-
-
-
-
-
-
-
-
-
-
-
-
ObamaCare 781
-
-
-
-
-
-
-
-
-
-
-
Member Usernotes 478
-
-
-
-
-
-
-
-
-
-