Climate change

Status
Not open for further replies.
Of course if the hairball cat wants a different reading on climate model FORECASTING performance. Doesn't like the Dr Roy Spencer version, let's just submit the IPCC AR5 version...


figure-1-4-models-vs-observations-annotated.png


Sucks kibble don't it???

What was funny, the IPCC added the GREY shaded section, which is outside of all their error bars, so that it would imply that their predictions were still somewhat valid. Deception of the highest magnitude... You will note there is no descriptive ] block. it was simply put their to deceive.

they are stretching the truth

--LOL
 
Put a couple cyclical events together at a random phase and you can start to synthesize any shape temperature curve that you want..

You can, but you shouldn't. Theory comes first, predictions second. Attempts at curve fitting invariably lead to bad science.

And what was the AMOUNT of the backradiation increase measured that you are relying on.. Did it explain ALL of the warming as seen from a GLOBAL number?

Let me check .... I think I gave a bad link before. Try this one.

Global atmospheric downward longwave radiation over land surface under all-sky conditions from 1973 to 2008 - Wang - 2009 - Journal of Geophysical Research Atmospheres - Wiley Online Library
---
We found that daily Ld increased at an average rate of 2.2 W / m^2 per decade from 1973 to 2008.
---

So yes, that puts in line with the radiative forcing of everything, including water vapor feedback.

Was it done in the tropics and the arctic?

The tropics were well covered. The polar regions were not. You work with the very expensive SURFRAD stations that you have.
 
Of course if the hairball cat wants a different reading on climate model FORECASTING performance. Doesn't like the Dr Roy Spencer version, let's just submit the IPCC AR5 version...


figure-1-4-models-vs-observations-annotated.png


Sucks kibble don't it???

What was funny, the IPCC added the GREY shaded section, which is outside of all their error bars, so that it would imply that their predictions were still somewhat valid. Deception of the highest magnitude... You will note there is no descriptive ] block. it was simply put their to deceive.

they are stretching the truth

--LOL

The draft had this one ....
images


You will note that it did not contain the grey areas, which show clearly that their predictions failed inside ten years.
 
On what basis was his paper rejected??

On the basis that it didn't correct the error of the lack of tropical data. Lindzen said it didn't matter. The reviewers disagreed.


Conclusions and discussions
We have corrected the approach of Lindzen and Choi (2009),
based on all the criticisms made of the earlier work (Chung
et
al
., 2010; Murphy, 2010; Trenberth
et al
., 2010). First of all, to
Fig. 11
. Sensitivity vs. feedback factor.
388
ASIA-PACIFIC JOURNAL OF ATMOSPHERIC SCIENCES
improve the statistical significance of the results, we supple-
mented ERBE data with CERES data, filtered out data noise
with 3-month smoothing, objectively chose the intervals based
on the smoothed data, and provided confidence intervals for all
sensitivity estimates. These constraints helped us to more accu-
rately obtain climate feedback factors than with the original use
of monthly data. Next, our new formulas for climate feedback
and sensitivity reflect sharing of tropical feedback with the globe,
so that the tropical region is now properly identified as an open
system. Last, the feedback factors inferred from the atmospheric
models are more consistent with IPCC-defined climate sensi-
tivity than those from the coupled models. This is because, in the
presence of cloud-induced radiative changes altering SST, the
climate feedback estimates by the present approach tends to be
inaccurate. With all corrections, the conclusion still appears to be
that all current models seem to exaggerate climate sensitivity
(some greatly). Moreover, we have shown why studies using
simple regressions of

Flux on

SST serve poorly to determine
feedbacks.
To respond to the criticism of our emphasis on the tropical
domain (Murphy, 2010; Trenberth
et al.
, 2010), we analyzed the
complete record of CERES for the globe (Dessler, 2010) (Note
that ERBE data is not available for the high latitudes since the
field-of-view is between 60
o
S and 60
o
N). As seen in the
previous section, the use of the global CERES record leads to a
result that is basically similar to that from the tropical data in this
study. The global CERES record, however, contains more noise
than the tropical record.
This result lends support to the argument that the water vapor
feedback is primarily restricted to the tropics, and there are
reasons to suppose that this is also the case for cloud feedbacks.
Although, in principle, climate feedbacks may arise from any
latitude, there are substantive reasons for supposing that they are,
indeed, concentrated mostly in the tropics. The most prominent
model feedback is that due to water vapor, where it is commonly
noted that models behave roughly as though relative humidity
were fixed. Pierrehumbert (2009) examined outgoing radiation
as a function of surface temperature theoretically for atmo-
spheres with constant relative humidity. His results are shown in
Fig. 13.
Specific humidity is low in the extratropics, while it is high in
the tropics. We see that for extratropical conditions, outgoing
radiation closely approximates the Planck black body radiation
(leading to small feedback). However, for tropical conditions,
increases in outgoing radiation are suppressed, implying substan-
tial positive feedback. There are also reasons to suppose that
cloud feedbacks are largely confined to the tropics. In the
extratropics, clouds are mostly stratiform clouds that are asso-
ciated with ascending air while descending regions are cloud-
free. Ascent and descent are largely determined by the large scale
wave motions that dominate the meteorology of the extratropics,
and for these waves, we expect approximately 50% cloud cover
regardless of temperature (though details may depend on tem-
perature). On the other hand, in the tropics, upper level clouds, at
least, are mostly determined by detrainment from cumulonimbus
towers, and cloud coverage is observed to depend significantly
on temperature (Rondanelli and Lindzen, 2008).
As noted by LCH01, with feedbacks restricted to the tropics,
their contribution to global sensitivity results from sharing the
feedback fluxes with the extratropics. This led to inclusion of the
sharing factor
c
in Eq. (6). The choice of a larger factor
c
leads to
a smaller contribution of tropical feedback to global sensitivity,
but the effect on the climate sensitivity estimated from the
observation is minor. For example, with
c
= 3, climate sensitivity
from the observation and the models is 0.8 K and a higher value
(between 1.3 K and 6.4 K), respectively. With
c
= 1.5, global
equilibrium sensitivity from the observation and the models is
0.6 K and any value higher than 1.6 K, respectively. Note that,
as in LCH01, we are not discounting the possibility of feedbacks
in the extratropics, but rather we are focusing on the tropical
contribution to global feedbacks. Note that, when the dynamical
heat transports toward the extratropics are taken into account,
the overestimation of tropical feedback by GCMs may lead to
even greater overestimation of climate sensitivity (Bates, 2011).
Fig. 12.
Same as Fig. 4, but for the 10 CMIP models (black dots);
GISS model was excluded because only few intervals of SST are
obtained. The values for the 3-month smoothing in Fig. 4 are
superimposed by red dots.
Fig. 13
. OLR vs. surface temperature for water vapor in air, wit
h
relative humidity held fixed. The surface air pressure is 1 bar. The
temperature profile in the model is the water/air moist adiabat.
Calculations were carried out with the Community Climate Model
radiation code (Pierrehumbert, 2009).
31 August 2011
Richard S. Lindzen and Yong-Sang Choi
389
This emphasizes the importance of the tropical domain itself.
Our analysis of the data only demands relative instrumental
stability over short periods, and is largely independent of long
term drift. Concerning the different sampling from the ERBE
and CERES instruments, Murphy
et al
. (2009) repeated the
Forster and Gregory (2006) analysis for the CERES and found
very different values than those from the ERBE. However, in this
study, the addition of CERES data to the ERBE data does little to
change the results for

Flux/

SST - except that its value is raised
a little (as is also true when only CERES data is used.). This may
be because these previous simple regression approaches include
the distortion of feedback processes by equilibration. In distin-
guishing a precise feedback from the data, the simple regression
method is dependent on the data period, while our method is
not. The simple regression result in Fig. 7 is worse if the model
integration time is longer (probably due to the greater impact of
increasing radiative forcing).
Our study also suggests that, in current coupled atmosphere-
ocean models, the atmosphere and ocean are too weakly coupled
since thermal coupling is inversely proportional to sensitivity
(Lindzen and Giannitsis, 1998). It has been noted by Newman
et
al
. (2009) that coupling is crucial to the simulation of phenom-
ena like El Niño. Thus, corrections of the sensitivity of current
climate models might well improve the behavior of coupled
models, and should be encouraged. It should be noted that there
have been independent tests that also suggest sensitivities less
than predicted by current models. These tests are based on the
response to sequences of volcanic eruptions (Lindzen and
Giannitsis, 1998), on the vertical structure of observed versus
modeled temperature increase (Douglass, 2007; Lindzen, 2007),
on ocean heating (Schwartz, 2007; Schwartz, 2008), and on
satellite observations (Spencer and Braswell, 2010). Most claims
of greater sensitivity are based on the models that we have just
shown can be highly misleading on this matter. There have also
been attempts to infer sensitivity from paleoclimate data (Hansen
et al
., 1993), but these are not really tests since the forcing is
essentially unknown given major uncertainties in clouds, dust
loading and other factors. Finally, we have shown that the
attempts to obtain feedbacks from simple regressions of satellite
measured outgoing radiation on SST are inappropriate.
One final point needs to be made. Low sensitivity of global
mean temperature anomaly to global scale forcing does not
imply that major climate change cannot occur. The earth has, of
course, experienced major cool periods such as those associated
with ice ages and warm periods such as the Eocene (Crowley
and North, 1991). As noted, however, in Lindzen (1993), these
episodes were primarily associated with changes in the equator-
to-pole temperature difference and spatially heterogeneous forcing.
Changes in global mean temperature were simply the residue of
such changes and not the cause.
Acknowledgements.
This research was supported by DOE
grant DE-FG02-01ER63257, the National Research Foundation
of Korea (NRF) grant (No. 20090093464), National Institute of
Environmental Research of Korea (NIER) grant (No. 1600-1637-
303-210-13), and the Ewha Womans University Research Grant
(No. 2011-0220-1-1). The authors thank NASA Langley Re-
search Center and the PCMDI team for the data, and Hee-Je
Cho, Hyonho Chun, Richard Garwin, William Happer, Lubos
Motl, Roy Spencer, Jens Vogelgesang, and Tak-meng Wong for
helpful suggestions. We also wish to thank Daniel Kirk-
Davidoff for a helpful question.
REFERENC

From his paper.

This emphasizes the importance of the tropical domain itself.

You sure about ignoring the tropics??? Seems that he gives it plenty of attention. lol

Greg
 
Stratospheric observations cannot discriminate between atmospheric thickening from CO2 back radiation or natural warming.

Ah, the mysterious "natural warming" again. It just spontaneously happens, without a cause. And if you can't absolutely prove such magic doesn't happen, you have to admit AGW theory is wrong. Or so the denier 'science' goes.

And it's impossible to get direct GLOBAL readings of backradiation to derive that increase.

Well, yes, because clouds and water vapor change the backradiation amounts, and have to be corrected for. And because the whole planet isn't covered by SURFRAD station monitoring.

That is CALCULATED from the observed warming you nit and ASSUMED to be all due to CO2....

Well, the cloud and water vapor the corrections are calculated from satellite data.

Global atmospheric downward longwave radiation over land surface under all-sky conditions from 1973 to 2008 - Wang - 2009 - Journal of Geophysical Research Atmospheres - Wiley Online Library

After showing their 36 individual site measurements agreed with the model, they used the model for the whole earth. But even if you don't like that model, you're still left with the issue that backradiation was increasing at the 36 individual sites, and none of the "natural cycles" theories have an explanation for that.

Why Back-Radiation is not a Source of Surface Heating the Air Vent

Probably worth the intellectual curiosity but so??

Please explain the cooler 40's. I've seen it said that it was because of the A-Bomb. lmao.

Greg


The MAIN point of the article IS CORRECT. And although that paragraph struggled to say it -- that backradiation from the GreenHouse does NOT heat the surface. It merely retards the rate of loss of heat (thus the insulation or blanket analogies). The heating of the surface actually comes from using the same furnace with the same BTU ratings (the sun) to heat a better insulated home..

It's a semantical thing. There are true deniers of the GreenHouse who just claim it violates Physics, and then there's folks who TRY to explain it and get in trouble for saying that the GreenHouse "heats" the surface.. Not truly a heat source. But it RETARDS loss and therefore raises the interior to a higher temperature equilibrium..
 
The "cooler 40s" Glenn --- comes from the hockey stick theorem. If you average the hell out of long historical record of anything and then tack on the UNFILTERED recent instrumentation record to the right end of the chart -- you can make ANYTHING look scary and unpredictable..

:eek-52: :cool-45: :eek-52:
 
Here's the actual AR5 graph. A few deniers, for inexplicable reasons, ignore the real graph and use an early draft that everyone agrees was erroneous. Naturally, those deniers also claim that fixing the bad graph proved a conspiracy. That's why everyone ignores them.

So, the projections are very good, especially if you extend temps to 2014. Temps run right down the middle of the models. Also note how the projections go out to 2035.

ProjvsObs450.jpg
 
Of course if the hairball cat wants a different reading on climate model FORECASTING performance. Doesn't like the Dr Roy Spencer version, let's just submit the IPCC AR5 version...


figure-1-4-models-vs-observations-annotated.png


Sucks kibble don't it???

What was funny, the IPCC added the GREY shaded section, which is outside of all their error bars, so that it would imply that their predictions were still somewhat valid. Deception of the highest magnitude... You will note there is no descriptive ] block. it was simply put their to deceive.

they are stretching the truth

--LOL

The draft had this one ....
images


You will note that it did not contain the grey areas, which show clearly that their predictions failed inside ten years.

You are right.. That's now Exhibit 112 in the IPCC fraud folder..:deal: :deal: :deal:


I had seen that EARLIER draft on Dr. Curry's site.
 
Of course if the hairball cat wants a different reading on climate model FORECASTING performance. Doesn't like the Dr Roy Spencer version, let's just submit the IPCC AR5 version...


figure-1-4-models-vs-observations-annotated.png


Sucks kibble don't it???

What was funny, the IPCC added the GREY shaded section, which is outside of all their error bars, so that it would imply that their predictions were still somewhat valid. Deception of the highest magnitude... You will note there is no descriptive ] block. it was simply put their to deceive.

they are stretching the truth

--LOL

The draft had this one ....
images


You will note that it did not contain the grey areas, which show clearly that their predictions failed inside ten years.

indeed
 
Here's the actual AR5 graph. A few deniers, for inexplicable reasons, ignore the real graph and use an early draft that everyone agrees was erroneous. Naturally, those deniers also claim that fixing the bad graph proved a conspiracy. That's why everyone ignores them.

So, the projections are very good, especially if you extend temps to 2014. Temps run right down the middle of the models. Also note how the projections go out to 2035.

ProjvsObs450.jpg

Yeah quite familiar with that version as well. That was Exhibit #109 in the IPCC fraud folder.

If you have bad news about the last 20 years -- bury it in a graph that 4 times times TOO WIDE and fill it with really really irrelevant information points.. Makes your BOO BOO look 4 times smaller.. What a dupe....

There's a book called "lying with statistics" and should be one for "lying with charts"..
 
Of course if the hairball cat wants a different reading on climate model FORECASTING performance. Doesn't like the Dr Roy Spencer version, let's just submit the IPCC AR5 version...


figure-1-4-models-vs-observations-annotated.png


Sucks kibble don't it???

What was funny, the IPCC added the GREY shaded section, which is outside of all their error bars, so that it would imply that their predictions were still somewhat valid. Deception of the highest magnitude... You will note there is no descriptive ] block. it was simply put their to deceive.

they are stretching the truth

--LOL

The draft had this one ....
images


You will note that it did not contain the grey areas, which show clearly that their predictions failed inside ten years.

You are right.. That's now Exhibit 112 in the IPCC fraud folder..:deal: :deal: :deal:


I had seen that EARLIER draft on Dr. Curry's site.


Speaking of FRAUD!!!

1998changesannotated.gif


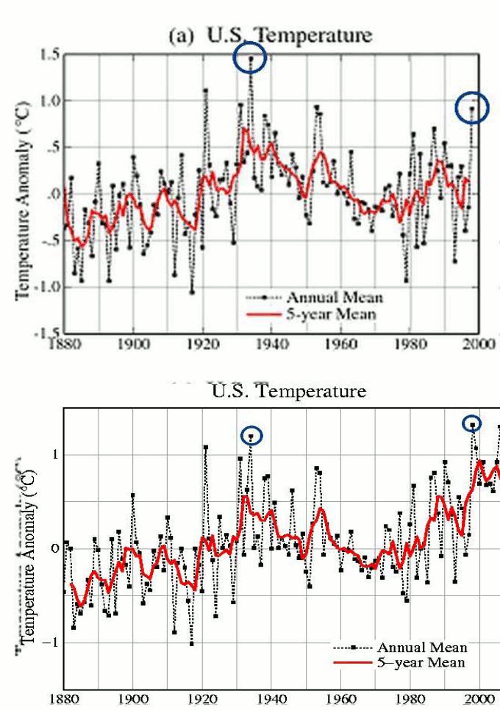
Adjustments are really cool if you want to cover one's tampering.

Greg
 
Credit CO2 Insanity web site:

Back Radiation Co2 Insanity

excerpt:
"Doomsaying Climatologist Abandons ‘Back Radiation’ Meme

Only recently did Professor Claes Johnson persuade long-time greenhouse gas effect believer Dr. Judith Curry to abandon this unscientific term. Curry now admits:

“Back radiation is a phrase, one that I don’t use myself, and it is not a word that is used in technical radiative transfer studies. Lets lose the back radiation terminology, we all agree on that.”"

Fine, call it radiation. It's still radiation moving from the cooler atmosphere toward the warmer surface.
and adding no heat to surface or troposphere temperatures.

All matter above 0K radiates all the time, in all directions.
Even if it's radiating toward warmer matter.

Are we clear on the basics yet?
yep agree, however, the radiation toward the surface does not heat jack.

So are we clear yet that radiation from the cool atmosphere can hit the warmer ground?
Naw, it doesn't make it to the ground
 
Last edited:
Fine, call it radiation. It's still radiation moving from the cooler atmosphere toward the warmer surface.
and adding no heat to surface or troposphere temperatures.

All matter above 0K radiates all the time, in all directions.
Even if it's radiating toward warmer matter.

Are we clear on the basics yet?
yep agree, however, the radiation toward the surface does not heat jack.

So are we clear yet that radiation from the cool atmosphere can hit the warmer ground?
Naw, it doesn't make it to me ground

Where does it stop? Why?
Good question, tell me.
 
Credit CO2 Insanity web site:

Back Radiation Co2 Insanity

excerpt:
"Doomsaying Climatologist Abandons ‘Back Radiation’ Meme

Only recently did Professor Claes Johnson persuade long-time greenhouse gas effect believer Dr. Judith Curry to abandon this unscientific term. Curry now admits:

“Back radiation is a phrase, one that I don’t use myself, and it is not a word that is used in technical radiative transfer studies. Lets lose the back radiation terminology, we all agree on that.”"

Fine, call it radiation. It's still radiation moving from the cooler atmosphere toward the warmer surface.
and adding no heat to surface or troposphere temperatures.

All matter above 0K radiates all the time, in all directions.
Even if it's radiating toward warmer matter.

Are we clear on the basics yet?
yep agree, however, the radiation toward the surface does not heat jack.

So are we clear yet that radiation from the cool atmosphere can hit the warmer ground?

Todd,

You do realize that radiation in this case refers to heat being given off.

A cooler temperature is indicative of a lower level of heat or energy.

So a cooler surface cannot radiate heat to a warmer surface but actually absorbs heat radiated from warmer surfaces.

So once again how does that work??
 
Status
Not open for further replies.

Forum List

Back
Top