Billo_Really
Litre of the Band
- Aug 14, 2005
- 43,659
- 8,243
Just because I'm giving you answers you don't care for, does not mean I'm not participating.I’m pointing at your inability to participate
Follow along with the video below to see how to install our site as a web app on your home screen.
Note: This feature may not be available in some browsers.
Just because I'm giving you answers you don't care for, does not mean I'm not participating.I’m pointing at your inability to participate
You're like a fish struggling in a net.Yeah buddy!
Only you think you’re actually answering!Just because I'm giving you answers you don't care for, does not mean I'm not participating.
And you are like the kid who has to wear hockey equipment, but you are not on a team!Your like a fish struggling in a net.
If you don't like my answers, ask better questions.Only you think you’re actually answering!
Aren’t any better than post the data. The fact you haven’t isn’t an answer. Ask anyone else in hereIf you don't like my answers, ask better questions.
You are one fucking pwned troll.Aren’t any better than post the data. The fact you haven’t isn’t an answer. Ask anyone else in here
Any day cultman post empirical data from the 99%You are one fucking pwned troll.
OkayAny day cultman post empirical data from the 99%
 www.theclimateadaptationcenter.org
So where are the 99% that agree with those?Okay
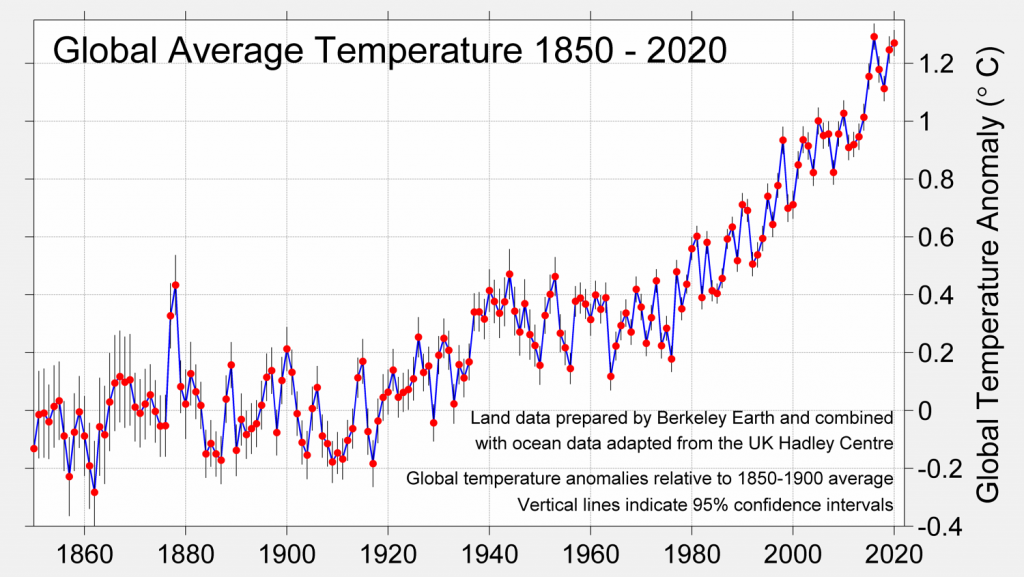
2020 Ties for Global Temperature Record - Climate Adaptation Center
Data shows that 2020 ties for the global temperature record. The global average is about 1.3C higher than pre-industrial levels, close to the Paris Agreement goal of 1.5C
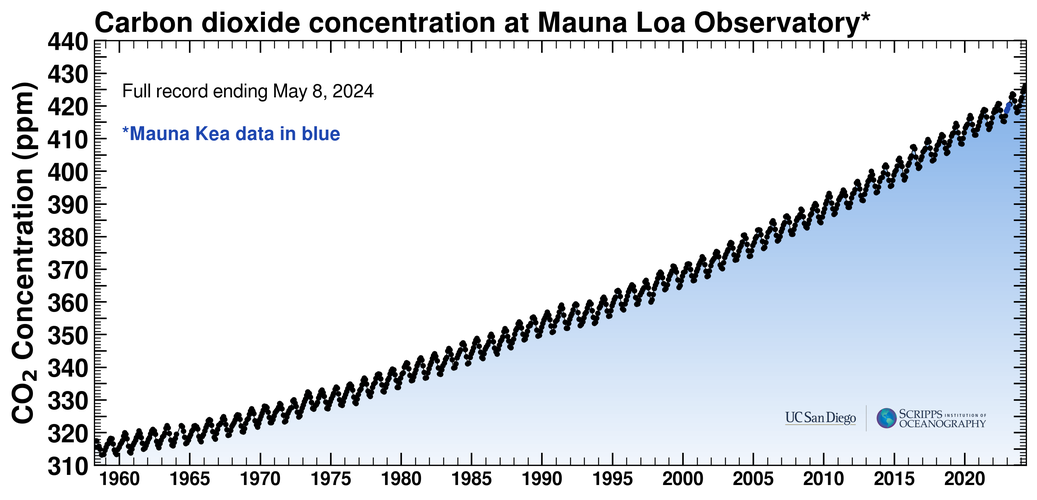
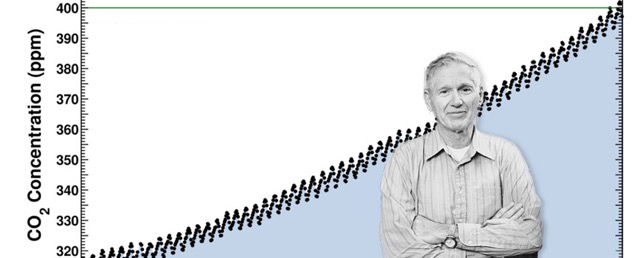
The Keeling Curve
The Keeling Curve is a daily record of global atmospheric carbon dioxide concentration maintained by Scripps Institution of Oceanography at UC San Diego.keelingcurve.ucsd.edu
Everyone else but you I guess.So where are the 99% that agree with those?
Hockey is for fags.And you are like the kid who has to wear hockey equipment, but you are not on a team!
Correlation does not prove causation. The geologic record is littered with warming and cooling trends that were not caused by CO2 or orbital forcing. If your claim were true the planet wouldn't be 2C cooler with 120 ppm more atmospheric CO2 than the previous interglacial period and the planet wouldn't have cooled with atmospheric CO2 greater than 600 ppm.Okay
2020 Ties for Global Temperature Record - Climate Adaptation Center
Data shows that 2020 ties for the global temperature record. The global average is about 1.3C higher than pre-industrial levels, close to the Paris Agreement goal of 1.5C
The Keeling Curve
The Keeling Curve is a daily record of global atmospheric carbon dioxide concentration maintained by Scripps Institution of Oceanography at UC San Diego.
pwned? How old are you?You are one fucking pwned troll.
69pwned? How old are you?
Well then you need to tell me why CO2 has gone up and down in the holocoen to the points we are at today. You claim that this is unusual, but the paleo records proves that it is not. Can you fail any more epically?Okay
2020 Ties for Global Temperature Record - Climate Adaptation Center
Data shows that 2020 ties for the global temperature record. The global average is about 1.3C higher than pre-industrial levels, close to the Paris Agreement goal of 1.5C
The Keeling Curve
The Keeling Curve is a daily record of global atmospheric carbon dioxide concentration maintained by Scripps Institution of Oceanography at UC San Diego.

What I "claimed" was that those were the empirical data for which jc456 asked.Well then you need to tell me why CO2 has gone up and down in the holocoen to the points we are at today. You claim that this is unusual, but the paleo records proves that it is not. Can you fail any more epically?
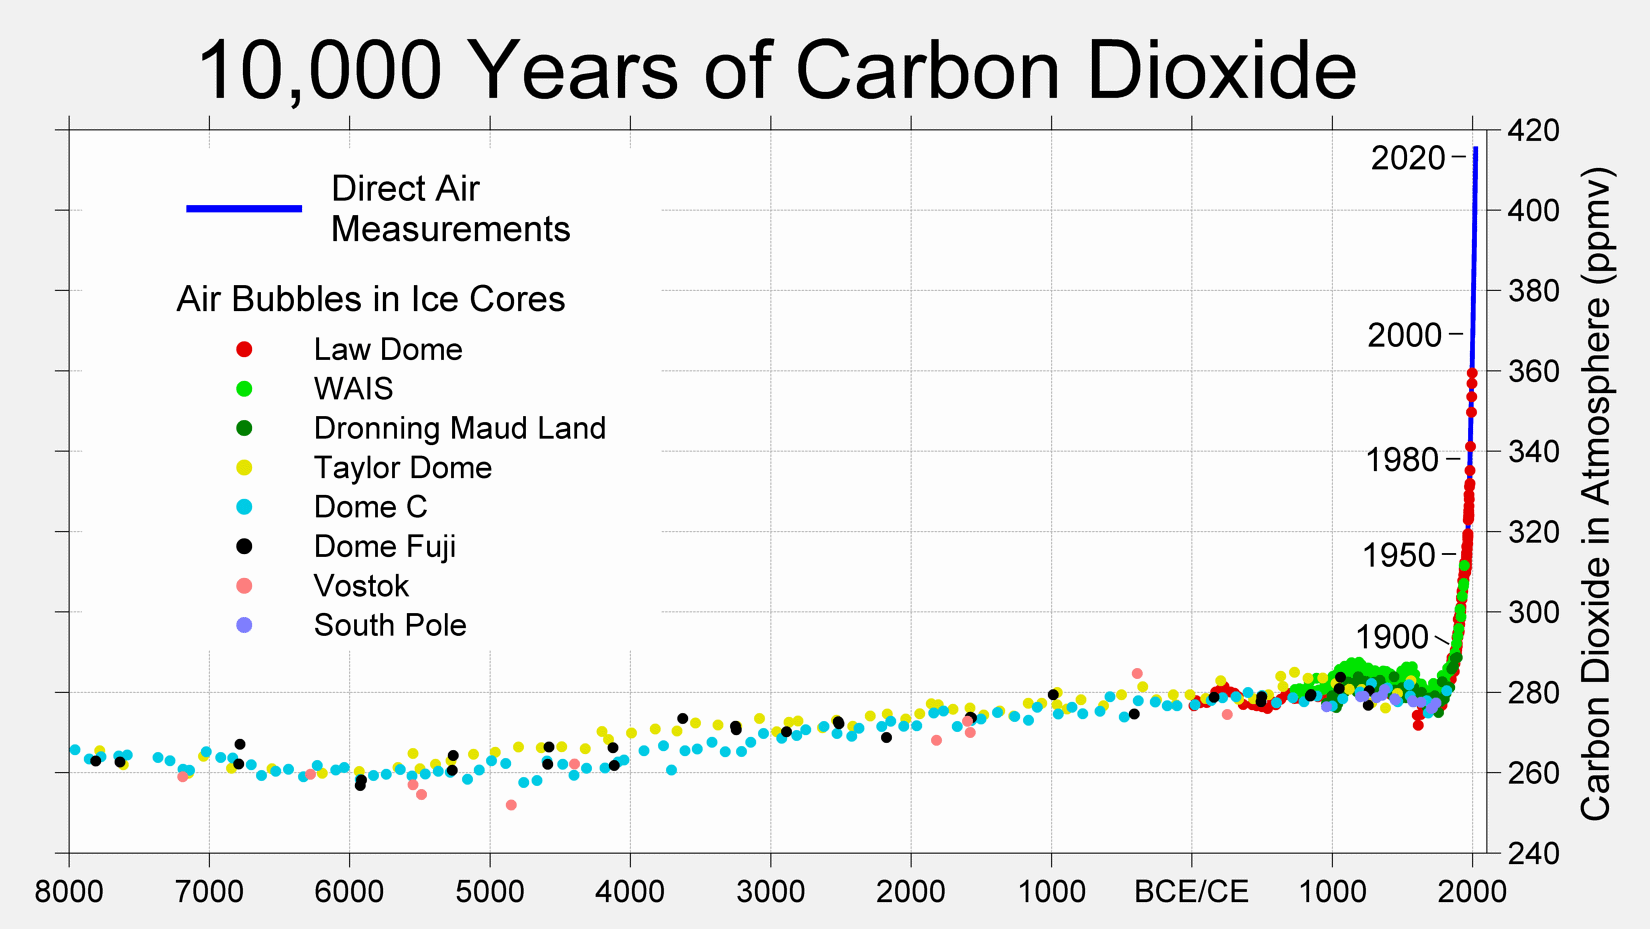
View attachment 751042
Explain this away Crick... Just try...
Well then you need to tell me why CO2 has gone up and down in the holocoen to the points we are at today. You claim that this is unusual, but the paleo records proves that it is not. Can you fail any more epically?
View attachment 751042
Explain this away Crick... Just try...

 berkeleyearth.org


Thus proving that temperature does not correlate to CO2.What I "claimed" was that those were the empirical data for which jc456 asked.
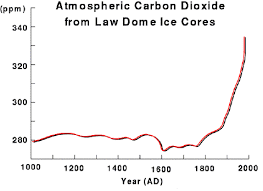
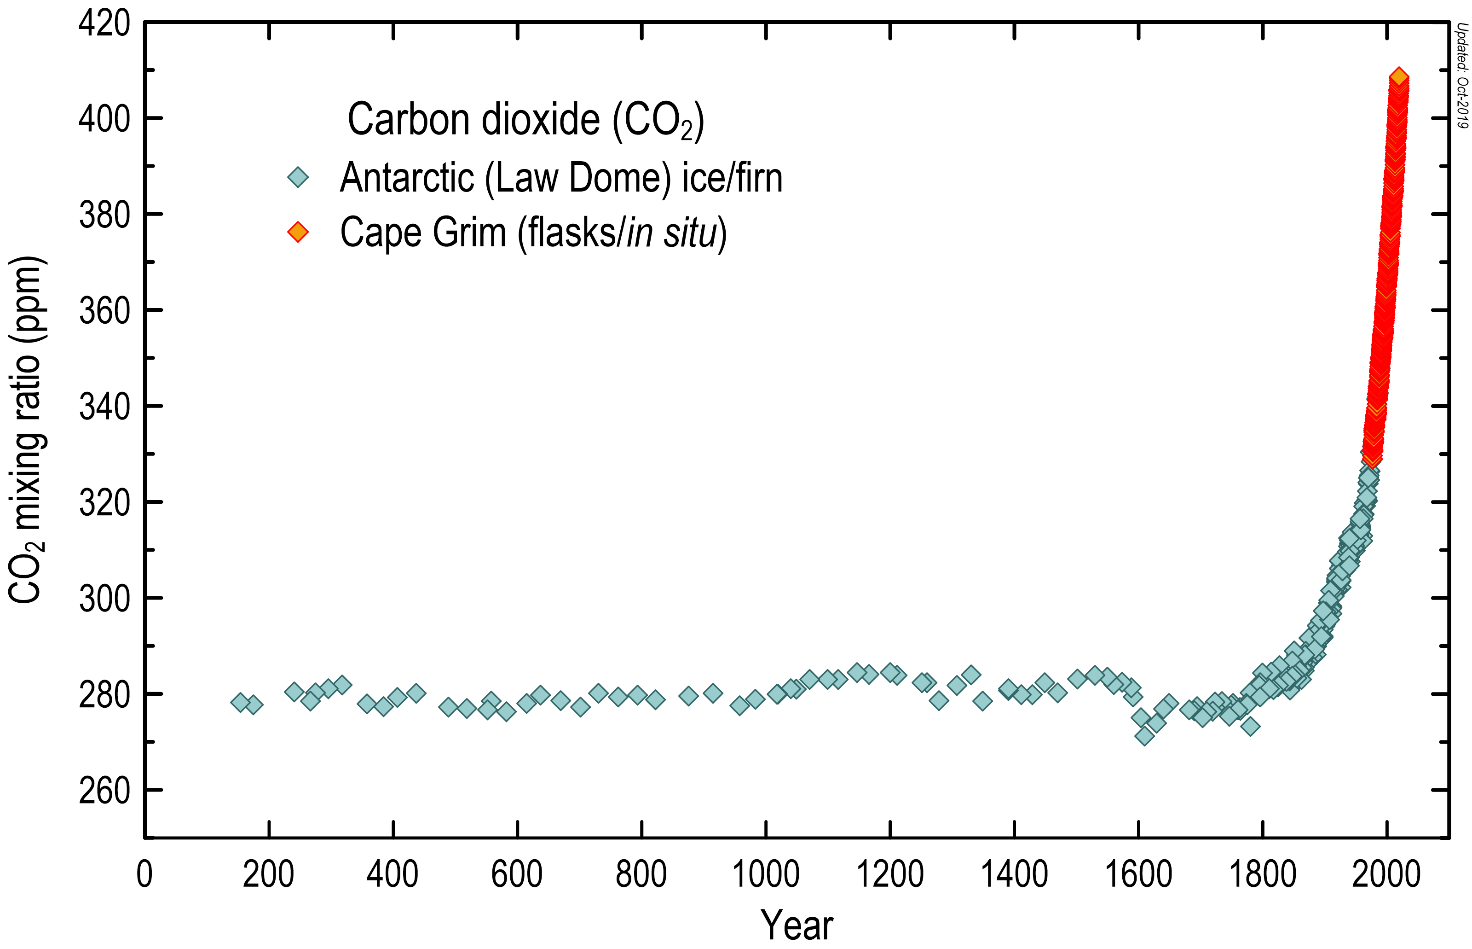
As for CO2, your graph above is a cherry-picked whoopee graph. Note the span of both axes and then compare that to the data below.
Your high range data is the last fifth of the Holocene or so. And I just don't believe it. For starters, where's your link?
Next, why does it look so dramatically different than all these other plots, several of which purport to show the same data.
10,000 Years of Carbon Dioxide - Berkeley Earth
A graph reflecting atmospheric carbon dioxide concentrations over the last 10,000 years.

CO2 is trending: See the latest atmospheric concentrations data on Twitter
CO2 concentrations are trending up. We're tweeting our latest CO2 data from the Cape Grim Baseline monitoring station in Tasmania.blog.csiro.au
I'll leave the explaining this away - as to why your no-source-provided-data look so unlike these other plots of the same Law Dome CO2 data - to YOU.

")