CO2 Has Almost No Effect on Global Temperature, Says Leading Climate Scientist

Crick posed this chart that destroys his own claims, but he suffers from ocular delusions in reading charts every day.

image357_lg.gif


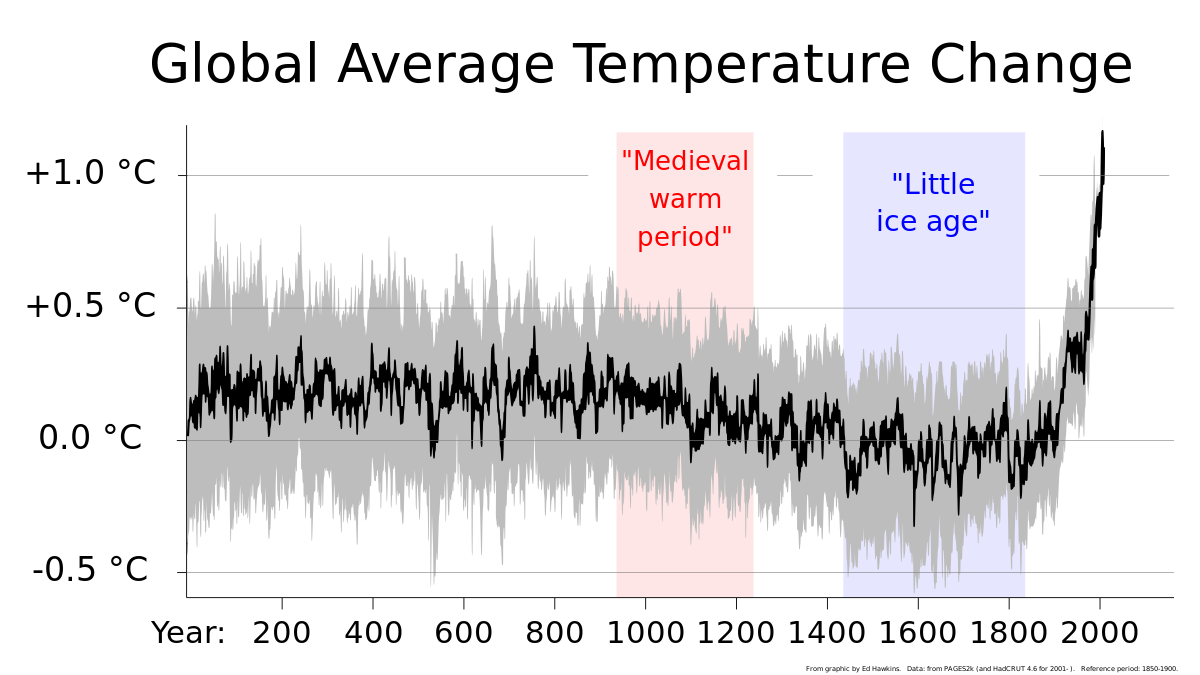
for 11,000 years CO2 stayed in a tight range of just 20 ppm between 260-280 ppm yet the temperature change was large around 2-3C range while CO2 just mostly sat there even when it was about 260 ppm for 6,000 years temperature changed greatly during that time up to 3C change.

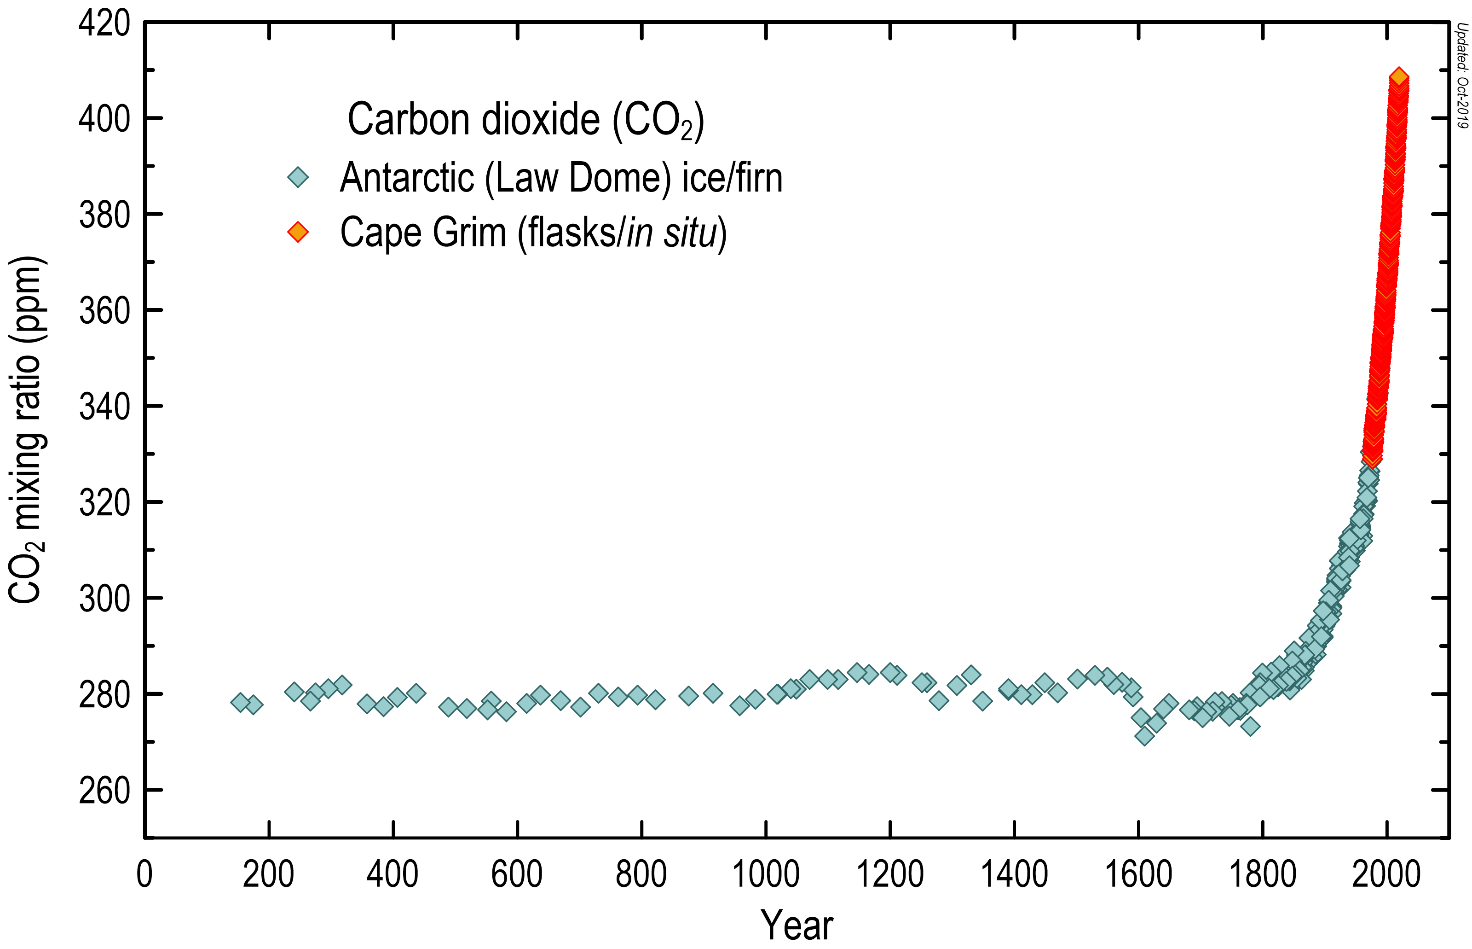
and this one too showing little CO2 change for a neat 1,800 years,

Cape-Grim-PPM-since-AD-0.png


Those are SOUTH Polar ice core readings now we can add the more accurate GISP2 ice core data of Greenland showing similar temperature swings while CO2 barely changed at all for 10,000 years:

6a010536b58035970c0120a75431d3970b-pi


LINK

Similar 2-3.5C temperature swings while CO2 barely change at all.

Then we have this series of GISP2 charts from 14 years ago that utterly destroys the stupid Hockey Stick mania from CO2 sniffing worshippers.

Historical video perspective: our current "unprecedented" global warming in the context of scale​


LINK

===

LOL, it is obvious that CO2 doesn't drive temperature swings, but Crick suffers from severe ocular delusions to accept the evidence while most of us are rational can see the obvious.

Warmist/alarmists do NOT know they have been refuted for years because they have been steeped in delusional climate crisis propaganda swallowing the deepest bullshit gladly.

While rational beings know there is NO climate crisis at all, and this article drives it home with abundant evidence there is nothing unusual going on.

Where is the Climate Emergency?

LINK

Warmist/alarmists over several forums I posted this flypaper gem in gained around 750 replies but NONE of them based on the CONTENT of the article because they are TERRIFIED of it thus never address any of it.

:laugh:

Wake up Crick you have been beaten yet again, why don't you go back to fishing or traveling where you can be happy again and free of delusions.

:)


Read the article at this link

 
Read the article at this link

Zeke is an activist. He always has been. He is purporting his OPINON as fact. This is like asking the fox to take care of your chicks... This is NOT a fact check. This is propaganda. Did you even read this man's links? Probably not....

Zeke uses the discredited Berkley Earth data set as proof. You can't make this stuff up...
 
Last edited:
Zeke is an activist. He always has been. He is purporting his OPINON as fact. This is like asking the fox to take care of your chicks... This is NOT a fact check. This is propaganda. Did you even read this man's links? Probably not....
I have used Hausfather as a source on several occasions. His CV looks a hell of a lot better than yours. I'd say he's probably one of the most qualified scientists you could find to answer this exact question

Zeke Hausfather​

Understanding and Reconciling Global Temperature Records (PhD ’19) Zeke is an energy systems analyst and data scientist with a strong interest in climate science and policy. He is currently the VP of Energy Science at Essess, Inc, an energy efficiency startup that develops vehicle mounted thermal imaging systems, a research scientist at Berkeley Earth, and the senior climate analyst at Project Drawdown. He was previously the chief scientist at C3 Energy and the cofounder and chief scientist of Efficiency 2.0, a behavior-based energy efficiency company. At ERG he plans to focus on better modeling climate impacts of energy system choices and improving observational estimates of global surface temperatures. Publications
 
As I said before, I don't know how to do this on my android phone. Write this down for future reference, because I'm tired of answering this dumbass question as well!
Well again, that’s not an answer! Get back when you get to a laptop or tower! K?

BTW, that’s called a cop out
 
Last edited:
Since you didn't quote anything and no counterpoints to rest of my post you have nothing here for me.

Try again.
The linked article clearly explains why the 1997 GISP2 ice core data is shite. I can understand that you wouldn't want to look at it.
 
The linked article clearly explains why the 1997 GISP2 ice core data is shite. I can understand that you wouldn't want to look at it.
Your own link shows warmer temperatures in the past than recent decades. So the point does not change. The global temperature reconstructions that you post are bullshit.

crick is a dumb ass.JPG
 
The linked article clearly explains why the 1997 GISP2 ice core data is shite. I can understand that you wouldn't want to look at it.

Since you didn't quote anything and no counterpoints to rest of my post you have nothing here for me.

Try again.
 
Since you didn't quote anything and no counterpoints to rest of my post you have nothing here for me.

Try again.
So, you want some quotes? Here you go:

"A misleading graph purporting to show that past changes in Greenland’s temperatures dwarf modern climate change has been circling the internet since at least 2010."

"Based on an early Greenland ice core record produced back in 1997, versions of the graph have, variously, mislabeled the x-axis, excluded the modern observational temperature record and conflated a single location in Greenland with the whole world."

"More recently, researchers have drilled numerous additional ice cores throughout Greenland and produced an updated estimate past Greenland temperatures. This modern temperature reconstruction, combined with observational records over the past century, shows that current temperatures in Greenland are warmer than any period in the past 2,000 years. That said, they are likely still cooler than during the early part of the current geological epoch – the Holocene – which started around 11,000 years ago."

"Since scientists cannot directly measure temperatures from ice cores, they have to rely on measuring the oxygen isotope – 18O – which is correlated with temperature, but imperfectly so."

"Odyssey of errors​

A temperature reconstruction using the Greenland Ice Sheet Project 2 (“GISP2”) ice core was first published by Prof Kurt Cuffey and Dr Gary Clow in a 1997 paper published in the Journal of Geophysical Research: Oceans. Prof Richard Alley of Penn State University also used the record in a 2000 paper. Neither of these papers provided a comparison of GISP2 record with current conditions, as the uncertainties in the ice core proxy reconstruction were too large and the proxy record only extended back to 1855.

The GISP2 ice core record was used in a number of papers in the late 1990s and 2000s that examined changes over the last ice age and the start of the current warm era – the Holocene – around 11,000 years ago. Around 2009, it caught the attention of Dr J Storrs Hall of the Foresight Institute, a technology-focused nonprofit group, who wrote a blog post suggesting that it disproved the idea that “human-emitted CO2 is the only thing that could account for the recent warming trend”.

That post was republished on a climate sceptic blog called Watts Up With That, which followed up with its own version of a GISP2 graph in late 2010 by Dr Don Easterbrook, an emeritus professor of geology at the Western Washington University. Easterbrook’s graph, shown below, was shared widely across the internet by climate sceptics and is still frequently seen – with many small variations – to this day in discussions on Twitter, blogs and news article comment threads."

"This graph is misleading for a number of reasons.

First, the x-axis is mislabelled. In fact, it should say “Years before 1950”, rather than “Years before present (2000 AD)”. The GISP2 ice core only extends up to 1855 – 95 years before 1950. This means that none of the modern observational temperature period overlaps with the proxy reconstruction. (Easterbrook’s graph shows the uptick in the final 100 years or so of the record – shown in red – incorrectly indicating that it is the observational temperature period.)

The figure was also featured in another post on the same blog, which conflated Greenland with global temperatures. Any individual location will have significantly more variability than the globe as a whole. A single ice core is also subject to uncertainties around elevation changes and other perturbations to the ice core over time.

As Prof Alley told then-New York Times journalist Andrew Revkin back in 2010:

“The data still contain a lot of noise over short times (snowdrifts are real, among other things). An isotopic record from one site is not purely a temperature record at that site, so care is required to interpret the signal and not the noise.”

The GISP2 reconstruction is fairly old and more recent research has questioned the assumptions made in changing the relationship between temperature and 18O during the Holocene and how to best account for elevation change of the ice sheet at the GISP2 site. The GISP2 reconstruction changes the relationship between 18O and temperatures by a factor of two during the Holocene, while more recent reconstructions keep it constant. Similarly, elevation change influences 18O records. The old GISP2 reconstruction did not take elevation changes into account.

Scientists reconstructing past Greenland temperatures now use estimates from many different ice cores, which reduces the uncertainties associated with any single one and gives a more accurate picture of changes over Greenland as a whole."

Alley made this point explicitly, telling Revkin:

“So, what do we get from GISP2? Alone, not an immense amount. With the other Greenland ice cores… and compared to additional records from elsewhere, an immense amount… Using GISP2 data to argue against global warming is, well, stupid, or misguided, or misled, or something, but surely not scientifically sensible.”


Enough? There's more. Read the fucking article.
crick is a dumb ass.JPG

:laugh:
 
But this ISN'T the data you've been pushing for the last few weeks, is it.
It shows the same thing. It shows present day modern temperatures aren't hotter than earlier interglacial period temperatures. And it shows how ridiculous it is to establish a cooler temperature as the reference temperature. Clearly the planet is still within the NORMAL range of the present interglacial period with significantly more atmospheric CO2. And it's BELOW NORMAL for previous interglacial periods. If you can't figure out why this is relevant let me know.
 
It shows the same thing. It shows present day modern temperatures aren't hotter than earlier interglacial period temperatures. And it shows how ridiculous it is to establish a cooler temperature as the reference temperature. Clearly the planet is still within the NORMAL range of the present interglacial period with significantly more atmospheric CO2. And it's BELOW NORMAL for previous interglacial periods. If you can't figure out why this is relevant let me know.
It does NOT show the same thing. That 1997 GISP2 plot is complete shite, even as local data and you repeatedly claimed it was the best possible global data available.
 
It shows the same thing. It shows present day modern temperatures aren't hotter than earlier interglacial period temperatures. And it shows how ridiculous it is to establish a cooler temperature as the reference temperature. Clearly the planet is still within the NORMAL range of the present interglacial period with significantly more atmospheric CO2. And it's BELOW NORMAL for previous interglacial periods. If you can't figure out why this is relevant let me know.
It does NOT show the same thing. That 1997 GISP2 plot is complete shite, even as local data. What it shows is Greenland temperatures. Global temps looked like this:

2000%2B_year_global_temperature_including_Medieval_Warm_Period_and_Little_Ice_Age_-_Ed_Hawkins.svg


Forum List

Back
Top