NoNukes
Gold Member
You consistently show your ignorance.I thought global warming causes fires and droughts.
Can you pick a story and stick with it?
We never had floods before gullible warming
Follow along with the video below to see how to install our site as a web app on your home screen.
Note: This feature may not be available in some browsers.
You consistently show your ignorance.I thought global warming causes fires and droughts.
Can you pick a story and stick with it?
We never had floods before gullible warming
Now that is total sea ice area. And it shows a definate downward trend. Learn to read graphs, failure to be able to read a simple graph won't fly in any science course.Kiddo, have you taken any college level science courses yet? High school level? And why do you post such obvious bullshit?I did just open my post with the fact that they're modifying the received temperatures, and that whether or not you trust them is up to you. They gave a reason for it, don't recall what it was. I also pointed out several other things you have yet to address. Also, you show that the north pole is warming, but according to NASA, the ice there is at its thickest since the 1970s. If it actually were warming, they'd be thinning.RSS, eh. OK, RSS it is. And I'll even post a link so that you can check.The fact that ice sheets are the thickest they've ever been, and satellite data shows no abnormal global increase in heat for 17 years... also that to get the results they have been recently, they've had to edit the data to show heat... though, as far as the editing goes, whether you believe the scientists about having to edit it for 'science reasons' or if they're just tampering because they aren't getting what they want is totally up to you.And your proof of that is what, kiddo? Perhaps you should learn not the parrot the dumbest adults in the room.

The RSS satellite dataset shows no global warming at all for 213 months from August 1996 to April 2014. That is more than half the entire 423-month satellite record. The fastest centennial warming rate was in Central England from 1663-1762, at 0.9 Cº per century – before the industrial revolution began, it literally couldn't have been our fault. The global warming trend since 1900 is equivalent to 0.8 Cº per century, which is well within natural variability and has nothing to do with us. The fastest warming trend lasting ten years or more occurred over the 40 years from 1694-1733 in Central England, which was equivalent to 4.3 Cº per century. Since 1950, when a human influence on global temperature first became theoretically possible, the global warming trend is equivalent to 1.2 Cº per century, and the fastest warming rate, lasting ten years or more, since 1950 occurred over the 33 years from 1974 to 2006, it was equivalent to 2.0 Cº per century. In 1990, the IPCC’s mid-range prediction of the near-term warming trend was equivalent to 3.5 Cº per century. The global warming trend since 1990, when the IPCC wrote its first report, is equivalent to 1.4 Cº per century – two-fifths of what the IPCC had then predicted. In 2013 the IPCC’s new mid-range prediction of the near-term warming trend was for warming at a rate equivalent to 1.7 Cº per century – just half its 1990 prediction. Though the IPCC has cut its near-term warming prediction, it has not cut its centennial warming prediction of 3.7 Cº warming to 2100 on business as usual. The IPCC’s prediction of 3.7 Cº warming by 2100 is more than twice the greatest rate of warming lasting more than ten years that has been measured since 1950. The IPCC’s 3.7 Cº-by-2100 prediction is more than three times the observed real-world warming trend since we might in theory have begun influencing it in 1950. Since 1 January 2001, the dawn of the new millennium, the warming trend on the dataset of five major datasets is zero – 0.0 Cº per century. No warming for 13 years 3 months.
It's not happening, period.
You're welcome.
Climate Analysis | Remote Sensing Systems

So we can see that the water vapor is increasing.

That is pretty definate warming.

Definate cooling in the stratosphere, exactly as predicted.
Now there has always been a gap between the satellite measured troposphere temperatures, and that measured at surface systems.
The ice is not only thinning, it is radically reducing in volume.

PIOMAS April 2016
According to NASA, they're actually getting thicker. Receded, like, a tiny bit... then went back to where it was before.


I read the article and didn't bother check the graph before linking it, it turned out the link was to show the predictions instead of the actual collected data. My bad. The second page pointed out that there aren't any available graphs for the current ice level.Now that is total sea ice area. And it shows a definate downward trend. Learn to read graphs, failure to be able to read a simple graph won't fly in any science course.Kiddo, have you taken any college level science courses yet? High school level? And why do you post such obvious bullshit?I did just open my post with the fact that they're modifying the received temperatures, and that whether or not you trust them is up to you. They gave a reason for it, don't recall what it was. I also pointed out several other things you have yet to address. Also, you show that the north pole is warming, but according to NASA, the ice there is at its thickest since the 1970s. If it actually were warming, they'd be thinning.RSS, eh. OK, RSS it is. And I'll even post a link so that you can check.The fact that ice sheets are the thickest they've ever been, and satellite data shows no abnormal global increase in heat for 17 years... also that to get the results they have been recently, they've had to edit the data to show heat... though, as far as the editing goes, whether you believe the scientists about having to edit it for 'science reasons' or if they're just tampering because they aren't getting what they want is totally up to you.
The RSS satellite dataset shows no global warming at all for 213 months from August 1996 to April 2014. That is more than half the entire 423-month satellite record. The fastest centennial warming rate was in Central England from 1663-1762, at 0.9 Cº per century – before the industrial revolution began, it literally couldn't have been our fault. The global warming trend since 1900 is equivalent to 0.8 Cº per century, which is well within natural variability and has nothing to do with us. The fastest warming trend lasting ten years or more occurred over the 40 years from 1694-1733 in Central England, which was equivalent to 4.3 Cº per century. Since 1950, when a human influence on global temperature first became theoretically possible, the global warming trend is equivalent to 1.2 Cº per century, and the fastest warming rate, lasting ten years or more, since 1950 occurred over the 33 years from 1974 to 2006, it was equivalent to 2.0 Cº per century. In 1990, the IPCC’s mid-range prediction of the near-term warming trend was equivalent to 3.5 Cº per century. The global warming trend since 1990, when the IPCC wrote its first report, is equivalent to 1.4 Cº per century – two-fifths of what the IPCC had then predicted. In 2013 the IPCC’s new mid-range prediction of the near-term warming trend was for warming at a rate equivalent to 1.7 Cº per century – just half its 1990 prediction. Though the IPCC has cut its near-term warming prediction, it has not cut its centennial warming prediction of 3.7 Cº warming to 2100 on business as usual. The IPCC’s prediction of 3.7 Cº warming by 2100 is more than twice the greatest rate of warming lasting more than ten years that has been measured since 1950. The IPCC’s 3.7 Cº-by-2100 prediction is more than three times the observed real-world warming trend since we might in theory have begun influencing it in 1950. Since 1 January 2001, the dawn of the new millennium, the warming trend on the dataset of five major datasets is zero – 0.0 Cº per century. No warming for 13 years 3 months.
It's not happening, period.
You're welcome.
Climate Analysis | Remote Sensing Systems
So we can see that the water vapor is increasing.
That is pretty definate warming.
Definate cooling in the stratosphere, exactly as predicted.
Now there has always been a gap between the satellite measured troposphere temperatures, and that measured at surface systems.
The ice is not only thinning, it is radically reducing in volume.
PIOMAS April 2016
According to NASA, they're actually getting thicker. Receded, like, a tiny bit... then went back to where it was before.
Polar Sea Ice Cap and Snow - Cryosphere Today
OK, you are young, and still learning,. But in any of the science courses that I have taken in college, Physics, Chemistry, Biology, and Geology, such an error would earn an F and considerable disdain from the instructor.I read the article and didn't bother check the graph before linking it, it turned out the link was to show the predictions instead of the actual collected data. My bad. The second page pointed out that there aren't any available graphs for the current ice level.Now that is total sea ice area. And it shows a definate downward trend. Learn to read graphs, failure to be able to read a simple graph won't fly in any science course.Kiddo, have you taken any college level science courses yet? High school level? And why do you post such obvious bullshit?I did just open my post with the fact that they're modifying the received temperatures, and that whether or not you trust them is up to you. They gave a reason for it, don't recall what it was. I also pointed out several other things you have yet to address. Also, you show that the north pole is warming, but according to NASA, the ice there is at its thickest since the 1970s. If it actually were warming, they'd be thinning.RSS, eh. OK, RSS it is. And I'll even post a link so that you can check.
Climate Analysis | Remote Sensing Systems
So we can see that the water vapor is increasing.
That is pretty definate warming.
Definate cooling in the stratosphere, exactly as predicted.
Now there has always been a gap between the satellite measured troposphere temperatures, and that measured at surface systems.
The ice is not only thinning, it is radically reducing in volume.
PIOMAS April 2016
According to NASA, they're actually getting thicker. Receded, like, a tiny bit... then went back to where it was before.
Polar Sea Ice Cap and Snow - Cryosphere Today
As a result of human caused global warming, the atmospheric and the oceans (and lakes, rivers and streams) are warmer.....warmer air can hold more water vapor......warmer oceans and other bodies of water tend to evaporate more water faster.....and now, water vapor levels have increased so much, rain and snowstorms can drop much larger quantities of water than before the air warmed and water vapor levels increased.
Although the denier cultists will undoubtedly chant that there have always been heavy rain and floods and massive blizzards, the plain fact is that all of those are becoming more intense and destructive because of the greater amount of water held in the air......which results in this example of global warming driven climate disruptions in action:
"...the torrential flooding after as much as 8-10 inches of rain fell in six to eight hours in parts of the state on Thursday", according to the National Weather Service. This amount of rain in such a short time is likely a "one-in-a-thousand-year event," the weather service said.
At least 26 dead as historic floods sweep West Virginia
USA TODAY
Doug Stanglin and Doyle Rice,
June 25, 2016
(excerpts)
The bodies of three more victims of West Virginia's historic flooding were found overnight Saturday, according to county authorities, raising the death toll to 26 from torrential rains and high water that has destroyed more than 100 homes, washed out scores of roads and bridges and knocked out power to tens of thousands of people. On Saturday, President Obama declared a major disaster for West Virginia and ordered federal aid to supplement state and local recovery efforts in the counties of Greenbrier, Kanawha and Nicholas.
...At least 23 others, including an 8-year-old boy who was wading in a foot of water, were killed in the torrential flooding after as much as 8-10 inches of rain fell in six to eight hours in parts of the state on Thursday, according to the National Weather Service. This amount of rain in such a short time is likely a "one-in-a-thousand-year event," the weather service said. The heavy rains and rising water swamped towns, inundated a two-century old resort and trapped 500 people in a shopping center when a bridge was washed out. The storm also knocked out power to 66,000 West Virginians, and forced the shut off of gas in the town of White Sulphur Springs, Tomblin said.
Gov. Earl Ray Tomblin told reporters Friday that damage is widespread and devastating. Saying search and rescue missions are still a top priority, Tomblin issued a state of emergency for 44 counties and deployed 150 members of the National Guard to help emergency responders. The Governer said 60 roads were closed, many of them destroyed, bridges were knocked out, and homes were burned down and washed off foundations. Tens of thousands of people were without power, and several roads were impassable, the Associated Press reported. One dramatic video posted on the WVMetro news website showed a burning house floating down Howard's Creek in White Sulphur Springs.
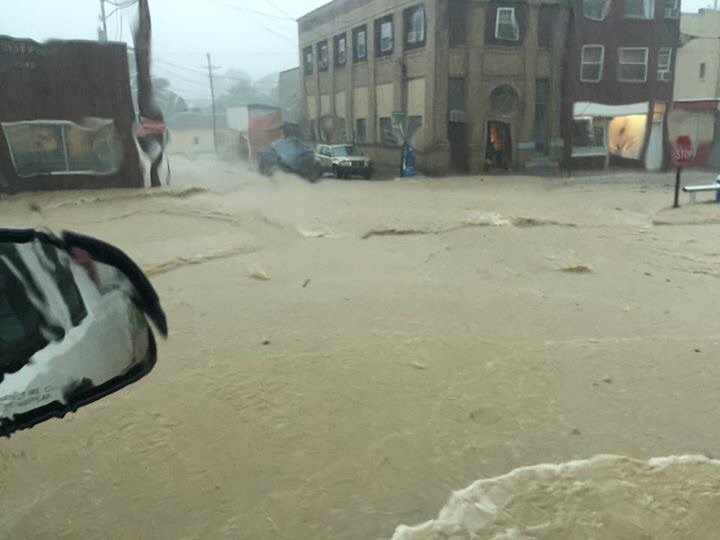
FLOOD EMERGENCY: Clendenin,WV can only be accessed by helicopter.
As a result of human caused global warming, the atmospheric and the oceans (and lakes, rivers and streams) are warmer
How much warmer?
How do you know?
NASA Earth Science News Team


Beaufort Sea surface temperatures where Canada's Mackenzie River discharges into the Arctic Ocean, measured by NASA's MODIS instrument. The top image is from June 14, 2012. In the bottom image (July 5, 2012), warm river waters had broken through a shoreline sea ice barrier to enhance sea ice melt. Image Credit: NASA
The heat from warm river waters draining into the Arctic Ocean is contributing to the melting of Arctic sea ice each summer, a new NASA study finds.
A research team led by Son Nghiem of NASA’s Jet Propulsion Laboratory in Pasadena, Calif., used satellite data to measure the surface temperature of the waters discharging from a Canadian river into the icy Beaufort Sea during the summer of 2012. They observed a sudden influx of warm river waters into the sea that rapidly warmed the surface layers of the ocean, enhancing the melting of sea ice. A paper describing the study is now published online in the journal Geophysical Research Letters.
NASA MODIS movie from June 14, 2012, shows a blue band of sea ice stuck to the Mackenzie River shoreline. The map fades, revealing the seafloor depth below. The band of stuck sea ice closely follows the highlighted 25-meter-depth contour line. The seafloor topography helps delay river discharge. Image Credit: NASA/International Bathymetric Chart of the Arctic OceanSee animation
This Arctic process contrasts starkly with those that occur in Antarctica, a frozen continent without any large rivers. The sea ice cover in the Southern Ocean surrounding Antarctica has been relatively stable, while Arctic sea ice has been declining rapidly over the past decade.
“River discharge is a key factor contributing to the high sensitivity of Arctic sea ice to climate change,” said Nghiem. “We found that rivers are effective conveyers of heat across immense watersheds in the Northern Hemisphere. These watersheds undergo continental warming in summertime, unleashing an enormous amount of energy into the Arctic Ocean, and enhancing sea ice melt. You don’t have this in Antarctica.”
The team said the impacts of these warm river waters are increasing due to three factors. First, the overall volume of water discharged from rivers into the Arctic Ocean has increased. Second, rivers are getting warmer as their watersheds (drainage basins) heat up. And third, Arctic sea ice cover is becoming thinner and more fragmented, making it more vulnerable to rapid melt. In addition, as river heating contributes to earlier and greater loss of the Arctic’s reflective sea ice cover in summer, the amount of solar heat absorbed into the ocean increases, causing even more sea ice to melt.
Climate Change: Vital Signs of the Planet: Warm rivers play role in Arctic sea ice melt
Do you want more?
The theory of Global Warming included heat "rising," because "rising" means going "up" to the Arctic. It must mean that....
because Antarctic Sea Ice is growing...
Anarctic sea ice slightly below normal at present.The theory of Global Warming included heat "rising," because "rising" means going "up" to the Arctic. It must mean that....
because Antarctic Sea Ice is growing...
And the retard chorus spews more deranged nonsense in the face of the evidence that they are deluded, confused, anti-science, crackpot cultists.
I thought global warming causes fires and droughts.
Can you pick a story and stick with it?
We never had floods before gullible warming
As a result of human caused global warming, the atmospheric and the oceans (and lakes, rivers and streams) are warmer.....warmer air can hold more water vapor......warmer oceans and other bodies of water tend to evaporate more water faster.....and now, water vapor levels have increased so much, rain and snowstorms can drop much larger quantities of water than before the air warmed and water vapor levels increased.
Although the denier cultists will undoubtedly chant that there have always been heavy rain and floods and massive blizzards, the plain fact is that all of those are becoming more intense and destructive because of the greater amount of water held in the air......which results in this example of global warming driven climate disruptions in action:
"...the torrential flooding after as much as 8-10 inches of rain fell in six to eight hours in parts of the state on Thursday", according to the National Weather Service. This amount of rain in such a short time is likely a "one-in-a-thousand-year event," the weather service said.
At least 26 dead as historic floods sweep West Virginia
USA TODAY
Doug Stanglin and Doyle Rice,
June 25, 2016
(excerpts)
The bodies of three more victims of West Virginia's historic flooding were found overnight Saturday, according to county authorities, raising the death toll to 26 from torrential rains and high water that has destroyed more than 100 homes, washed out scores of roads and bridges and knocked out power to tens of thousands of people. On Saturday, President Obama declared a major disaster for West Virginia and ordered federal aid to supplement state and local recovery efforts in the counties of Greenbrier, Kanawha and Nicholas.
...At least 23 others, including an 8-year-old boy who was wading in a foot of water, were killed in the torrential flooding after as much as 8-10 inches of rain fell in six to eight hours in parts of the state on Thursday, according to the National Weather Service. This amount of rain in such a short time is likely a "one-in-a-thousand-year event," the weather service said. The heavy rains and rising water swamped towns, inundated a two-century old resort and trapped 500 people in a shopping center when a bridge was washed out. The storm also knocked out power to 66,000 West Virginians, and forced the shut off of gas in the town of White Sulphur Springs, Tomblin said.
Gov. Earl Ray Tomblin told reporters Friday that damage is widespread and devastating. Saying search and rescue missions are still a top priority, Tomblin issued a state of emergency for 44 counties and deployed 150 members of the National Guard to help emergency responders. The Governer said 60 roads were closed, many of them destroyed, bridges were knocked out, and homes were burned down and washed off foundations. Tens of thousands of people were without power, and several roads were impassable, the Associated Press reported. One dramatic video posted on the WVMetro news website showed a burning house floating down Howard's Creek in White Sulphur Springs.
FLOOD EMERGENCY: Clendenin,WV can only be accessed by helicopter.
As I said in the OP....Although the denier cultists will undoubtedly chant that there have always been heavy rain and floods and massive blizzards, the plain fact is that all of those are becoming more intense and destructive because of the greater amount of water held in the air...Sooooo, I guess the great flood of 1862 that turned the entire Central Valley of California into a lake didn't happen.
And there you go again, walleyed, talking to yourself like a moron.The level of hyperbole, and sheer outright bullshit you spew is amazing to behold.
[
The poor loons can't tell the difference between Weather and real Climate Change.
[
The poor loons can't tell the difference between Weather and real Climate Change.
The poor loons can't come to grips with the fact that across 4.7 billion years, the ONLY constant to the climate of this planet has been change.
These insane cultists are truly convinced that they have tapped into a higher power that will allow them to control the climate, if only they can force others to obey the dictates of their religion and forgo knowledge in favor of primitive servitude. Their tepid goddess tells them that if we live in the forests as unthinking beasts, if we turn from our carbon sins of knowledge and technology, then Gaia will forgive us and stop the warming trend that has gone on for the last 400 years.
They are simply insane, less rational than the Jonestown cultists.
You consistently show your ignorance.I thought global warming causes fires and droughts.
Can you pick a story and stick with it?
We never had floods before gullible warming
Yes, by making the past look warmer, and thus making the current warming look smaller. That simple fact destroys the basis of the denier cult's primary conspiracy theory, so they simply lie big and often by pretending the exact opposite of reality is true.I did just open my post with the fact that they're modifying the received temperatures, and that whether or not you trust them is up to you.
Why haven't the global warming fires dried up the floods
Listen,
Global warming causes extremes within the short term weather pattern. One area of our planet could during a period of time have stronger ridges of high pressure = more extreme droughts under them, while other areas will have the extreme rain. Learn the subject as you don't seem to understand it very well at all. There's a reason one area has droughts but another can be have record rainfall, and both can happen at the same time on our planet based on the meteorological setup.
Especially causes extreme short term weather patterns when you are spraying nano-particulate metals into the upper atmosphere and zapping them with ionispheric heaters and that is a fact. Consider yourself "schooled".
Don't let facts get in the way of a good fear mongering.....eh?
