In summary...

We are facing an approximate increase of 1 degree average over the past century


No we aren't.

That's why to show a "sea level rise" your side cherry picks three island chains on the lip of the Pacific Ring of Fire, because THERE IS NO SEA LEVEL RISE, as 90% of Earth ice on Antarctica adds at least 80 billion tons of ice every year.
 
No, what I see is extreme ignorance on your part. There was no consensus in the 1970's concerning global cooling.

.

Of course there was rocks....the fact that climate science feels the need to try and make its past mistakes disappear is just one of many reasons that they have no credibility.

There were hundreds of studies between the 60's and 80's that predicted a cooling trend....and that was in an atmosphere that was not publish or perish as is the feeling today...

For Example:

NOAA, 1974

In the Sahelian zone of Africa south of the Sahara, the countries of Chad, The Gambia, Mali, Mauritania, Niger, Senegal, and Upper Volta are enduring a drought that in some areas has been going on for more than six years now, following some 40 previous years of abundant monsoon rainfall. And the drought is spreading—eastward into Ehtiopia and southward into Dahomey, Egypt, Guinea, Kenya, Nigeria, Somalia, Tanzania, and Zaire. … Many climatologists have associated this drought and other recent weather anomalies with a global cooling trend and changes in atmospheric circulation which, if prolonged, pose serious threats to major food-producing regions of the world.Annual average temperatures over the Northern Hemisphere increased rather dramatically from about 1890 through 1940, but have been falling ever since. The total change has averaged about one-half degree Centigrade, with the greatest cooling in higher latitudes. A drop of only one or two degrees Centigrade in the annual average temperature at higher latitudes can shorten the growing season so that some crops have to be abandoned. … [T]he average growing season in England is already two weeks shorter than it was before 1950. Since the late 1950’s, Iceland’s hay crop yield has dropped about 25 percent, while pack ice in waters around Iceland and Greenland ports is becoming the hazard to navigation it was during the 17th and 18th centuries. … Some climatologists think that if the current cooling trend continues, drought will occur more frequently in India—indeed, through much of Asia, the world’s hungriest continent. … Some climatologists think that the present cooling trend may be the start of a slide into another period of major glaciation, popularly called an “ice age.”


Full text of "Understanding climatic change" (this from the National Academy of Sciences)

A striking feature of the instrumental record is the behavior of temperature worldwide. As shown by Mitchell (1970), the average surface air temperature in the northern hemisphere increased from the 1880's until about 1940 and has been decreasing thereafter (see Figure A. 6,Appendix A). Starr and Oort (1973) have reported that, during the period 1958-1963, the hemisphere's (mass-weighted) mean temperature decreased by about 0.6 °C. In that period the polar and subtropical arid regions experienced the greatest cooling. The cause of this variation
is not known, although clearly this trend cannot continue indefinitely.

There seems little doubt that the present period of unusual warmth will eventually give way to a time of colder climate, but there is no consensus with regard to either the magnitude or rapidity of the transition. The onset of this climatic decline could be several thousand years in the future, although there is a finite probability that a serious worldwide cooling could befall the earth within the next hundred years.
 
We are facing an approximate increase of 1 degree average over the past century


No we aren't.

That's why to show a "sea level rise" your side cherry picks three island chains on the lip of the Pacific Ring of Fire, because THERE IS NO SEA LEVEL RISE, as 90% of Earth ice on Antarctica adds at least 80 billion tons of ice every year.

:dunno: I think you've confused my comment with that of a liberal Warmer. It had nothing to do with sea ice. Our median global temperature is up 1 degree over the past 100 years according to all the data we have. There is no proof this is the result of anything man is doing, excess CO2 or GHGs, or anything else. While there might be some melting of ice shelves in the Arctic, there is growing ice shelves in the Antarctic. The median sea level is not rising and if it ever rose more than a foot, the natural convection system of the ocean would cease to function and we'd have bigger problems than coastal flooding.
 
[
Why yes, the most abundant and prevalent GHG is water vapor. And it's residence time in the atmosphere is about 10 days. While that of CO2 is centuries. So, in times of rapidly declining CO2, like the end of the Ordivician, there were continental glaciations near the equator. Even though there was still the same amount of water on this planet..

One word for you rocks....BULLSHIT. You know perfectly well that the residence time for CO2 is nothing like that and study after study has stated as much...

Carbon-dioxide-residence-time.jpg


Here are 37 studies...31 of them find the residence time of CO2 in the atmosphere to be less than 10 years...notice that the IPCC has pegged the bullshit meter at 100 years and you are claiming multiple centuries....

Here is some figures from Princeton University;

http://www.princeton.edu/~lam/TauL1b.pdf

From Yale;

Common Climate Misconceptions: Atmospheric Carbon Dioxide - Yale Climate Connections

Understanding the carbon cycle is a key part of understanding the broader climate change issue. But a number of misconceptions floating around the blogosphere confuse basic concepts to argue that climate change is irrelevant because of the short residence time of carbon molecules in the atmosphere and the large overall carbon stock in the environment.

It turns out that while much of the “pulse” of extra CO2 accumulating in the atmosphere would be absorbed over the next century if emissions miraculously were to end today, about 20 percent of that CO2 would remain for at least tens of thousands of years.

Residence Time of Carbon Dioxide in the Atmosphere

joos_shine.jpg


Fig. 9a: Decay of a small pulse of CO2 added to today's atmosphere, based on analytic approximation to the Bern carbon cycle model
(Joos F et al., An efficient and accurate representation of complex oceanc and biospheric models of anthropogenic carbon uptake, Tellus, 48B, 397-417, 1996; Shine et al., Alternatives to the global warming potential for comparing climate impacts of emissions of greenhouse gases, Clim. Change, 68, 281-302, 2005, see equation given in figure).

In this approximation of the carbon cycle,

    • about 1/3 of the anthropogenic CO2 emissions remain in the atmosphere after 100 years, and
    • 1/5 after 1000 years.


The complex global carbon cycle process involves carbon absorption and release by the atmosphere, oceans, soils, and organic matter, and also emissions from anthropogenic fossil fuel combustion and land-use changes. The figure below shows the best estimate of annual carbon fluxes from main sources and sinks.
 
Boss;

We're not rising rapidly and we're not at 400 ppm yet. I think the latest data shows around 360. 120,000 years ago, the Earth was a completely different planet, our atmosphere was completely different. Man, if he even existed yet, was indeed not industrialized.
...........................................................................................................................................................................
Recent Monthly Average Mauna Loa CO2
August 2016: 402.25 ppm
August 2015: 398.93 ppm
ESRL Global Monitoring Division - Global Greenhouse Gas Reference Network

Seems you are completely wrong. Took about 20 seconds on google. Perhaps were you not so lazy you wouldn't embarrass yourself so regularly.
 
Boss;

Now let me explain something to you with this nonsense about rising sea levels.... If enough ice melts at our northern pole to generate enough water to raise the sea level one single foot, it will have such a dramatic cooling effect on the ocean's natural convection that most sea life would become endangered and we would have MUCH bigger problems than flooded coast lines. What we know is happening, is at the southern pole, sea ice is growing. This is offsetting what is happening in the Arctic.
...................................................................................................................................................................................

Damn, now this is funny. It is the ice from Greenland, alpine glaciers, and the Antarctic Ice Cap that is raising the sea levels. And just that from the Greenland cap would raise sea level by 20 feet. Not only that, but if the West Antarctic Ice Shelf comes ungrounded, that would raise sea level by 20 feet. And that ice sheet is very unstable. And the sea ice around Antarctica is actually below normal for this time of year right now.
 
Boss;

We're not rising rapidly and we're not at 400 ppm yet. I think the latest data shows around 360. 120,000 years ago, the Earth was a completely different planet, our atmosphere was completely different. Man, if he even existed yet, was indeed not industrialized.
...........................................................................................................................................................................
Recent Monthly Average Mauna Loa CO2
August 2016: 402.25 ppm
August 2015: 398.93 ppm
ESRL Global Monitoring Division - Global Greenhouse Gas Reference Network

Seems you are completely wrong. Took about 20 seconds on google. Perhaps were you not so lazy you wouldn't embarrass yourself so regularly.

Sorry, but you are presenting data at ONE place on the planet. That's not a GLOBAL average.

Try again!
 
Boss;

The dramatic weather systems you call "stuck" are largely the result of El Niño and La Niña phenomenon that are completely natural and have been happening for all of Earth's existence as a stable planet.
..............................................................................................................................................................................
Not at all. Here is Dr. Jennifer Francis, of Rutgers University. A long lecture, but if you really have a college education, you should be used to that.

 
Damn, now this is funny. It is the ice from Greenland, alpine glaciers, and the Antarctic Ice Cap that is raising the sea levels. And just that from the Greenland cap would raise sea level by 20 feet. Not only that, but if the West Antarctic Ice Shelf comes ungrounded, that would raise sea level by 20 feet. And that ice sheet is very unstable. And the sea ice around Antarctica is actually below normal for this time of year right now.

Nonsense. You DO understand that all that melting ice results in cold water being introduced into the oceans... that's what is going to raise the sea levels... and IF that were to happen to the extent you suggest, the natural process of ocean convection would stop working. This is the currents of the oceans... it is essential to virtually ALL sea life. Whenever the convection stops due to all the new cold water being introduced, the problem is NOT going to be coastal flooding. It will be the mass extinction of sea life happening all over the world.
 
Boss;

We're not rising rapidly and we're not at 400 ppm yet. I think the latest data shows around 360. 120,000 years ago, the Earth was a completely different planet, our atmosphere was completely different. Man, if he even existed yet, was indeed not industrialized.
...........................................................................................................................................................................
Recent Monthly Average Mauna Loa CO2
August 2016: 402.25 ppm
August 2015: 398.93 ppm
ESRL Global Monitoring Division - Global Greenhouse Gas Reference Network

Seems you are completely wrong. Took about 20 seconds on google. Perhaps were you not so lazy you wouldn't embarrass yourself so regularly.

Sorry, but you are presenting data at ONE place on the planet. That's not a GLOBAL average.

Try again!
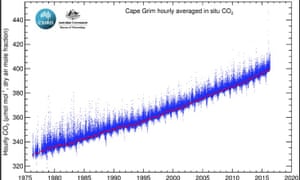
The news comes as one important atmospheric measuring station at Cape Grim in Australia is poised on the verge of 400ppm for the first time. Sitting in a region with stable CO2 concentrations, once that happens, it will never get a reading below 400ppm.


https://www.theguardian.com/environment/2016/may/11/worlds-carbon-dioxide-concentration-teetering-on-the-point-of-no-return

Now Boss, really, you could try to find this kind of information yourself.
 
Not at all. Here is Dr. Jennifer Francis, of Rutgers University. A long lecture, but if you really have a college education, you should be used to that.

And how much government money did Dr. Francis receive last year to conduct her research? You are listening to people who have a VESTED INTEREST in keeping the balloon in the air. Of COURSE she is going to present a case... Of COURSE she is going to tell you that MORE MONEY is needed! That's how she makes her living and continues to do what she does. She is a shill and you're a dupe.
 
Boss;

We're not rising rapidly and we're not at 400 ppm yet. I think the latest data shows around 360. 120,000 years ago, the Earth was a completely different planet, our atmosphere was completely different. Man, if he even existed yet, was indeed not industrialized.
...........................................................................................................................................................................
Recent Monthly Average Mauna Loa CO2
August 2016: 402.25 ppm
August 2015: 398.93 ppm
ESRL Global Monitoring Division - Global Greenhouse Gas Reference Network

Seems you are completely wrong. Took about 20 seconds on google. Perhaps were you not so lazy you wouldn't embarrass yourself so regularly.

Sorry, but you are presenting data at ONE place on the planet. That's not a GLOBAL average.

Try again!
The news comes as one important atmospheric measuring station at Cape Grim in Australia is poised on the verge of 400ppm for the first time. Sitting in a region with stable CO2 concentrations, once that happens, it will never get a reading below 400ppm.


https://www.theguardian.com/environment/2016/may/11/worlds-carbon-dioxide-concentration-teetering-on-the-point-of-no-return

Now Boss, really, you could try to find this kind of information yourself.

AGAIN.... You are pointing to ONE reporting station and trying to support your false claim that GLOBAL average CO2 is over 400 ppm. There are places where it's MUCH lower.
 
Damn, now this is funny. It is the ice from Greenland, alpine glaciers, and the Antarctic Ice Cap that is raising the sea levels. And just that from the Greenland cap would raise sea level by 20 feet. Not only that, but if the West Antarctic Ice Shelf comes ungrounded, that would raise sea level by 20 feet. And that ice sheet is very unstable. And the sea ice around Antarctica is actually below normal for this time of year right now.

Nonsense. You DO understand that all that melting ice results in cold water being introduced into the oceans... that's what is going to raise the sea levels... and IF that were to happen to the extent you suggest, the natural process of ocean convection would stop working. This is the currents of the oceans... it is essential to virtually ALL sea life. Whenever the convection stops due to all the new cold water being introduced, the problem is NOT going to be coastal flooding. It will be the mass extinction of sea life happening all over the world.
A bit exaggerated, but not that bad of an analysis.

Study: Melting Greenland ice sheet is rapidly slowing the Gulf Stream

The Northern Hemisphere winter of 2014-15 was the warmest on record globally, according to the National Oceanic and Atmospheric Administration. But if you look closely at global temperature maps, it becomes clear that one area of the North Atlantic conspicuously bucked the trend, as it has during many years since 1970.

That region was, in fact, the coldest it has been since the dawn of instrument records, at up to 3.6 degrees Fahrenheit colder than average. According to a new study, this cold pool may be an indicator of a dramatic slowdown in the Gulf Stream, which transports vast amounts of heat north from the equator to the pole, passing off the East Coast of the U.S. and into the North Atlantic.

If true, this is vindication for those who think global warming is likely to trigger so-called "tipping points" in the climate system, which, once set into motion, cannot be stopped. The U.N. Intergovernmental Panel on Climate Change had judged that there is up to a 10% likelihood of a Gulf Stream shutdown before year 2100, though many climate scientists estimate this likelihood is even higher.

"Evidence is mounting that the long-feared circulation decline is already well underway," "Evidence is mounting that the long-feared circulation decline is already well underway," says co-author Stefan Rahmstorf, a climate scientist at the Potsdam Institute for Climate Impact Research in Germany, in a blog post for RealClimate.
The slowdown in this current, the study finds, is unprecedented in hundreds to perhaps as long as 1,000 years, and is most likely related to another tipping point, which is the melting of the Greenland ice sheet. The influx of freshwater from the ice sheet is one of the main sources of freshwater inflow into the North Atlantic Ocean.
 
Boss;

We're not rising rapidly and we're not at 400 ppm yet. I think the latest data shows around 360. 120,000 years ago, the Earth was a completely different planet, our atmosphere was completely different. Man, if he even existed yet, was indeed not industrialized.
...........................................................................................................................................................................
Recent Monthly Average Mauna Loa CO2
August 2016: 402.25 ppm
August 2015: 398.93 ppm
ESRL Global Monitoring Division - Global Greenhouse Gas Reference Network

Seems you are completely wrong. Took about 20 seconds on google. Perhaps were you not so lazy you wouldn't embarrass yourself so regularly.

Sorry, but you are presenting data at ONE place on the planet. That's not a GLOBAL average.

Try again!
The news comes as one important atmospheric measuring station at Cape Grim in Australia is poised on the verge of 400ppm for the first time. Sitting in a region with stable CO2 concentrations, once that happens, it will never get a reading below 400ppm.


https://www.theguardian.com/environment/2016/may/11/worlds-carbon-dioxide-concentration-teetering-on-the-point-of-no-return

Now Boss, really, you could try to find this kind of information yourself.

AGAIN.... You are pointing to ONE reporting station and trying to support your false claim that GLOBAL average CO2 is over 400 ppm. There are places where it's MUCH lower.
The graph shows recent monthly mean carbon dioxide globally averaged over marine surface sites. The Global Monitoring Division of NOAA/Earth System Research Laboratory has measured carbon dioxide and other greenhouse gases for several decades at a globally distributed network of air sampling sites [Conway, 1994]. A global average is constructed by first fitting a smoothed curve as a function of time to each site, and then the smoothed value for each site is plotted as a function of latitude for 48 equal time steps per year. A global average is calculated from the latitude plot at each time step [Masarie, 1995]. Go here for more details on how global means are calculated.

Recent Global CO2
July 2016: 401.72 ppm
July 2015: 398.13 ppm

http://www.esrl.noaa.gov/gmd/ccgg/trends/global.html#global

See, Boss, I don't flap yap with zero to back me up. I have followed the increase in CO2 and CH4 for a lot of years.http://www.esrl.noaa.gov/gmd/ccgg/about/global_means.html
 
See, Boss, I don't flap yap with zero to back me up. I have followed the increase in CO2 and CH4 for a lot of years.

No, you flap that yap a lot. You've not backed up anything as best I can tell. And what fucking difference does the magic number 400 ppm make anyway? Mother Nature isn't keeping tabs on your arbitrary numbers. It could be that 400 ppm over the course of a billion years is perfectly "normal" for our planet? You don't KNOW this... none of you do... you ASSUME to know a lot of stuff that you don't know.

Maybe we're supposed to be warmer? Maybe there's not supposed to be a lot of sea ice? Maybe the coastal sea levels should be higher? Maybe arid deserts are supposed to be lush with vegetation? Maybe your whole entire idea of what is "ideal" is a bunch of self-aggrandizing, self-important nonsense? You have no PROOF you are right, you just want to bully people into believing you are.
 
LOL Well, I can see why you vote for a loser like Trump. You are incapable of admitting that there are things you don't know, and when you make stupid statements, you double down on them. LOL

Well, you are in good company with Silly Billy, jc, and Ladumbkopf. Your chosen peer group. LOL
 
LOL Well, I can see why you vote for a loser like Trump. You are incapable of admitting that there are things you don't know, and when you make stupid statements, you double down on them. LOL

Well, you are in good company with Silly Billy, jc, and Ladumbkopf. Your chosen peer group. LOL

That's right pinhead... throw out your little smarmy condescending insult and run away... that's what you libtards do best.
 
Now dear little cocksuck, you have shown that you don't do minimal research before you post garbage. Why should I not be condescending towards you? After all, I am not an academic, just an old millwright that knows the basics of doing research. You want respect, earn it. Thus far, you have not. You are like one of those college educated managers that thinks a degree in business management makes him an expert in maintenance, yet does not know the difference between a volt and an amp. That does not even know how to convert metric to english measurement. And, yes, the people in maintenance can get away with telling such people to fuck off. Because a good maintenance person, millwright, electrician, or automation, is harder to come by than some asshole with a management degree.
 
[
Why yes, the most abundant and prevalent GHG is water vapor. And it's residence time in the atmosphere is about 10 days. While that of CO2 is centuries. So, in times of rapidly declining CO2, like the end of the Ordivician, there were continental glaciations near the equator. Even though there was still the same amount of water on this planet..

One word for you rocks....BULLSHIT. You know perfectly well that the residence time for CO2 is nothing like that and study after study has stated as much...

Carbon-dioxide-residence-time.jpg


Here are 37 studies...31 of them find the residence time of CO2 in the atmosphere to be less than 10 years...notice that the IPCC has pegged the bullshit meter at 100 years and you are claiming multiple centuries....

Here is some figures from Princeton University;

http://www.princeton.edu/~lam/TauL1b.pdf

From Yale;

Common Climate Misconceptions: Atmospheric Carbon Dioxide - Yale Climate Connections

Understanding the carbon cycle is a key part of understanding the broader climate change issue. But a number of misconceptions floating around the blogosphere confuse basic concepts to argue that climate change is irrelevant because of the short residence time of carbon molecules in the atmosphere and the large overall carbon stock in the environment.

It turns out that while much of the “pulse” of extra CO2 accumulating in the atmosphere would be absorbed over the next century if emissions miraculously were to end today, about 20 percent of that CO2 would remain for at least tens of thousands of years.

Residence Time of Carbon Dioxide in the Atmosphere

joos_shine.jpg


Fig. 9a: Decay of a small pulse of CO2 added to today's atmosphere, based on analytic approximation to the Bern carbon cycle model
(Joos F et al., An efficient and accurate representation of complex oceanc and biospheric models of anthropogenic carbon uptake, Tellus, 48B, 397-417, 1996; Shine et al., Alternatives to the global warming potential for comparing climate impacts of emissions of greenhouse gases, Clim. Change, 68, 281-302, 2005, see equation given in figure).

In this approximation of the carbon cycle,

    • about 1/3 of the anthropogenic CO2 emissions remain in the atmosphere after 100 years, and
    • 1/5 after 1000 years.


The complex global carbon cycle process involves carbon absorption and release by the atmosphere, oceans, soils, and organic matter, and also emissions from anthropogenic fossil fuel combustion and land-use changes. The figure below shows the best estimate of annual carbon fluxes from main sources and sinks.

Sorry rocks...there are still 36 studies...not driven by the AGW agenda finding that the residence time of CO2 in the atmosphere is closer to 10 years....but thanks for confirming that you will believe anything so long as it fits well with your politics.
 

Forum List

Back
Top