CrusaderFrank
Diamond Member
- May 20, 2009
- 147,368
- 70,579
- 2,330
....and you pop right up.....moronically serving as one of the best example of brainless stupidity on this forum.....and there is a LOT of competition for that position from your fellow denier cult retards....Speaking of the lack of brains and critical thinking skills...
Like all of the other denier cult wackos, you inevitably try to cite worthless anti-science propaganda from a fossil fuel industry sponsored blog, while ignoring the actual science from reputable scientists published in the peer-reviewed science journals.toiletpaper://wattsupwiththat.files.wordpress.com/2014/03/certaintychannel_ipcc_reality.png?w=72
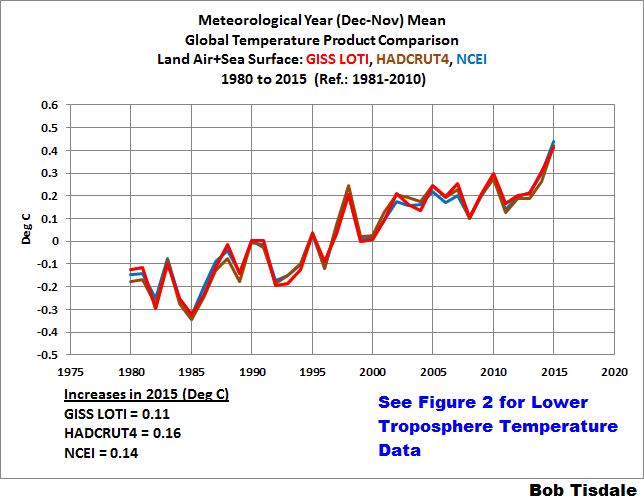
As far as your bogus graph goes....
...[Graph] comparing the global surface temperature projections from each of the first four IPCC reports to the subsequent observed temperature changes. We show that not only have the IPCC surface temperature projections been remarkably accurate, but they have also performed much better than predictions made by climate contrarians (Figure 1).
Figure 1: IPCC temperature projections (red, pink, orange, green) and contrarian projections (blue and purple) vs. observed surface temperature changes (average of NASAGISS, NOAA NCDC, and HadCRUT4; black and red) for 1990 through 2012.
Figure 3: IPCC FAR BAU global surface temperature projection adjusted to reflect observed GHG radiative forcings 1990-2011 (blue) vs. observed surface temperature changes (average of NASA GISS, NOAA NCDC, and HadCRUT4; red) for 1990 through 2012.
Figure 5: IPCC SAR Scenario IS92a global surface temperature projection (blue) vs. observed surface temperature changes (average of NASA GISS, NOAA NCDC, and HadCRUT4; red) for 1990 through 2012.
Figure 7: IPCC TAR model projection for emissions Scenario A2 (blue) vs. observed surface temperature changes (average of NASA GISS, NOAA NCDC, and HadCRUT4; red) for 1990 through 2012.
Rahmstorf et al. (2012) Verify TAR and AR4 Accuracy
A paper published in Environmental Research Letters by Rahmstorf, Foster, and Cazenave (2012) applied the methodology of Foster and Rahmstorf (2011), using the statistical technique of multiple regression to filter out the influences of the El Niño Southern Oscillation (ENSO) and solar and volcanic activity from the global surface temperature data to evaluate the underlying long-term primarily human-caused trend. Figure 11 compares their results with and without the short-term noise from natural temperature influences (pink and red, respectively) to the IPCC TAR (blue) and AR4 (green) projections.
Figure 11: Observed annual global temperature, unadjusted (pink) and adjusted for short-term variations due to solar variability, volcanoes, and ENSO (red) as in Foster and Rahmstorf (2011). 12-month running averages are shown as well as linear trend lines, and compared to the scenarios of the IPCC (blue range and lines from the 2001 report, green from the 2007 report). Projections are aligned in the graph so that they start (in 1990 and 2000, respectively) on the linear trend line of the (adjusted) observational data.
Frame and Stone (2012) Verify FAR Accuracy
A paper published in Nature Climate Change, Frame and Stone (2012), sought to evaluate the FAR temperature projection accuracy by using a simple climate model to simulate the warming from 1990 through 2010 based on observed GHG and other global heat imbalance changes. Figure 12 shows their results. Since the FAR only projected temperature changes as a result of GHG changes, the light blue line (model-simuated warming in response to GHGs only) is the most applicable result.
Figure 12: Observed changes in global mean surface temperature over the 1990–2010 period from HadCRUT3 and GISTEMP (red) vs. FAR BAU best estimate (dark blue), vs. projections using a one-dimensional energy balance model (EBM) with the measured GHGradiative forcing since 1990 (light blue) and with the overall radiative forcing since 1990 (green). Natural variability from the ensemble of 587 21-year-long segments of control simulations (with constant external forcings) from 24 Coupled Model Intercomparison Project phase 3 (CMIP3) climate models is shown in black and gray. From Frame and Stone (2012).
(excerpts from: Contrary to Contrarian Claims, IPCC Temperature Projections Have Been Exceptionally Accurate)
As the lie of AGW becomes more evident, they lie bigger about their confidence in that lie, in the hopes that no one will look closely.. Empirical evidence shows them frauds liars and deceitful pukes, but the faithful will believe the lies without question..
More of the usual anti-science denier cult crackpot conspiracy theory insanity about the entire world scientific community plotting to fool the rightwingnuts. Laughable and very pathetic!


You realize that ALL of charts show no warming since the mid-90's right?