ScienceRocks
Democrat all the way!
- Banned
- #1
http://data.giss.nasa.gov/gistemp/tabledata_v3/GLB.Ts+dSST.txt
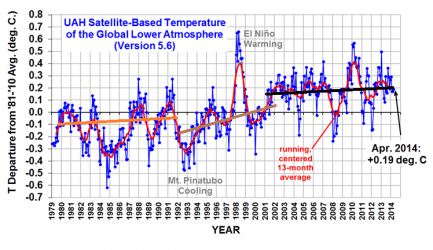
Second warmest April on record!
here is our developing nino

The attachment has some cool info") look at north America in context!
look at north America in context!
Second warmest April on record!
here is our developing nino
The attachment has some cool info
look at north America in context!Attachments
Last edited: