Stephanie
Diamond Member
- Jul 11, 2004
- 70,230
- 10,864
Now why are men out shooting up things? Obamanomics right in our face
Another good chart in the comment section with this article.
SNIP:
Obamanomics in Action: Worst Labor Force Participation Rate Since 1977
Jim Hoft Oct 2nd, 2015 9:49 am 20 Comments

Obamanomics in action–
The Obama economy added only 142,000 jobs in September – much lower than expected.
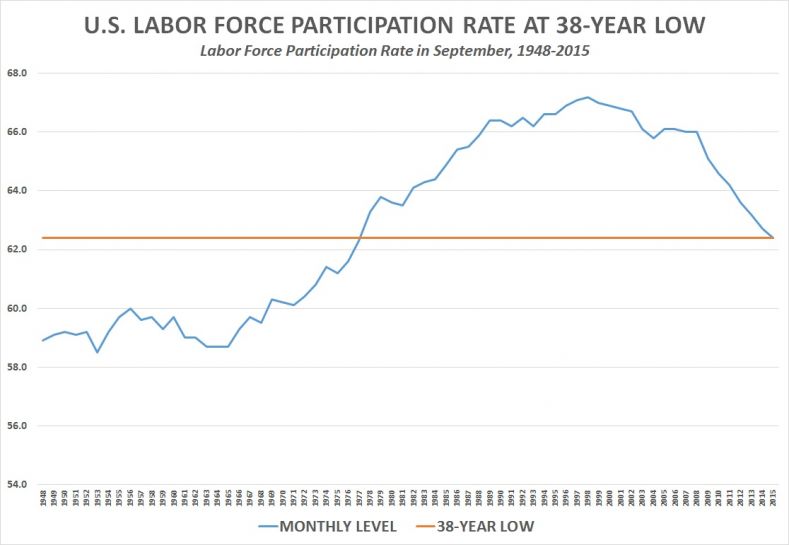
The US labor participation rate is the lowest it’s been since October 1977.

** After the worst recovery since World War II the US economy is moving towards recession.
CNS News reported:
A record 94,610,000 Americans were not in the American labor force last month — an increase of 579,000 from August — and the labor force participation rate reached its lowest point in 38 years, with 62.4 percent of the U.S. population either holding a job or actively seeking one.
In other disappointing news, the economy added only 142,000 jobs in September, well below economists’ expectations, but the unemployment rate remained at 5.1 percent, where it was in August…
…In September, according to the Labor Department’s Bureau of Labor Statistics, the nation’s civilian noninstitutional population, consisting of all people 16 or older who were not in the military or an institution, reached 251,325,000. Of those, 156,715,000 participated in the labor force by either holding a job or actively seeking one.
all of it here:
Obamanomics in Action: Worst Labor Force Participation Rate Since 1977 - The Gateway Pundit
Another good chart in the comment section with this article.
SNIP:
Obamanomics in Action: Worst Labor Force Participation Rate Since 1977
Jim Hoft Oct 2nd, 2015 9:49 am 20 Comments
Obamanomics in action–
The Obama economy added only 142,000 jobs in September – much lower than expected.
The US labor participation rate is the lowest it’s been since October 1977.
** After the worst recovery since World War II the US economy is moving towards recession.
CNS News reported:
A record 94,610,000 Americans were not in the American labor force last month — an increase of 579,000 from August — and the labor force participation rate reached its lowest point in 38 years, with 62.4 percent of the U.S. population either holding a job or actively seeking one.
In other disappointing news, the economy added only 142,000 jobs in September, well below economists’ expectations, but the unemployment rate remained at 5.1 percent, where it was in August…
…In September, according to the Labor Department’s Bureau of Labor Statistics, the nation’s civilian noninstitutional population, consisting of all people 16 or older who were not in the military or an institution, reached 251,325,000. Of those, 156,715,000 participated in the labor force by either holding a job or actively seeking one.
all of it here:
Obamanomics in Action: Worst Labor Force Participation Rate Since 1977 - The Gateway Pundit
 Real figures are use to determine recessions, not nominal figures.


