otto105
Diamond Member
- Sep 11, 2017
- 36,100
- 11,571
- 1,315
Decline of what?Why did he want to hide the decline?
It makes him sound dishonest.
That lie was debunked in my link.
Follow along with the video below to see how to install our site as a web app on your home screen.
Note: This feature may not be available in some browsers.
Decline of what?Why did he want to hide the decline?
It makes him sound dishonest.
He wasn’t referring to temperature denier.Why did he want to hide the decline?
It makes him sound dishonest.
He wasn’t referring to temperature denier.
Again, he wasn’t referring to temperature which denier fuckups had claimed.I know.
So why would he try to hide it?
Sounds dishonest.
Again, he wasn’t referring to temperature which denier fuckups had claimed.
Denier toddIt wasn't temperature.
Why would he try to hide the decline?
It sounds dishonest.
Why would Nobel Prize winner Michael Mann do anything dishonest?
Denier todd
What was he referring too? You seem to not know.
Why is that since you claim to have the emails.
Denier todd that answer is weak soup for you claimed knowledge of the emails.You know what he was referring to, so why did he want to hide it?
Was it because the science was on his side?
Michael Mann would never do anything dishonest, right?
He won the Nobel Prize, right?
Denier todd that answer is weak soup for you claimed knowledge of the emails.
Why is that?
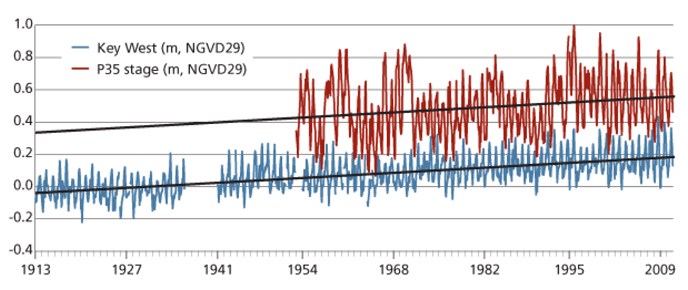
Hey genius. Very strange selection of data there, The first graph is NORMALIZED to data from 1983 - 2001 (where zero on that graph is the MEAN for that period) -- but it only shows the DATA until 1979???? Did you you question THAT? Where's the rest of the record?Storm surges have caused flooding, but not all surges are large enough to crest the shoreline. As sea level rises, surges that would not have caused flooding in the past, do so. That is simply the way this all works.
And apparently you missed some posts. The Plymouth Rock we have been shown was placed in 1921 and gets submerged in some high tides. Sea level in Plymouth Harbor has risen 1.5 feet since 1620.

This is trolling.
 Lemme help it get worse. You're all fearful of the modeling predictions. That''s why you change undies often. Here's one of your favorite FEAR PORN IPCC Sea Level graphs. TELL ME PLEASE if you see any indications of "acceleration" in SLRise in ANY of the data graphs that you pull up that LOOK LIKE THIS !!!!!
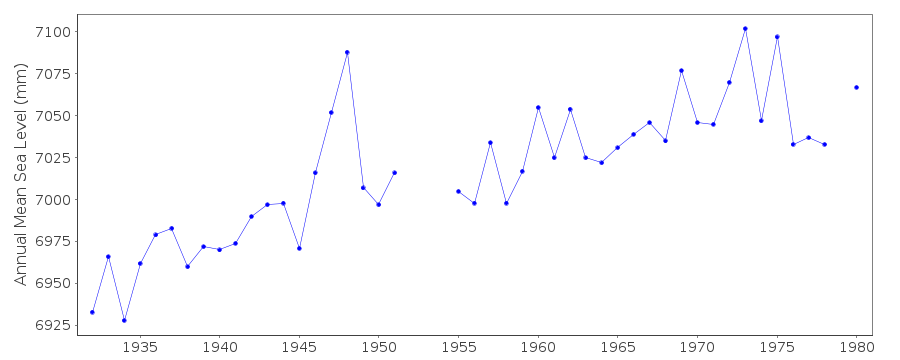
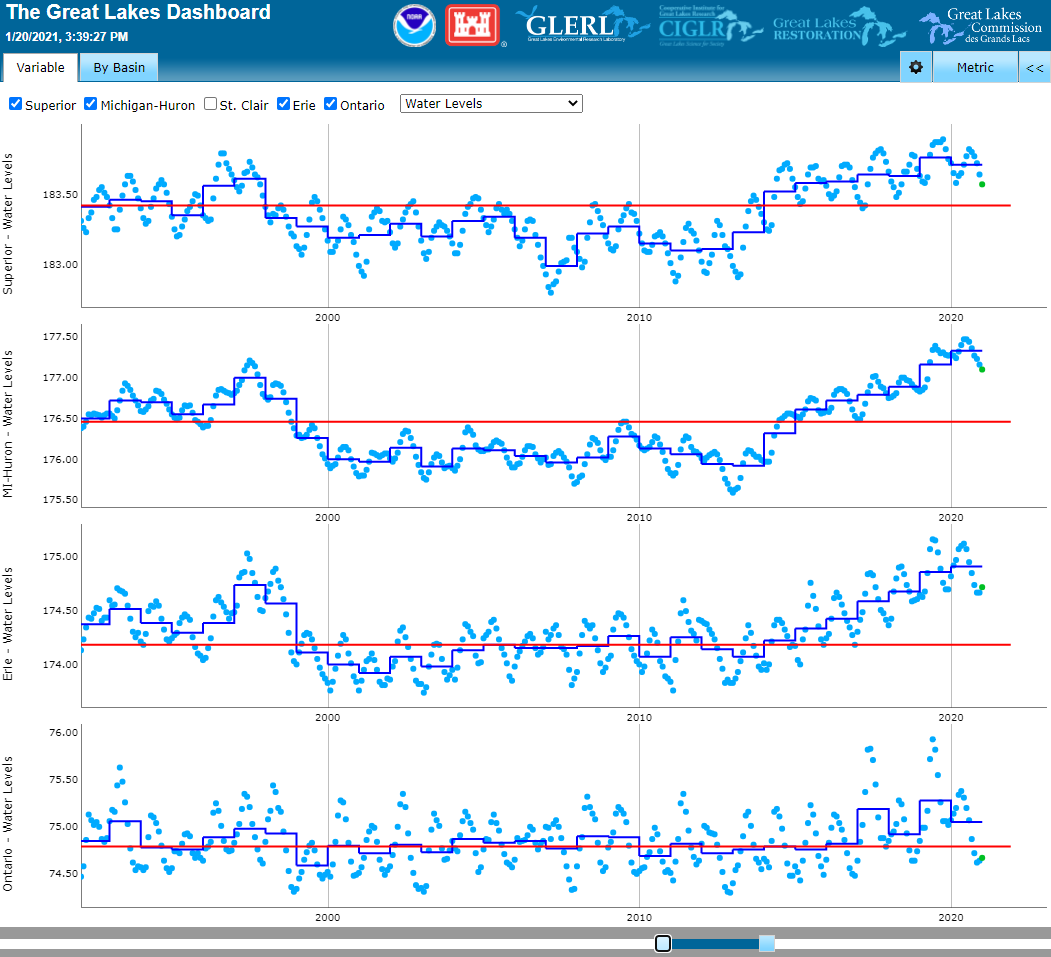
This is not a seasonal rise. The bulk of it is the lake's warming. But because sea levels have risen, the elevation drop of the St Lawrence River has fallen, slowing its flow rate.Interesting discussion dudes. Can either of you tell me why the dominant feature of these Great Lake graphs are CYCLICAL and PEAK in June and July reliably? When Crick says he "spends 1/2 the year there" if would MATTER which half of the year he's "eyeballing" the "sea level rise" in Lake Michigan. My guess is the FRESH WATER FLOW totally dominants any salt water influence from connections to the sea.
 www.glerl.noaa.gov
Why? The point of my post was to impeach his comment that seas have risen, the Great Lakes are connected and are low. That's all. How can one be one state and the other be another state and be connected. Crickster wants it both ways.Interesting discussion dudes. Can either of you tell me why the dominant feature of these Great Lake graphs are CYCLICAL and PEAK in June and July reliably? When Crick says he "spends 1/2 the year there" if would MATTER which half of the year he's "eyeballing" the "sea level rise" in Lake Michigan. My guess is the FRESH WATER FLOW totally dominants any salt water influence from connections to the sea.
They can be in different states far more easily than different portions of the world's oceans are in different states, which they are. The Great Lakes is a large mass of water with one connection to the oceans that flows in one direction. There are, of course, many different inputs to the lakes, so it is a complex system.Why? The point of my post was to impeach his comment that seas have risen, the Great Lakes are connected and are low. That's all. How can one be one state and the other be another state and be connected. Crickster wants it both ways.
Good thing we get rain in the summer huh?
Are you still arguing that the Great Lakes are high?They can be in different states far more easily than different portions of the world's oceans are in different states, which they are. The Great Lakes is a large mass of water with one connection to the oceans that flows in one direction. There are, of course, many different inputs to the lakes, so it is a complex system.
But I see here that you reject the fact that global sea level has risen. That is an interesting position. What basis do you have for it?
They can be in different states far more easily than different portions of the world's oceans are in different states, which they are. The Great Lakes is a large mass of water with one connection to the oceans that flows in one direction. There are, of course, many different inputs to the lakes, so it is a complex system.
But I see here that you reject the fact that global sea level has risen. That is an interesting position. What basis do you have for it?
 www.marinadockage.com
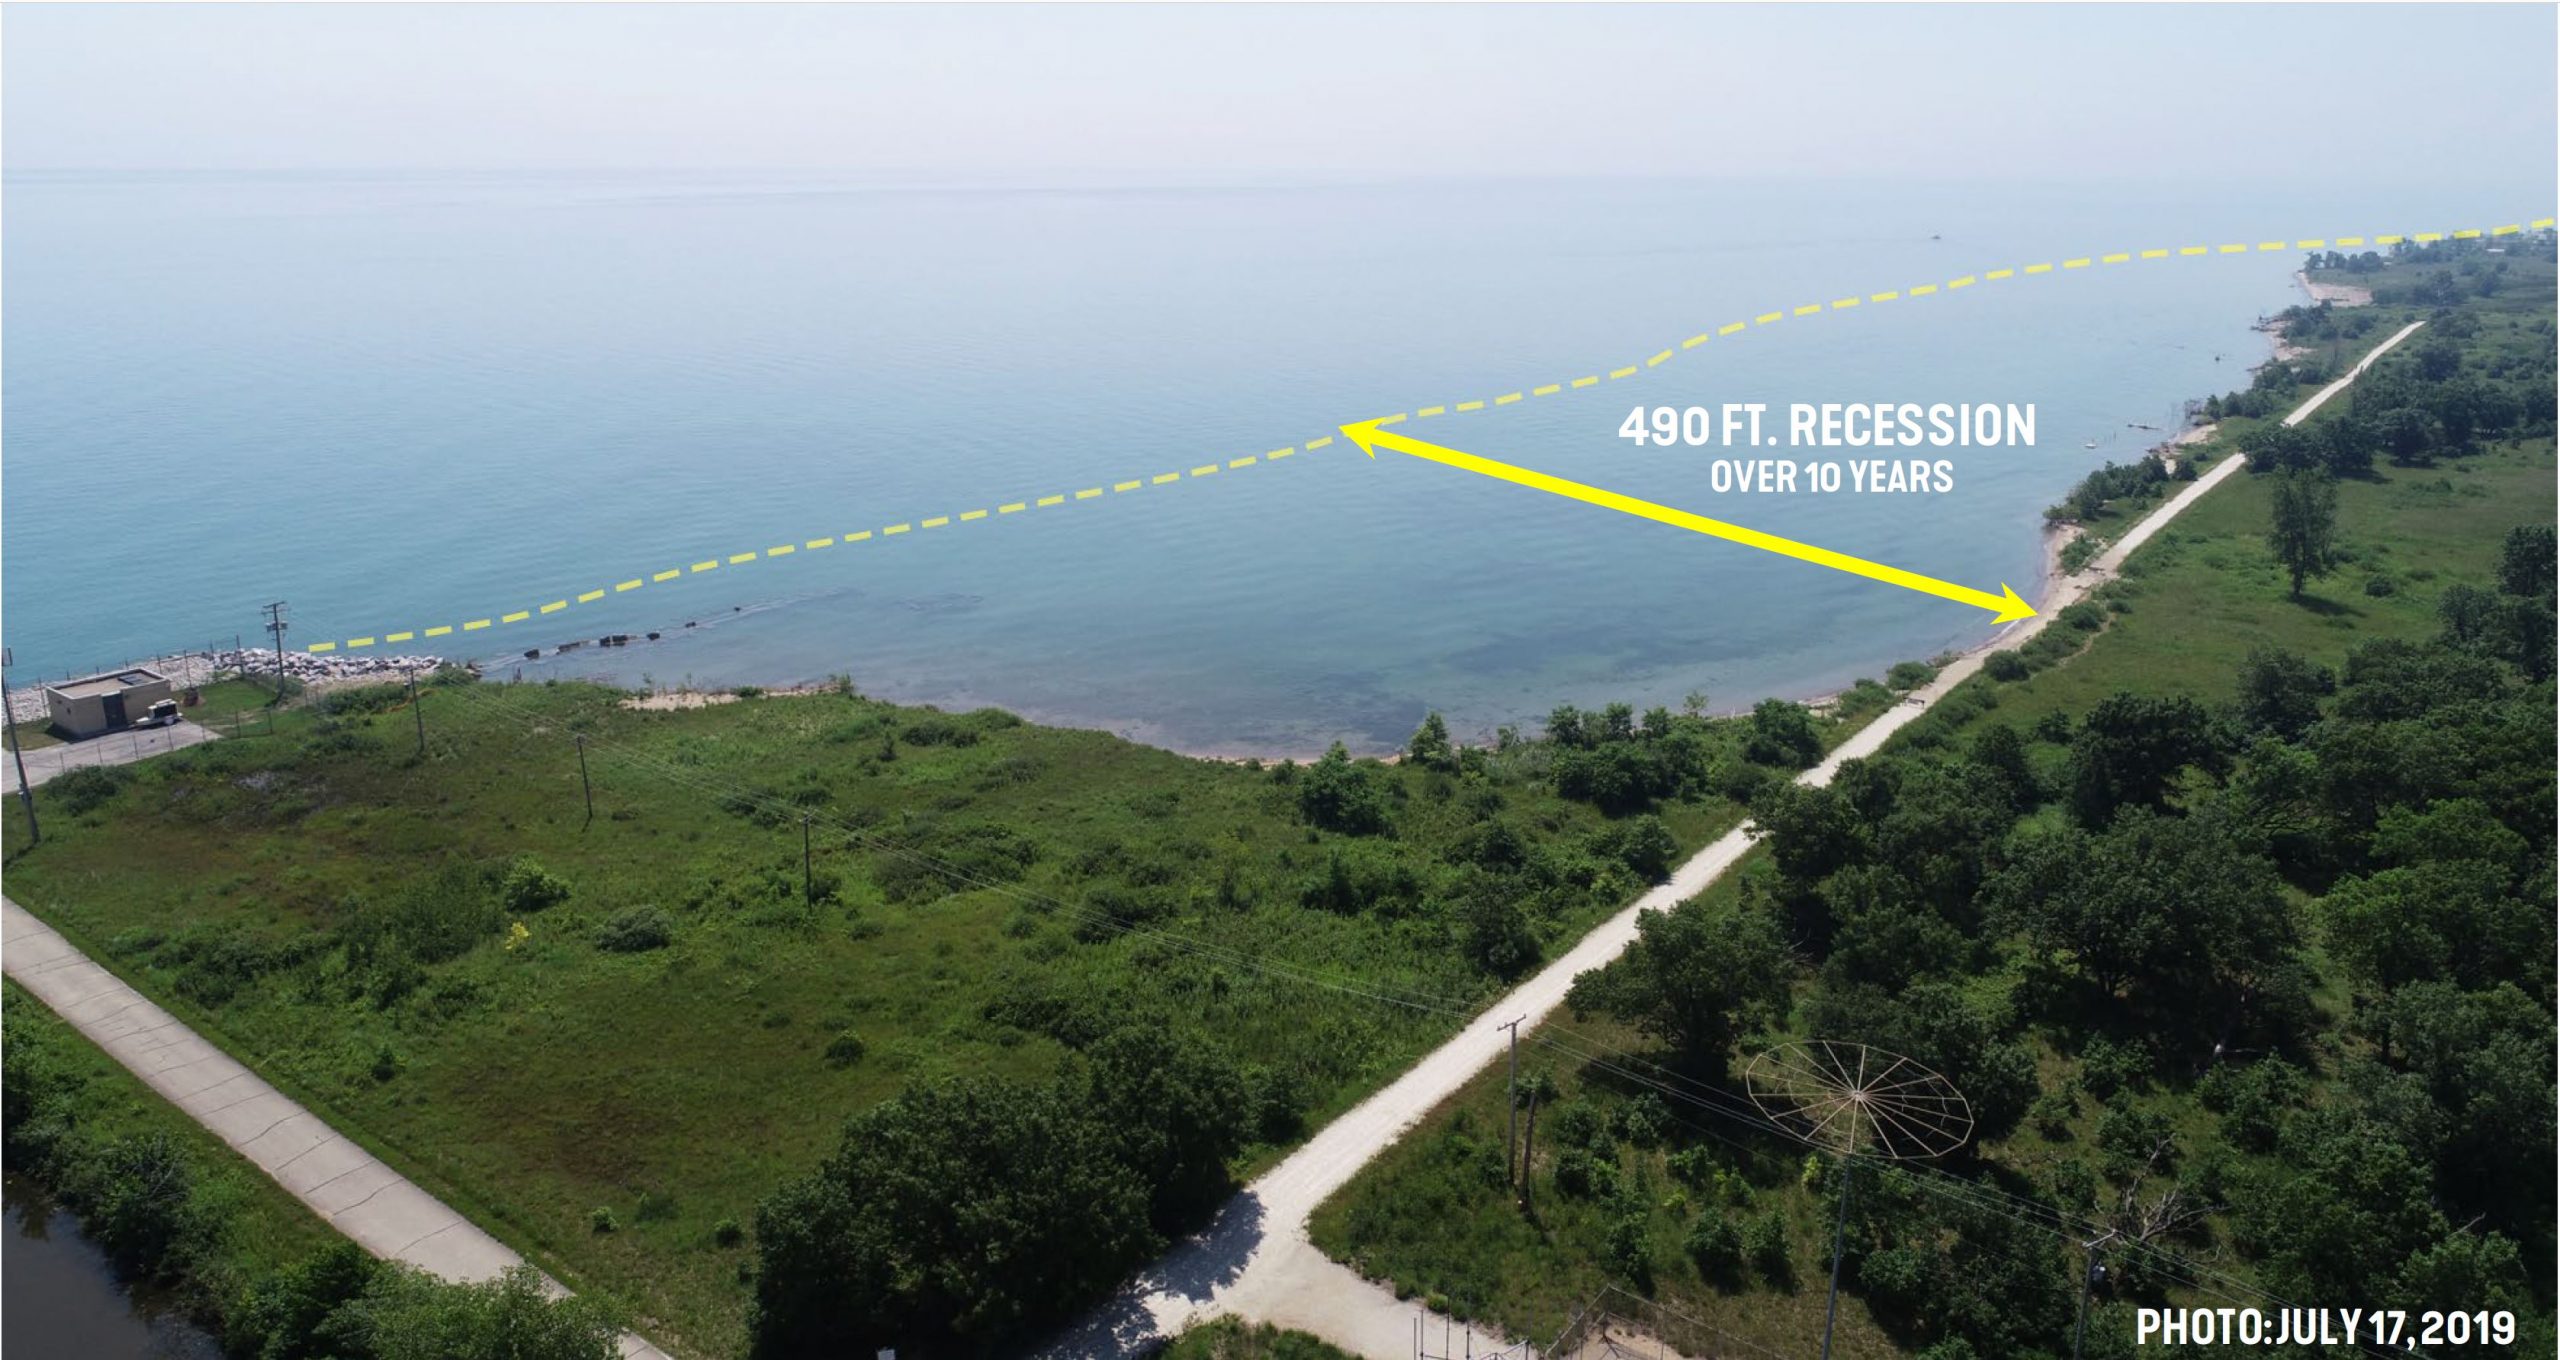
Well, you have prompted me to dig deeper. I had been taking the work of local Wisconsin news. It appears that the Great Lakes have NOT risen with the oceans. I was wrong. Have fun with that.Lessons in Sea-Level Change Impacts from the Great Lakes | Marina Dock Age
Understanding the impacts to the Fresh Coast in the Great Lakes communities from record-high water levels and 100 year storms
Lake water levels also change at various scales of time, including a semidiurnal (twice-a-day) tide. While a Great Lakes tide is only about two-inches, wind and atmospheric pressure can cause a water-level change of several feet known as seiche: an oscillation wave with a duration of several hours that is often confused with a tide. There are also epochal changes in lake levels associated with larger climatic patterns such as La Niña/El Niño, Polar vortices, and other climate phenomena, producing variations in water levels that can last several months.
Understanding the Problems
Official water level records have been kept for the Great Lakes since 1860, recording the monthly mean. In 1970, the recording of hourly levels started, and in 1996 6-minute mean measurements were added. During 2019 and 2020, all five lakes set their record highs – which was even more remarkable given their quick rebound from near historic lows in 2012.
Not at all. I am not about anything but facts. When people use bad facts, I point it out and try to encourage research. I appreciate the honesty. Shows you have some integrity.Well, you have prompted me to dig deeper. I had been taking the work of local Wisconsin news. It appears that the Great Lakes have NOT risen with the oceans. I was wrong. Have fun with that.
why would they increase? no ice melting off any continent to make more than mm of change. Plymouth rock, still exposed.But I see here that you reject the fact that global sea level has risen. That is an interesting position. What basis do you have for it?