Indeependent
Diamond Member
- Nov 19, 2013
- 73,633
- 28,506
- 2,250
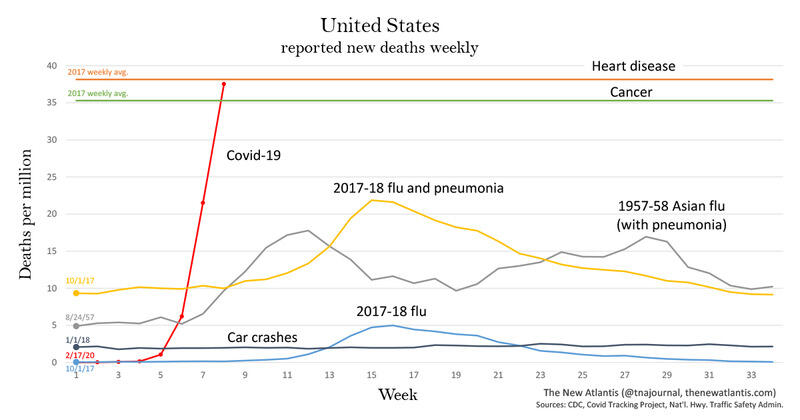
The damage is occurring to people who already have damage.It took pneumonia & flu a year to kill as many as covid did in it's first month. Covid is also permanently damaging internal organs of 14% of infected.
A friend of mine with MS just died yesterday from C19 complications.