Navigation
Install the app
How to install the app on iOS
Follow along with the video below to see how to install our site as a web app on your home screen.
Note: This feature may not be available in some browsers.
More options
You are using an out of date browser. It may not display this or other websites correctly.
You should upgrade or use an alternative browser.
You should upgrade or use an alternative browser.
Global Warming is such Wooly Mammoth Crap.
- Thread starter Mikeoxenormous
- Start date
You better tell them to move, Taz.Coastal and low-lying areas are already in trouble. You need to get a fucking clue. Quickly.I think you got that backwards, my little trolling friendBecause last time whatever changes were brought upon the earth's climate was done when there weren't any humans polluting the place even more. Sheesh, you're slow.And that changes it how?Except that the last time, there weren't 7 billion little pollution factories and all their gear stinking up the joint.No. The same polar configurations conducive to an icehouse planet. Land mass centered over the south pole and land locked north pole. Basically both poles are isolated from the warmer marine currents.
The sky isn't falling. Relax.

Relax. It's going to be ok, bro.

ChesBayJJ
Diamond Member
I got one of those too but it's a little more fancy. It actually makes predictions based upon the existing trend. Does yours do that too?
View attachment 166974
View attachment 166976

My chart is just historic data. No predictions. Only thing to say is CO2 is increasing at historically high rates and is well above any level measured (ice cores, etc) over the past 400,000 years or so. I will leave discussions of the import of all of this to the atmospheric scientists. It is basically a response to your comment about the impact of humankind. Lots more CO2 in the atmosphere.
And I need to depart for now.

Actually... the vast majority of CO2 is stored in the ocean. Which is why when it gets colder CO2 is drawn down out of the atmosphere and stored in the oceans and when it gets warmer CO2 is released from the oceans into the atmosphere.I got one of those too but it's a little more fancy. It actually makes predictions based upon the existing trend. Does yours do that too?
View attachment 166974
View attachment 166976
My chart is just historic data. No predictions. Only thing to say is CO2 is increasing at historically high rates and is well above any level measured (ice cores, etc) over the past 400,000 years or so. I will leave discussions of the import of all of this to the atmospheric scientists. It is basically a response to your comment about the impact of humankind. Lots more CO2 in the atmosphere.
Do a material balance and you'll see just how insignificant man's contributions to the carbon cycle really are.
SSDD
Gold Member
- Nov 6, 2012
- 16,672
- 1,966
- 280
I got one of those too but it's a little more fancy. It actually makes predictions based upon the existing trend. Does yours do that too?
View attachment 166974
View attachment 166976
My chart is just historic data. No predictions. Only thing to say is CO2 is increasing at historically high rates and is well above any level measured (ice cores, etc) over the past 400,000 years or so. I will leave discussions of the import of all of this to the atmospheric scientists. It is basically a response to your comment about the impact of humankind. Lots more CO2 in the atmosphere.
And I need to depart for now.
You are overlooking, or entirely unaware of a glaring problem with your assumption...for the past 400,000 years, the earth has been in an ice age...for far longer than that actually, but that is beside the point...if you go back to the point where the present ice age began, atmospheric CO2 was around 1000ppm....cold water holds much more CO2 than warm water...as the earth as warmed, the oceans have been releasing CO2...but the fact remains that when the earth began decending into the present ice age, atmospheric CO2 levels were about 1000ppm...more than twice the amount we are seeing...and ice ages have began with CO2 levels several times higher than that 1000ppm mark. The simple fact is that CO2 doesn't cause warming except in failing cliamate models.
SSDD
Gold Member
- Nov 6, 2012
- 16,672
- 1,966
- 280
Do a material balance and you'll see just how insignificant man's contributions to the carbon cycle really are.
Recent papers have seriously questioned whether we are actually having any real influence on the earth's CO2 levels at all. The empirical evidence suggests not.
https://www.researchgate.net/public...SPHERIC_CO2_TO_ANTHROPOGENIC_EMISSIONS_A_NOTE
Clip: “A necessary condition for the theory of anthropogenic global warming is that there should be a close correlation between annual fluctuations of atmospheric CO2 and the annual rate of anthropogenic CO2 emissions.Data on atmospheric CO2 and anthropogenic emissions provided by the Mauna Loa measuring station and the CDIAC in the period 1959-2011 were studied using detrended correlation analysis to determine whether, net of their common long term upward trends, the rate of change in atmospheric CO2 is responsive to the rate of anthropogenic emissions in a shorter time scale from year to year. … [R]esults do not indicate a measurable year to year effect of annual anthropogenic emissions on the annual rate of CO2 accumulation in the atmosphere."
https://www.researchgate.net/public...spheric_carbon_dioxide_and_global_temperature
Clip: Conclusion:
“There exist a clear phase relationship between changes of atmospheric CO2 and the different global temperature records, whetherrepresenting sea surface temperature, surface air temperature, or lower troposphere temperature, with changes in the amount of atmospheric CO2 always lagging behind corresponding changes in temperature.”
(1) The overall global temperature change sequence of events appears to be from 1) the ocean surface to 2) the land surface to 3) the lower troposphere.
(2) Changes in global atmospheric CO2 are lagging about 11–12 months behind changes in global sea surface temperature.
(3) Changes in global atmospheric CO2 are lagging 9.5–10 months behind changes in global air surface temperature.
(4) Changes in global atmospheric CO2 are lagging about 9 months behind changes in global lower troposphere temperature.
(5) Changes in ocean temperatures appear to explain a substantial part of the observed changes in atmospheric CO2 since January 1980.
(6) CO2 released from anthropogenic sources apparently has little influence on the observed changes in atmospheric CO2, and changes in atmospheric CO2 are not tracking changes in human emissions.
(7) On the time scale investigated, the overriding effect of large volcanic eruptions appears to be a reduction of atmospheric CO2, presumably due to the dominance of associated cooling effects from clouds associated with volcanic gases/aerosols and volcanic debris.
(8) Since at least 1980 changes in global temperature, and presumably especially southern ocean temperature, appear to represent a major control on changes in atmospheric CO2.
SAGE Journals: Your gateway to world-class journal research
Clip: “[T]he warming and cooling of the ocean waters control how much CO2 is exchanged with atmosphere and thereby controlling the concentration of atmospheric CO2. It is obvious that when the oceans are cooled, in this case due to volcanic eruptions or La Niña events, they release less CO2 and when it was an extremely warm year, due to an El Niño, the oceans release more CO2. [D]uring the measured time 1979 to 2006 there has been a continued natural increase in temperature causing a continued increase of CO2 released into the atmosphere. This implies that temperature variations caused by El Niños, La Niñas, volcanic eruptions, varying cloud formations and ultimately the varying solar irradiation control the amount of CO2 which is leaving or being absorbed by the oceans.”
And older work suggests the same thing:
https://www2.meteo.uni-bonn.de/bibliothek/Flohn_Publikationen/K287-K320_1981-1985/K299.pdf
clip: “The recent increase of the CO2-content of air varies distinctly from year to year, rather independent from the irregular annual increase of global CO2-production from fossil fuel and cement, which has since 1973 decreased from about 4.5 percent to 2.25 percent per year (Rotty 1981).”
“Comparative investigations (Keeling and Bacastow 1977, Newll et al. 1978, Angell 1981) found a positive correlation between the rate of increase of atmospheric CO2 and the fluctuations of sea surface temperature (SST) in the equatorial Pacific, which are caused by rather abrupt changes between upwelling cool water and downwelling warm water (“El Niño”) in the eastern equatorial Pacific. Indeed the cool upwelling water is not only rich in (anorganic) CO2 but also in nutrients and organisms. (algae) which consume much atmospheric CO2 in organic form, thus reducing the increase in atmospehreic CO2. Conversely the warm water of tropical oceans, with SST near 27°C, is barren, thus leading to a reduction of CO2 uptake by the ocean and greater increase of the CO2. … A crude estimate of these differences is demonstrated by the fact that during the period 1958-1974, the average CO2-increase within five selective years with prevailing cool water only 0.57 ppm/a [per year], while during five years with prevailing warm water it was 1.11 ppm/a. Thus in a a warm water year, more than one Gt (1015 g) carbon is additionally injected into the atmosphere, in comparison to a cold water year.”
Taz
Gold Member
- Jul 8, 2014
- 22,876
- 2,119
- 190
- Banned
- #288
It's already not ok.You better tell them to move, Taz.Coastal and low-lying areas are already in trouble. You need to get a fucking clue. Quickly.I think you got that backwards, my little trolling friendBecause last time whatever changes were brought upon the earth's climate was done when there weren't any humans polluting the place even more. Sheesh, you're slow.And that changes it how?Except that the last time, there weren't 7 billion little pollution factories and all their gear stinking up the joint.
The sky isn't falling. Relax.
Relax. It's going to be ok, bro.
No different than it's ever been.It's already not ok.You better tell them to move, Taz.Coastal and low-lying areas are already in trouble. You need to get a fucking clue. Quickly.I think you got that backwards, my little trolling friendBecause last time whatever changes were brought upon the earth's climate was done when there weren't any humans polluting the place even more. Sheesh, you're slow.And that changes it how?
The sky isn't falling. Relax.
Relax. It's going to be ok, bro.
Why would you care any way? You won't live forever.
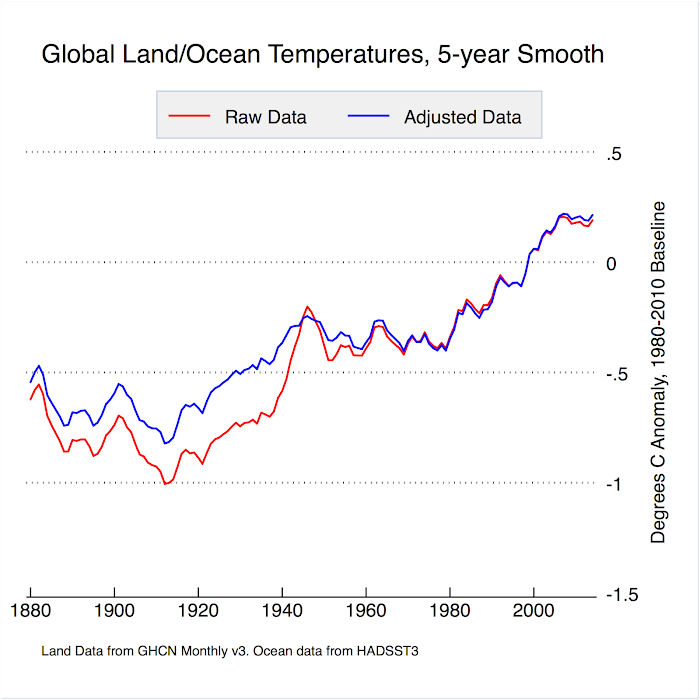
Ian, old chap, you are losing it. Were they to adjust data to support increasing global warming, they would have made the older data cooler so as to show a larger warming. What they did was review the data, and adjust it for what they found in the review.Yes, yes, 95% of Climate scientist are getting it wrong, but you can read a graph, you think. Got it.
Those who are familiar with the science know that the total adjustments have, by making the past look much warmer, made the current warming look much smaller. That's not debatable, and that means Ian's crank conspiracy theory goes into the shitcan. Not that Ian will care. He's a true believer. His cult tells him to believe, so like every other denier here he'll keep cherrypicking his heart out until reality matches his dogma. He's not as dumb as the other deniers, but he is just as fanatical and brainwashed
The denier cult is based entirely on faking data. Fraud is what deniers do. It's all deniers do. If a denier says something, experience shows one should initially assume it's a lie, unless independent evidence indicates otherwise.
<data:blog.pageTitle/>
The thing you have to remember about mamooth is that he is a shyster. Three card monte, pea under the thimble, a huckster.
He tries to convince us that all adjustments are suitable because ONE large sea surface temperature correction went in the opposite direction. He wants us to ignore all the other adjustments since then.
In the 90s they just couldn't get the climate models to work with raw sea surface data so they made a large correction to compensate for going from canvas buckets to water intakes. A necessary but still discretionary adjustment.
Land surface station coverage is poor, especially before, say, 1950. But sea surface coverage is pathetic to non-existent for that period.
The poo flinging monkey likes to put up this graph as proof-
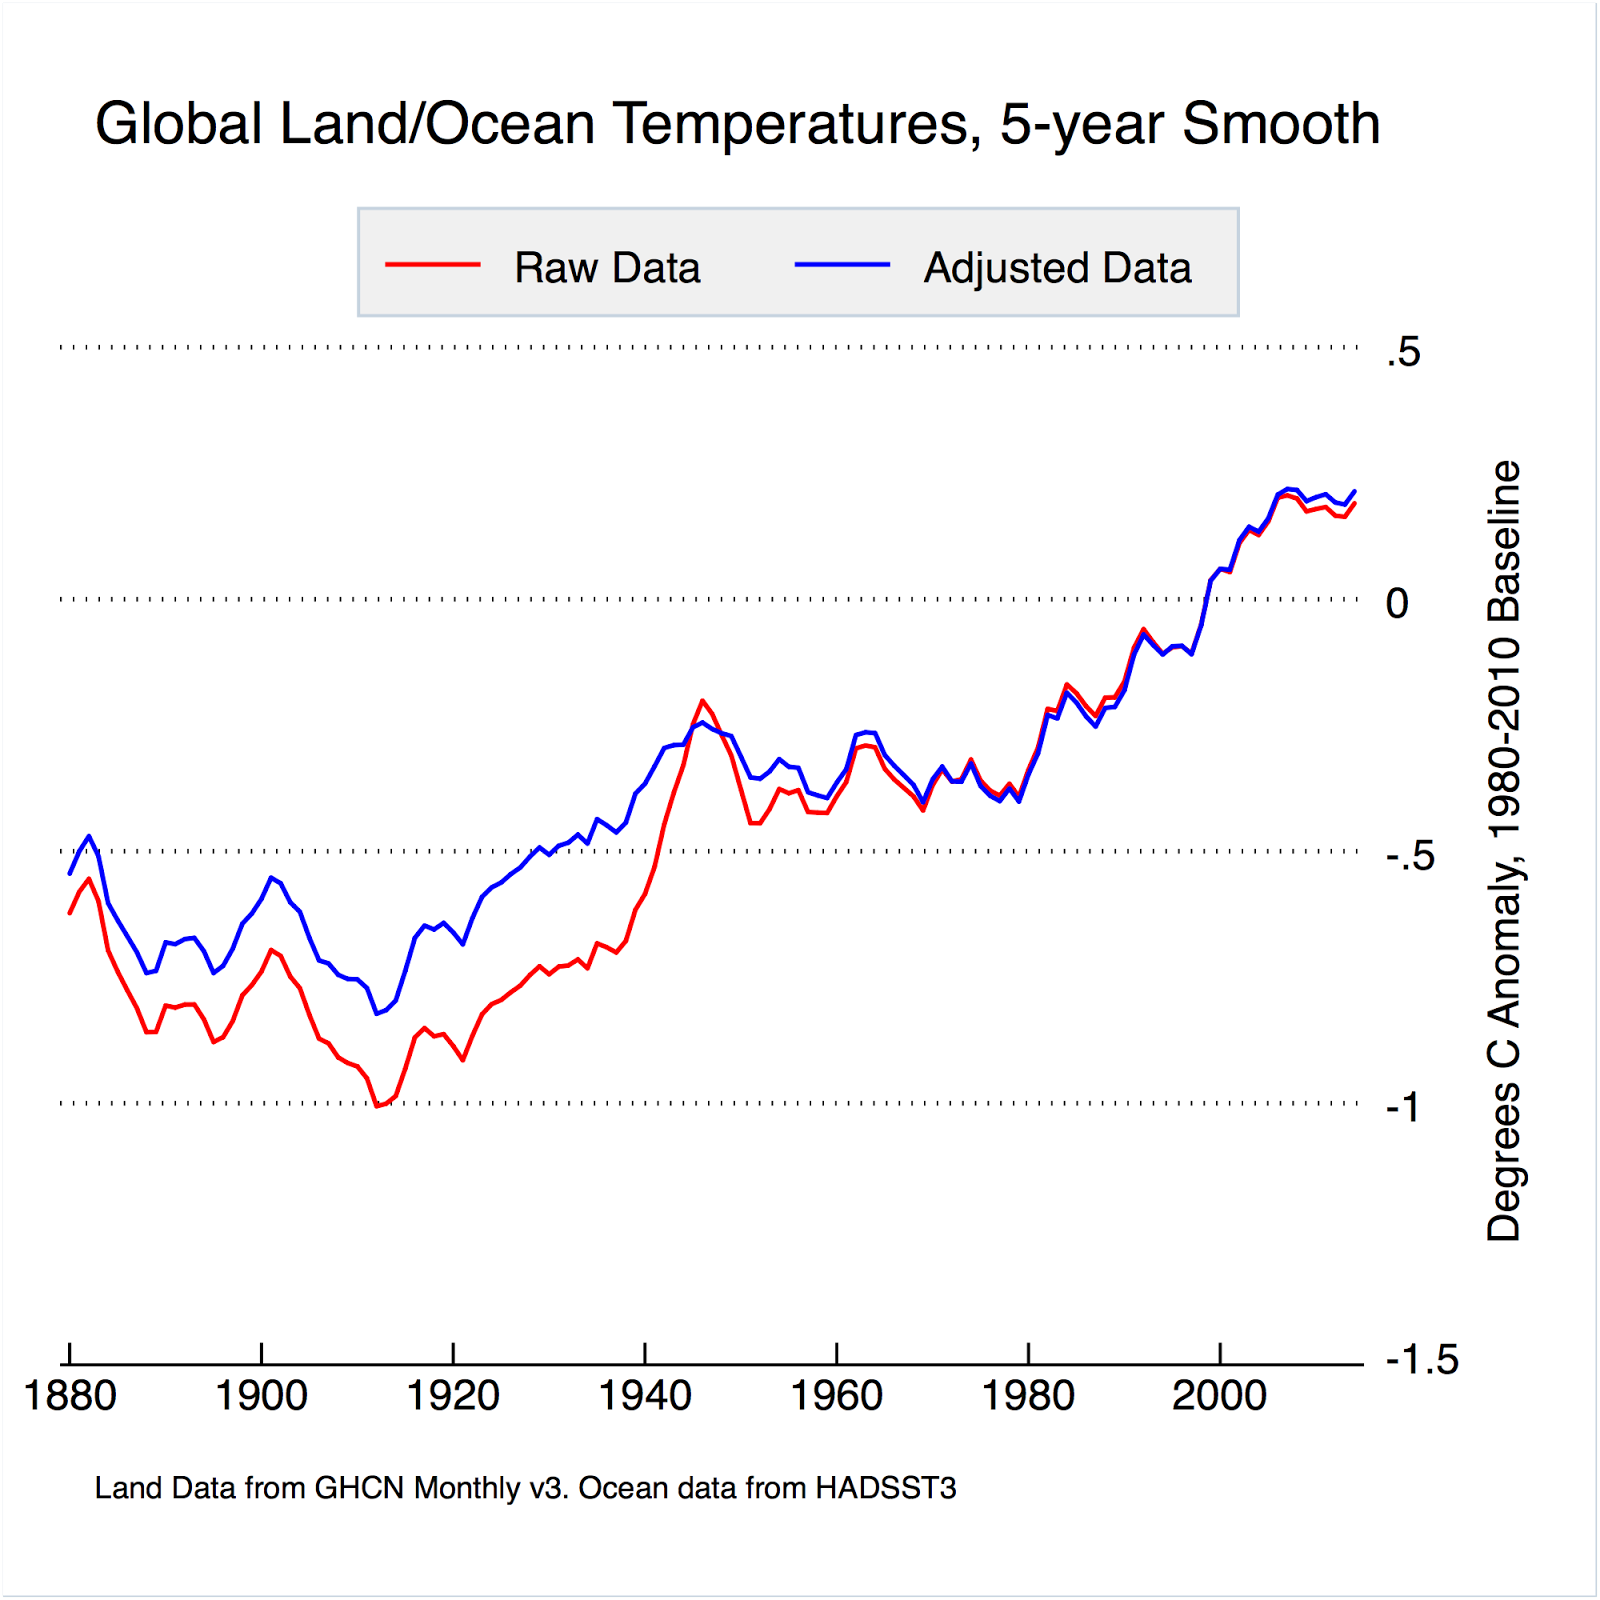
What does this graph imply? That post 1950 readings have hardly been adjusted, and that pre 1950 readings have been warmed. Say what????? That can't be right!
How the hell did they pull that off? Have you figured it out? Kept track of the pea under the thimble? Figured out which card is the queen of spades? Hahahaha.
Hahahaha. I already told you that the models they wanted to use were incompatible with the raw figures for sea surface temperature. They had to get them to align better with land temperatures. So they did, with a large adjustment for the change in measurement method.
Land temperatures are more volatile than water temperatures but the land can only get a certain amount out of sync before the greater heat capacity of the oceans brings them back to reflect what the oceans are doing. The same can be said for the atmosphere.
So what did I mean when I asked if you were keeping your eye on the pea under one of the three thimbles?
I could have been more direct and simply asked what was happening to land temperatures while the sea surface readings we're being cranked up. But what is the fun in that?
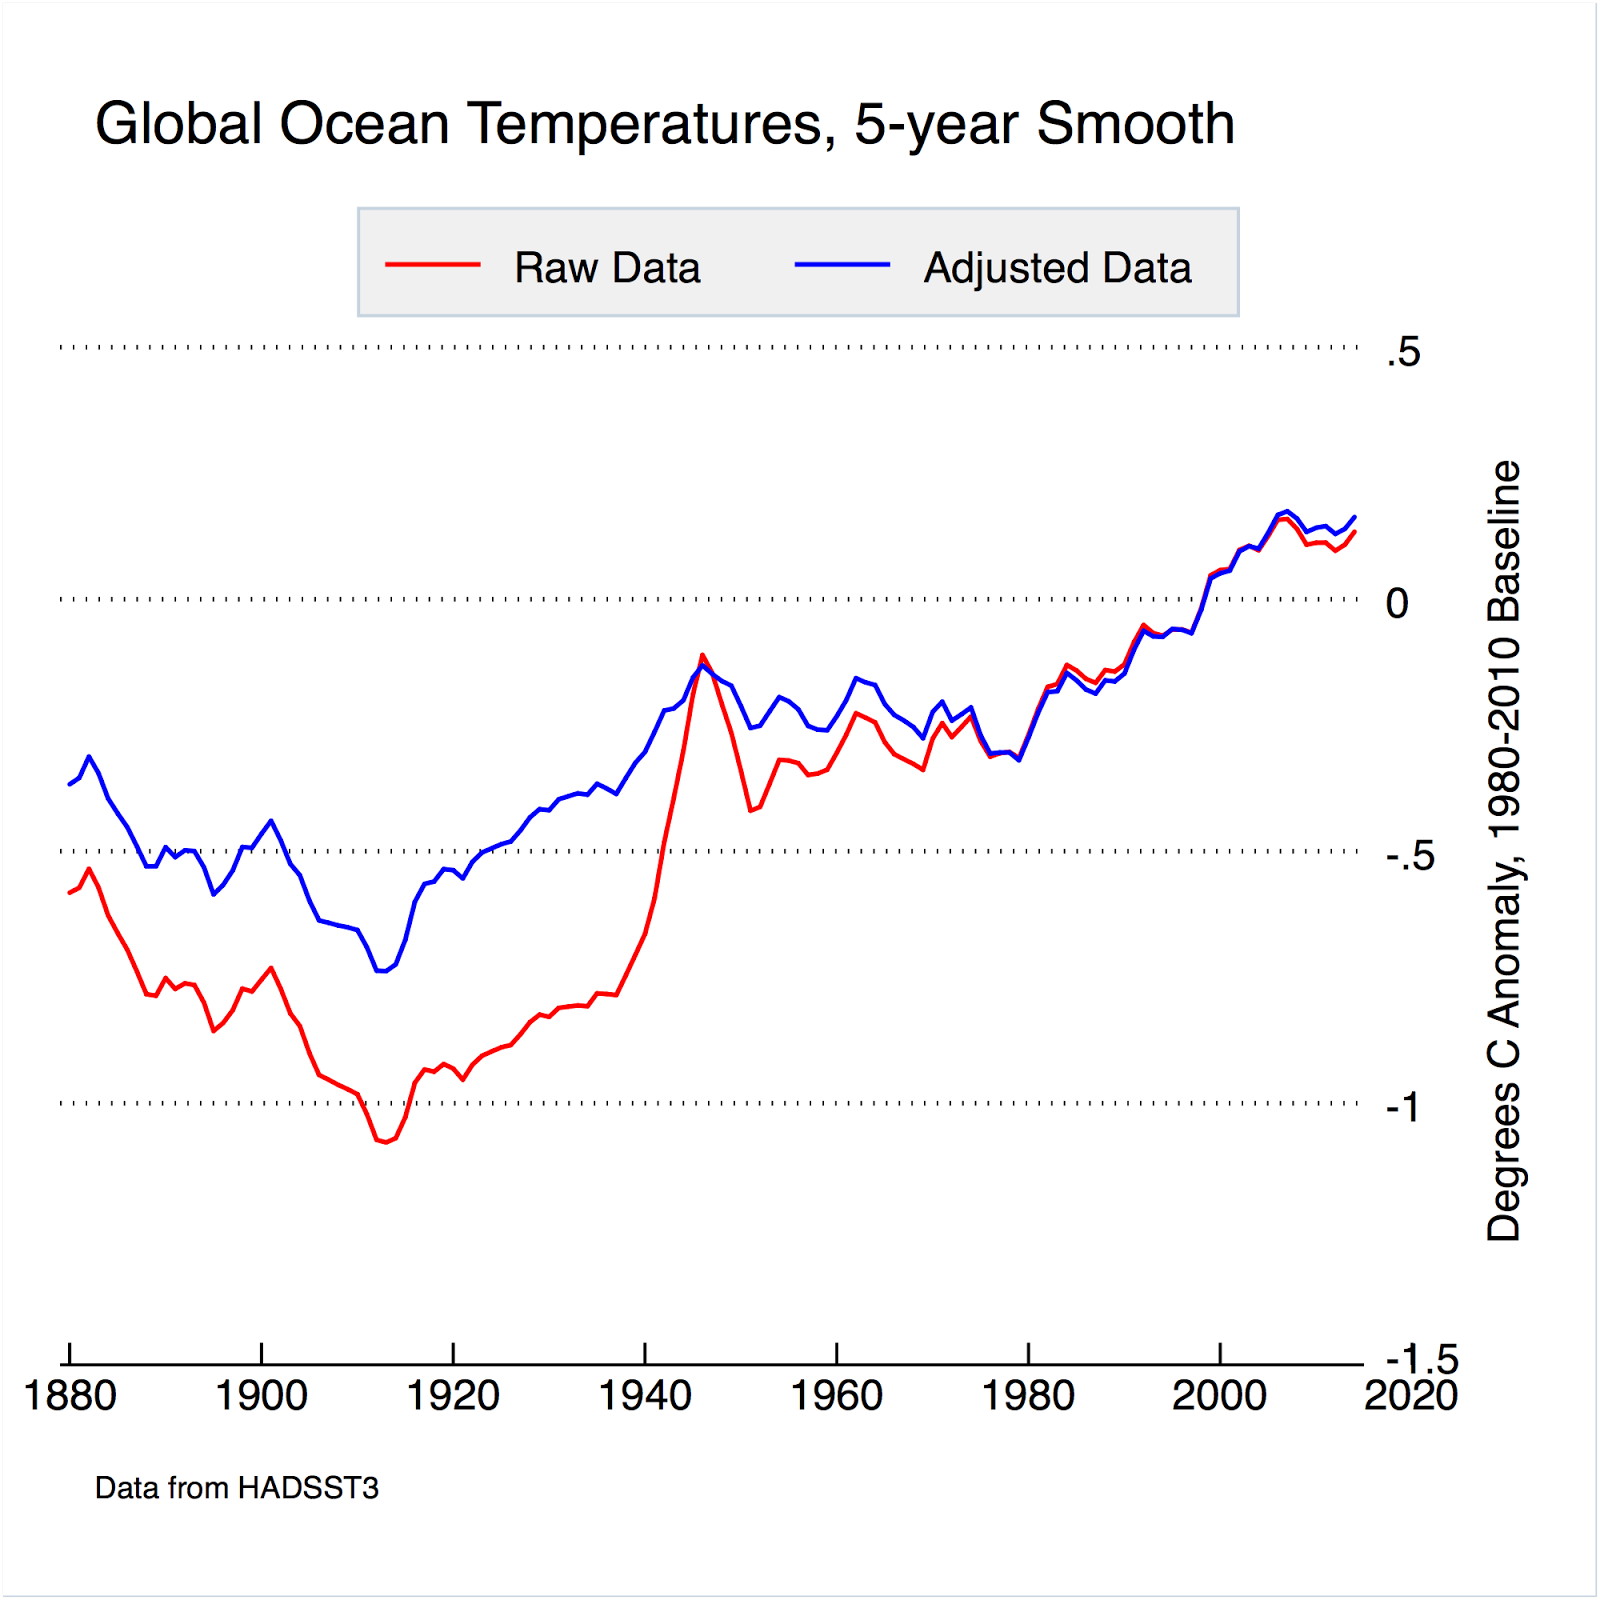

!!! Ocean temps were massively adjusted up and land temps were only hugely adjusted down! This put the land and ocean temperatures into a relationship that could now be explained by AGW modeling.
I could go on and on. What happens if you normalize the graph so that the temperatures are equal at the beginning of the graph instead of the end? And what about the maturity graphs that show cooling off the past and warming of the recent? That's in just ten years of constantly changing adjustments from 2008. The main large adjustments had ALREADY been made by 2008!
Don't even get me started on homogenization.
Why do some of the warmers here say that a big (and necessary) adjustment to sea surface temperatures is proof that the myriad of past and present adjustments to land data are legitimate? Does that one adjustment also prove the more recent adjustments to ocean temperatures are justified as well?
Why does the decision to make one adjustment mean that every adjustment is correct (at least until the next set of adjustments are made).
mamooth
Diamond Member
Why do some of the warmers here say that a big (and necessary) adjustment to sea surface temperatures
Interesting. Before, you implied it was all a big fudge so they were forced to use to match the sucky models. Now you're saying it's good science. Oh well. At least you arrived at reality, so the path you took isn't important.
is proof that the myriad of past and present adjustments to land data are legitimate?
No, nobody said or implied that. That's your strawman.
Does that one adjustment also prove the more recent adjustments to ocean temperatures are justified as well?
No. It just proves your conspiracy theory makes no sense. Why adjust output a tiny bit one way if you adjust them massively the other way? Since your conspiracy theory is all you had, that leaves you with nothing.
If you want to be taken seriously, go down the types of adjustments one by one, and tell us why they're unjustified.
ChesBayJJ
Diamond Member
I got one of those too but it's a little more fancy. It actually makes predictions based upon the existing trend. Does yours do that too?
View attachment 166974
View attachment 166976
My chart is just historic data. No predictions. Only thing to say is CO2 is increasing at historically high rates and is well above any level measured (ice cores, etc) over the past 400,000 years or so. I will leave discussions of the import of all of this to the atmospheric scientists. It is basically a response to your comment about the impact of humankind. Lots more CO2 in the atmosphere.
And I need to depart for now.
You are overlooking, or entirely unaware of a glaring problem with your assumption...for the past 400,000 years, the earth has been in an ice age...for far longer than that actually, but that is beside the point...if you go back to the point where the present ice age began, atmospheric CO2 was around 1000ppm....cold water holds much more CO2 than warm water...as the earth as warmed, the oceans have been releasing CO2...but the fact remains that when the earth began decending into the present ice age, atmospheric CO2 levels were about 1000ppm...more than twice the amount we are seeing...and ice ages have began with CO2 levels several times higher than that 1000ppm mark. The simple fact is that CO2 doesn't cause warming except in failing cliamate models.
Link please. Something to support the 1000ppm claim.
And it is basic physics, an undeniable fact, CO2 passes visible radiation, absorbs longer wave radiation, and stores thermal energy. It is a greenhouse gas.
Taz
Gold Member
- Jul 8, 2014
- 22,876
- 2,119
- 190
- Banned
- #293
I have children and care about leaving them a shithole, unlike you.No different than it's ever been.It's already not ok.You better tell them to move, Taz.Coastal and low-lying areas are already in trouble. You need to get a fucking clue. Quickly.I think you got that backwards, my little trolling friendBecause last time whatever changes were brought upon the earth's climate was done when there weren't any humans polluting the place even more. Sheesh, you're slow.
The sky isn't falling. Relax.
Relax. It's going to be ok, bro.
Why would you care any way? You won't live forever.
ChesBayJJ
Diamond Member
Good read on historic CO2 levels
Carbon Dioxide Through Time | EARTH 103: Earth in the Future
Bottom line? More CO2 = warmer earth = less ice = higher sea levels
Carbon Dioxide Through Time | EARTH 103: Earth in the Future
Bottom line? More CO2 = warmer earth = less ice = higher sea levels
Interesting. Before, you implied it was all a big fudge so they were forced to use to match the sucky models. Now you're saying it's good science. Oh well. At least you arrived at reality, so the path you took isn't important.
I actually said that ocean temps and land temps (and atmospheric temps) are correlated, and that they must stay within a certain range of each other.
There was no move to 'fix' ocean temps until the models were found to be unable to replicate the ocean warming.
I'm not sure if that's good science, bad science or self serving science.
No. It just proves your conspiracy theory makes no sense. Why adjust output a tiny bit one way if you adjust them massively the other way? Since your conspiracy theory is all you had, that leaves you with nothing
The land temps were also heavily adjusted, in the opposite direction. Ocean temps are also now being adjusted to cool the past and warm the recent, as evidenced by the Karl pausebuster paper.
In past threads I have discussed the methodology of Berkeley BEST, and shown how it must add extra warming if temps are in general rising (it would add extra cooling if the trend had been cooling).
I am no conspiracy theorist, I am an interested layman who notices a lot of contradictory statements being made and a lot of exaggerated conclusions that are not supported by the evidence supplied.
SSDD
Gold Member
- Nov 6, 2012
- 16,672
- 1,966
- 280
I got one of those too but it's a little more fancy. It actually makes predictions based upon the existing trend. Does yours do that too?
View attachment 166974
View attachment 166976
My chart is just historic data. No predictions. Only thing to say is CO2 is increasing at historically high rates and is well above any level measured (ice cores, etc) over the past 400,000 years or so. I will leave discussions of the import of all of this to the atmospheric scientists. It is basically a response to your comment about the impact of humankind. Lots more CO2 in the atmosphere.
And I need to depart for now.
You are overlooking, or entirely unaware of a glaring problem with your assumption...for the past 400,000 years, the earth has been in an ice age...for far longer than that actually, but that is beside the point...if you go back to the point where the present ice age began, atmospheric CO2 was around 1000ppm....cold water holds much more CO2 than warm water...as the earth as warmed, the oceans have been releasing CO2...but the fact remains that when the earth began decending into the present ice age, atmospheric CO2 levels were about 1000ppm...more than twice the amount we are seeing...and ice ages have began with CO2 levels several times higher than that 1000ppm mark. The simple fact is that CO2 doesn't cause warming except in failing cliamate models.
Link please. Something to support the 1000ppm claim.
And it is basic physics, an undeniable fact, CO2 passes visible radiation, absorbs longer wave radiation, and stores thermal energy. It is a greenhouse gas.
Sorry guy, CO2 does not store energy at atmospheric temperatures...cool it to the point that it becomes liquid or solid, and it can store energy..but not in its gaseous form. Your facts aren't. And can you offer up any evidence whatsoever that absorption and emission equals warming? Or can you provide a single real world measurement that establishes a coherent link between the absorption and emission of IR by a gas and warming in the atmosphere.

SSDD
Gold Member
- Nov 6, 2012
- 16,672
- 1,966
- 280
Good read on historic CO2 levels
Carbon Dioxide Through Time | EARTH 103: Earth in the Future
Bottom line? More CO2 = warmer earth = less ice = higher sea levels
Every ice core ever done shows us that CO2 lags temperature increases...CO2 is the result of warmer temperatures, not the cause. Warmer oceans outgas C02..cold oceans take in CO2.
ChesBayJJ
Diamond Member
Got nothing definitive to prove my point. Lots of research available on the subject. The world seems to be getting warmer. Atmospheric CO2 is at a high level and climbing rapidly. At this point, there is little we can do about it as carbon fuel consumption and CO2 emissions continue to grow. We humans are a factor but we are adaptable.
Old Rocks
Diamond Member
I got one of those too but it's a little more fancy. It actually makes predictions based upon the existing trend. Does yours do that too?
View attachment 166974
View attachment 166976
Except it does not take into account feedbacks from permafrost, forest fires, and clathrates.
Similar threads
- Replies
- 1
- Views
- 131
- Replies
- 35
- Views
- 1K
- Replies
- 559
- Views
- 8K
- Replies
- 20
- Views
- 417
Latest Discussions
- Replies
- 30
- Views
- 113
- Replies
- 5
- Views
- 13
- Replies
- 25
- Views
- 83
Forum List
-
-
-
-
-
Political Satire 8524
-
-
-
-
-
-
-
-
-
-
-
-
-
-
-
-
-
-
-
ObamaCare 781
-
-
-
-
-
-
-
-
-
-
-
Member Usernotes 485
-
-
-
-
-
-
-
-
-
-