Simple Question for Those Who Subscribe to AGW....

Status
Not open for further replies.
Organizations whose information you consistently deny and claim to be falsified. You can't have it both ways. You've denied even the possibility of the existence greenhouse effect. You're just an idiot.

There is decent information to be had in the material they publish in the literature which has been through the peer review process...unfortunately, people like you don't visit the actual scientific literature...you read the material from the propaganda arm of the organization and believe you are reading actual science...ignorance on parade.


Well then, post the organizations which have that "decent information" because so far today your 0 for 2.

Sorry bulwinkle...feel free to look back through this conversation...one of us has supported every claim he has made with peer reviewed, published science...one of us hasn't provided jack that could actually support anything he has said...you have spent the past posts just making crap up and having it shot down with actual peer reviewed, published scientific literature...you have lost point after point after point and are just to stupid to stop digging a hole for yourself.

You don't have the first clue about climate science. All you know about any of those papers is that google listed them under "dumbass global warming deniers central".

Sorry guy...thus far, you have just been making it up as you go...which is why I have been able to provide peer reviewed published science to call bullshit on everything you have said...alas, it is you who is clueless and it doesn't look like you are getting any smarter as time goes by..


What peer review BS have you provided? Because everything that you have posted tonight has been either misleading, wrong or both.
 
Now about your GISP2 "gold standard" when it is put thru a fact check.

Fact-check: What Greenland Ice Cores Say About Past and Present Climate Change


So, the "gold standard" cited by YOU is wrong. From one of the scientists that used the data set.

“So, what do we get from GISP2? Alone, not an immense amount. With the other Greenland ice cores… and compared to additional records from elsewhere, an immense amount… Using GISP2 data to argue against global warming is, well, stupid, or misguided, or misled, or something, but surely not scientifically sensible.”

So which are you?

guess you didn't look at any of his other graphs...they also showed that the present is cooler than most of the past 10,000 years...you guys are funny....sad and pathetic to..but funny.


You have made up information. The scientists who work with your "gold standard" state that Greenland is warmer now than any point over the last 2,000 years.


And when you look
Now about your GISP2 "gold standard" when it is put thru a fact check.

Fact-check: What Greenland Ice Cores Say About Past and Present Climate Change


So, the "gold standard" cited by YOU is wrong. From one of the scientists that used the data set.

“So, what do we get from GISP2? Alone, not an immense amount. With the other Greenland ice cores… and compared to additional records from elsewhere, an immense amount… Using GISP2 data to argue against global warming is, well, stupid, or misguided, or misled, or something, but surely not scientifically sensible.”

So which are you?

guess you didn't look at any of his other graphs...they also showed that the present is cooler than most of the past 10,000 years...you guys are funny....sad and pathetic to..but funny.


You have made up information. The scientists who work with your "gold standard" state that Greenland is warmer now than any point over the last 2,000 years.

You are really a goob aren't you? First off, Desmog is just a blog...it isn't scientific literature..it is just a blog...What i have provided is peer reviewed, published science.. you can't even recognize the difference between a f'ing blog and real science...pack it in, at this point, you are just making yourself look stupid... Here is an amalgamation of all the greenland ice cores...slightly different from the ones I provided, but then it is composed of multiple ice cores..

greenland_temps1.png

You dumbass. It isn't the current temperature that matters. It's the rate of change, which is unprecedented.

Sorry but it isn't....what's the matter...can't read a graph? If you could, you would see that the amount of change, and the rate of change have been far greater than anything we have seen multiple times over the past 10,000 years....what's the matter? Aren't you smart enough to even read a simple graph?


Your graph has modeling and adjustments, it's wrong.


Next.
 
There is decent information to be had in the material they publish in the literature which has been through the peer review process...unfortunately, people like you don't visit the actual scientific literature...you read the material from the propaganda arm of the organization and believe you are reading actual science...ignorance on parade.

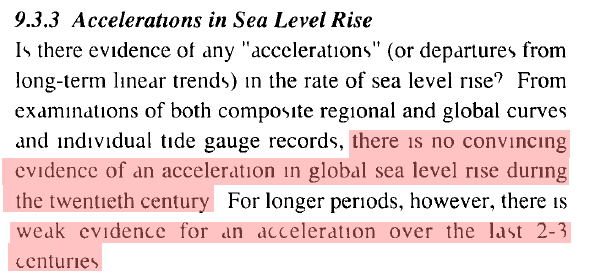
You mean the place where they taught you that sea level rise always occurs at 3mm/year and never changes? Even after you called the GISP2 graph the "gold standard"? You're really stupid.

Sea level has been increasing at about 3mm per year for about a good long while now with no real indication that it is accelerating...the big sea level increases happened some while back... As you can see, at about 14,000 years ago sea level really started going and increased by about 300 feet...that much ice melted at the end of the glacial...Chicago was under 2 miles of ice at the time...and about 600 years ago it sort of leveled off and hasn't changed much since...it may vary by 1 mm a year or so, but not much beyond that... Anyone who claims otherwise is an alarmist with no evidence to support his claims.

Misleading or wrong again.

From NASA.
"Global sea level rose about 8 inches in the last century. The rate in the last two decades, however, is nearly double that of the last century and is accelerating slightly every year."

Climate-change–driven accelerated sea-level rise detected in the altimeter era


Refute that.

Sorry...its bullshit...they adjusted a hundred years worth of sea level when they went to satellites and the oldest tide gages in the world...several hundred years worth of records don't agree with the adjustments...


What adjustments are ranting about exactly.

Luckily, old data is still hanging around to be found to bring the fraud of the climate science modern climate science community into high relief...even if folks like you are going to deny the reality.... This is the sea level increase between 1880 and 1980 shown by NASA. The graph shows an increase of just over 3 inches of sea level increase between 1880 and 1980....NOTE the sharp decrease in the rate of increase after 1950.

ScreenHunter_2132-May.-31-12.25.jpg


You can't really scare people with a 3 inch sea level increase over a 100 year period so the frauds in climate science increased the figure to 6 inches per century with nothing more than adjustments.... NOTE the completely FAKE acceleration after 1950.

Trends_in_global_average_absolute_sea_level_1870-2008_US_EPA-1.png


Here is an overlay of the two graphs on the same time scale. One is scientific in nature...showing actual observed sea level increases...the other is a piece of alarmist propaganda that has nothing whatsoever to do with science and everything to do with supporting a fraudulent narrative.

CGWXcXUU8AABZ5w.png


Then in 2004, the University of Colorado showed 2.8 mm per year rate of sea level increase.

2.8 mm per year? Not very scary...even to alarmists so again, the data is heavily massaged using inappropriate, and completely fraudulent methods to achieve a 3.3mm per year rate of increase. A global isostatic adjustment was applied which is blatantly fraudulent in the context of sea level increase. Such adjustments are correct in the context of calculating ocean depth as the sea floor sinks and have absolutely no relationship to measuring sea level by satellites. Here is what the adjustments look like...

sl_ns_global-2.png


Here is an overlay of the two graphs at the same time scale.

AnimationImage86.png


So some numbers got a massage and a picture was painted to give the appearance of imminent disaster. Shit happens...right? But when the "spokes agency" for modern climate science repeats the fraud as truth....we have real evidence of deliberate data corruption with the intent to deceive regarding climate change. In 1990 the IPCC said:


paintimage85.png


Then in 2013 using blatantly massaged data and obviously fraudulent graphs, the IPCC said exactly the opposite of what they said in 1990.

And just for fun...take a look at the very early tide information...what sort of new information do you think would require changing tide data from 60, 70, 80, and even 100 years ago?

The fact is that the sea level claims are fraudulent...and anyone who believes them has either been fooled, or is being nothing more than one of the legion of useful idiots.
 
There is decent information to be had in the material they publish in the literature which has been through the peer review process...unfortunately, people like you don't visit the actual scientific literature...you read the material from the propaganda arm of the organization and believe you are reading actual science...ignorance on parade.


Well then, post the organizations which have that "decent information" because so far today your 0 for 2.

Sorry bulwinkle...feel free to look back through this conversation...one of us has supported every claim he has made with peer reviewed, published science...one of us hasn't provided jack that could actually support anything he has said...you have spent the past posts just making crap up and having it shot down with actual peer reviewed, published scientific literature...you have lost point after point after point and are just to stupid to stop digging a hole for yourself.

You don't have the first clue about climate science. All you know about any of those papers is that google listed them under "dumbass global warming deniers central".

Sorry guy...thus far, you have just been making it up as you go...which is why I have been able to provide peer reviewed published science to call bullshit on everything you have said...alas, it is you who is clueless and it doesn't look like you are getting any smarter as time goes by..


What peer review BS have you provided? Because everything that you have posted tonight has been either misleading, wrong or both.

Practically everything I have provided has been peer reviewed...like I said, you aren't even able to recognize actual scientific literature when you see it..you are accustomed to f'ing alarmist blogs...I actually go to the science for my information..you go to alarmists, the media, politicians, and environmental activists...you wouldn't know science if it bit you on the ass.
 
guess you didn't look at any of his other graphs...they also showed that the present is cooler than most of the past 10,000 years...you guys are funny....sad and pathetic to..but funny.


You have made up information. The scientists who work with your "gold standard" state that Greenland is warmer now than any point over the last 2,000 years.


And when you look
guess you didn't look at any of his other graphs...they also showed that the present is cooler than most of the past 10,000 years...you guys are funny....sad and pathetic to..but funny.


You have made up information. The scientists who work with your "gold standard" state that Greenland is warmer now than any point over the last 2,000 years.

You are really a goob aren't you? First off, Desmog is just a blog...it isn't scientific literature..it is just a blog...What i have provided is peer reviewed, published science.. you can't even recognize the difference between a f'ing blog and real science...pack it in, at this point, you are just making yourself look stupid... Here is an amalgamation of all the greenland ice cores...slightly different from the ones I provided, but then it is composed of multiple ice cores..

greenland_temps1.png

You dumbass. It isn't the current temperature that matters. It's the rate of change, which is unprecedented.

Sorry but it isn't....what's the matter...can't read a graph? If you could, you would see that the amount of change, and the rate of change have been far greater than anything we have seen multiple times over the past 10,000 years....what's the matter? Aren't you smart enough to even read a simple graph?


Your graph has modeling and adjustments, it's wrong.


Next.

So lets see some peer reviewed evidence to contradict it...mine is peer reviewed..yours was from an alarmist blog...given a choice, I will go with the peer reviewed science till some better peer reviewed science comes along...you stick with your alarmist blog...they will give you just the opinion they think you should have. No effort on your part necessary...of course it does leave you looking like a clueless idiot when you try to talk to someone who can actually provide real science to support their position, but luckily you won't be bright enough to even recognize the fact that you are taking a real drubbing in public...
 
You mean the place where they taught you that sea level rise always occurs at 3mm/year and never changes? Even after you called the GISP2 graph the "gold standard"? You're really stupid.

Sea level has been increasing at about 3mm per year for about a good long while now with no real indication that it is accelerating...the big sea level increases happened some while back... As you can see, at about 14,000 years ago sea level really started going and increased by about 300 feet...that much ice melted at the end of the glacial...Chicago was under 2 miles of ice at the time...and about 600 years ago it sort of leveled off and hasn't changed much since...it may vary by 1 mm a year or so, but not much beyond that... Anyone who claims otherwise is an alarmist with no evidence to support his claims.

Misleading or wrong again.

From NASA.
"Global sea level rose about 8 inches in the last century. The rate in the last two decades, however, is nearly double that of the last century and is accelerating slightly every year."

Climate-change–driven accelerated sea-level rise detected in the altimeter era


Refute that.

Sorry...its bullshit...they adjusted a hundred years worth of sea level when they went to satellites and the oldest tide gages in the world...several hundred years worth of records don't agree with the adjustments...


What adjustments are ranting about exactly.

Luckily, old data is still hanging around to be found to bring the fraud of the climate science modern climate science community into high relief...even if folks like you are going to deny the reality.... This is the sea level increase between 1880 and 1980 shown by NASA. The graph shows an increase of just over 3 inches of sea level increase between 1880 and 1980....NOTE the sharp decrease in the rate of increase after 1950.

ScreenHunter_2132-May.-31-12.25.jpg


You can't really scare people with a 3 inch sea level increase over a 100 year period so the frauds in climate science increased the figure to 6 inches per century with nothing more than adjustments.... NOTE the completely FAKE acceleration after 1950.

Trends_in_global_average_absolute_sea_level_1870-2008_US_EPA-1.png


Here is an overlay of the two graphs on the same time scale. One is scientific in nature...showing actual observed sea level increases...the other is a piece of alarmist propaganda that has nothing whatsoever to do with science and everything to do with supporting a fraudulent narrative.

CGWXcXUU8AABZ5w.png


Then in 2004, the University of Colorado showed 2.8 mm per year rate of sea level increase.

2.8 mm per year? Not very scary...even to alarmists so again, the data is heavily massaged using inappropriate, and completely fraudulent methods to achieve a 3.3mm per year rate of increase. A global isostatic adjustment was applied which is blatantly fraudulent in the context of sea level increase. Such adjustments are correct in the context of calculating ocean depth as the sea floor sinks and have absolutely no relationship to measuring sea level by satellites. Here is what the adjustments look like...

sl_ns_global-2.png


Here is an overlay of the two graphs at the same time scale.

AnimationImage86.png


So some numbers got a massage and a picture was painted to give the appearance of imminent disaster. Shit happens...right? But when the "spokes agency" for modern climate science repeats the fraud as truth....we have real evidence of deliberate data corruption with the intent to deceive regarding climate change. In 1990 the IPCC said:


paintimage85.png


Then in 2013 using blatantly massaged data and obviously fraudulent graphs, the IPCC said exactly the opposite of what they said in 1990.

And just for fun...take a look at the very early tide information...what sort of new information do you think would require changing tide data from 60, 70, 80, and even 100 years ago?

The fact is that the sea level claims are fraudulent...and anyone who believes them has either been fooled, or is being nothing more than one of the legion of useful idiots.


I stand by the 8 inches and the NASA data that you have not disproved.

A graph from 40 years ago and you so desperately want to be taken seriously.
 
You have made up information. The scientists who work with your "gold standard" state that Greenland is warmer now than any point over the last 2,000 years.


And when you look
You have made up information. The scientists who work with your "gold standard" state that Greenland is warmer now than any point over the last 2,000 years.

You are really a goob aren't you? First off, Desmog is just a blog...it isn't scientific literature..it is just a blog...What i have provided is peer reviewed, published science.. you can't even recognize the difference between a f'ing blog and real science...pack it in, at this point, you are just making yourself look stupid... Here is an amalgamation of all the greenland ice cores...slightly different from the ones I provided, but then it is composed of multiple ice cores..

greenland_temps1.png

You dumbass. It isn't the current temperature that matters. It's the rate of change, which is unprecedented.

Sorry but it isn't....what's the matter...can't read a graph? If you could, you would see that the amount of change, and the rate of change have been far greater than anything we have seen multiple times over the past 10,000 years....what's the matter? Aren't you smart enough to even read a simple graph?


Your graph has modeling and adjustments, it's wrong.


Next.

So lets see some peer reviewed evidence to contradict it...mine is peer reviewed..yours was from an alarmist blog...given a choice, I will go with the peer reviewed science till some better peer reviewed science comes along...you stick with your alarmist blog...they will give you just the opinion they think you should have. No effort on your part necessary...of course it does leave you looking like a clueless idiot when you try to talk to someone who can actually provide real science to support their position, but luckily you won't be bright enough to even recognize the fact that you are taking a real drubbing in public...


You have not disproved any of the peer reviewed data that Desmog cited. You have used some cut and paste BS backed by nothing.
 
If you could, you would see that the amount of change, and the rate of change have been far greater than anything we have seen multiple times over the past 10,000 years...

That's the problem genius. It proves that the warming we're experiencing is greater that what can be accounted for by solar variations or volcanism. Exactly what I said before, stupid.
 
Sea level has been increasing at about 3mm per year for about a good long while now with no real indication that it is accelerating...the big sea level increases happened some while back... As you can see, at about 14,000 years ago sea level really started going and increased by about 300 feet...that much ice melted at the end of the glacial...Chicago was under 2 miles of ice at the time...and about 600 years ago it sort of leveled off and hasn't changed much since...it may vary by 1 mm a year or so, but not much beyond that... Anyone who claims otherwise is an alarmist with no evidence to support his claims.

Misleading or wrong again.

From NASA.
"Global sea level rose about 8 inches in the last century. The rate in the last two decades, however, is nearly double that of the last century and is accelerating slightly every year."

Climate-change–driven accelerated sea-level rise detected in the altimeter era


Refute that.

Sorry...its bullshit...they adjusted a hundred years worth of sea level when they went to satellites and the oldest tide gages in the world...several hundred years worth of records don't agree with the adjustments...


What adjustments are ranting about exactly.

Luckily, old data is still hanging around to be found to bring the fraud of the climate science modern climate science community into high relief...even if folks like you are going to deny the reality.... This is the sea level increase between 1880 and 1980 shown by NASA. The graph shows an increase of just over 3 inches of sea level increase between 1880 and 1980....NOTE the sharp decrease in the rate of increase after 1950.

ScreenHunter_2132-May.-31-12.25.jpg


You can't really scare people with a 3 inch sea level increase over a 100 year period so the frauds in climate science increased the figure to 6 inches per century with nothing more than adjustments.... NOTE the completely FAKE acceleration after 1950.

Trends_in_global_average_absolute_sea_level_1870-2008_US_EPA-1.png


Here is an overlay of the two graphs on the same time scale. One is scientific in nature...showing actual observed sea level increases...the other is a piece of alarmist propaganda that has nothing whatsoever to do with science and everything to do with supporting a fraudulent narrative.

CGWXcXUU8AABZ5w.png


Then in 2004, the University of Colorado showed 2.8 mm per year rate of sea level increase.

2.8 mm per year? Not very scary...even to alarmists so again, the data is heavily massaged using inappropriate, and completely fraudulent methods to achieve a 3.3mm per year rate of increase. A global isostatic adjustment was applied which is blatantly fraudulent in the context of sea level increase. Such adjustments are correct in the context of calculating ocean depth as the sea floor sinks and have absolutely no relationship to measuring sea level by satellites. Here is what the adjustments look like...

sl_ns_global-2.png


Here is an overlay of the two graphs at the same time scale.

AnimationImage86.png


So some numbers got a massage and a picture was painted to give the appearance of imminent disaster. Shit happens...right? But when the "spokes agency" for modern climate science repeats the fraud as truth....we have real evidence of deliberate data corruption with the intent to deceive regarding climate change. In 1990 the IPCC said:


paintimage85.png


Then in 2013 using blatantly massaged data and obviously fraudulent graphs, the IPCC said exactly the opposite of what they said in 1990.

And just for fun...take a look at the very early tide information...what sort of new information do you think would require changing tide data from 60, 70, 80, and even 100 years ago?

The fact is that the sea level claims are fraudulent...and anyone who believes them has either been fooled, or is being nothing more than one of the legion of useful idiots.


I stand by the 8 inches and the NASA data that you have not disproved.

A graph from 40 years ago and you so desperately want to be taken seriously.

Actually a series of graphs covering the 20th century into the 21st century...and an explanation and demonstration of the fraud being perpetrated.


Of course you will stick with 8 inches...becasue you are a useful idiot..what else could you do? I don't expect that you could even understand what I wrote regarding sea level change and surely the graphs don't mean much to you..except for the ones with pretty colors...and tell me, do you think they didn't know how to take tide readings in 1979? Is that what you really think? Did you notice that the graph from 1979 was published in a paper by James Hansen? He is the hero of the global warming movement...hell he is the godfather of global warming...you are about the most ignorant person I have spoken to in some time on this board...you are right up there with cosmos on the idiot scale...you must be so proud...
 
And when you look
You are really a goob aren't you? First off, Desmog is just a blog...it isn't scientific literature..it is just a blog...What i have provided is peer reviewed, published science.. you can't even recognize the difference between a f'ing blog and real science...pack it in, at this point, you are just making yourself look stupid... Here is an amalgamation of all the greenland ice cores...slightly different from the ones I provided, but then it is composed of multiple ice cores..

greenland_temps1.png

You dumbass. It isn't the current temperature that matters. It's the rate of change, which is unprecedented.

Sorry but it isn't....what's the matter...can't read a graph? If you could, you would see that the amount of change, and the rate of change have been far greater than anything we have seen multiple times over the past 10,000 years....what's the matter? Aren't you smart enough to even read a simple graph?


Your graph has modeling and adjustments, it's wrong.


Next.

So lets see some peer reviewed evidence to contradict it...mine is peer reviewed..yours was from an alarmist blog...given a choice, I will go with the peer reviewed science till some better peer reviewed science comes along...you stick with your alarmist blog...they will give you just the opinion they think you should have. No effort on your part necessary...of course it does leave you looking like a clueless idiot when you try to talk to someone who can actually provide real science to support their position, but luckily you won't be bright enough to even recognize the fact that you are taking a real drubbing in public...


You have not disproved any of the peer reviewed data that Desmog cited. You have used some cut and paste BS backed by nothing.

Actually, I disproved it all...do I expect that you would be bright enough to recognize that fact? No...not a chance in hell. You keep reading your blogs and stay just as ignorant as you are...it is precisely what you deserve.
 
If you could, you would see that the amount of change, and the rate of change have been far greater than anything we have seen multiple times over the past 10,000 years...

That's the problem genius. It proves that the warming we're experiencing is greater that what can be accounted for by solar variations or volcanism. Exactly what I said before, stupid.

Explain how greater changes and faster changes in the past prove that the relatively small changes we have seen are greater than natural variability could account for? This should be interesting...and f'ing hilarious...but go ahead...Im all ears....I love comedy.
 
Simple Question for Those Who Subscribe to AGW....

I.E., the global scientific community. But you dont ply your nonsense with them, necause you qould get laughed out of the room. By the way, they are the ones who have the evidence.


First, it is a bit disingenuous to say, "the global scientific community," because I don't really think they all subscribe to the belief that humans are the primary driver,

Earth Science | Climate Change | Global Warming | Renewable Energy | Pollution Treatment | Renewable Energy | USA | Asia | Middle East| Lisbon | Portugal
PLANETOPHYSICAL STATE OF THE EARTH AND LIFE
| PSI Intl

and,

Second, has the scientific community always been completely accurate in all of it's hypothesis's?

I think the question is misstated.
Has Global Warming and Climate Change caused the Polar Shift?
As temperatures increased throughout the 20th century, Greenland's ice mass decreased. In fact, a total of about 7,500 gigatons -- the weight of more than 20 million Empire State Buildings -- of Greenland's ice melted into the ocean during this time period. This makes Greenland one of the top contributors of mass being transferred to the oceans, causing sea level to rise and, consequently, a drift in Earth's spin axis.
Scientists ID three causes of Earth's spin axis drift – Climate Change: Vital Signs of the Planet

But to answer your question, when their is evidence of the most catastrophic event that mankind has ever faced is occurring, we don't need 100% of the scientific community concurrence nor do we need to be 100% correct.
 
You dumbass. It isn't the current temperature that matters. It's the rate of change, which is unprecedented.

Sorry but it isn't....what's the matter...can't read a graph? If you could, you would see that the amount of change, and the rate of change have been far greater than anything we have seen multiple times over the past 10,000 years....what's the matter? Aren't you smart enough to even read a simple graph?


Your graph has modeling and adjustments, it's wrong.


Next.

So lets see some peer reviewed evidence to contradict it...mine is peer reviewed..yours was from an alarmist blog...given a choice, I will go with the peer reviewed science till some better peer reviewed science comes along...you stick with your alarmist blog...they will give you just the opinion they think you should have. No effort on your part necessary...of course it does leave you looking like a clueless idiot when you try to talk to someone who can actually provide real science to support their position, but luckily you won't be bright enough to even recognize the fact that you are taking a real drubbing in public...


You have not disproved any of the peer reviewed data that Desmog cited. You have used some cut and paste BS backed by nothing.

Actually, I disproved it all...do I expect that you would be bright enough to recognize that fact? No...not a chance in hell. You keep reading your blogs and stay just as ignorant as you are...it is precisely what you deserve.


You have not disproved this peer reviewed paper from 2018.

Climate-change–driven accelerated sea-level rise detected in the altimeter era


You have NOT disproved anything from NASA.


You have offered bullshit and paraded around in a little skirt.
 
If you could, you would see that the amount of change, and the rate of change have been far greater than anything we have seen multiple times over the past 10,000 years...

That's the problem genius. It proves that the warming we're experiencing is greater that what can be accounted for by solar variations or volcanism. Exactly what I said before, stupid.

Explain how greater changes and faster changes in the past prove that the relatively small changes we have seen are greater than natural variability could account for? This should be interesting...and f'ing hilarious...but go ahead...Im all ears....I love comedy.

So now you're reversing yourself. Proving once again you're nothing but a babbling idiot.
 
You mean the place where they taught you that sea level rise always occurs at 3mm/year and never changes? Even after you called the GISP2 graph the "gold standard"? You're really stupid.

Sea level has been increasing at about 3mm per year for about a good long while now with no real indication that it is accelerating...the big sea level increases happened some while back... As you can see, at about 14,000 years ago sea level really started going and increased by about 300 feet...that much ice melted at the end of the glacial...Chicago was under 2 miles of ice at the time...and about 600 years ago it sort of leveled off and hasn't changed much since...it may vary by 1 mm a year or so, but not much beyond that... Anyone who claims otherwise is an alarmist with no evidence to support his claims.

Misleading or wrong again.

From NASA.
"Global sea level rose about 8 inches in the last century. The rate in the last two decades, however, is nearly double that of the last century and is accelerating slightly every year."

Climate-change–driven accelerated sea-level rise detected in the altimeter era


Refute that.

Sorry...its bullshit...they adjusted a hundred years worth of sea level when they went to satellites and the oldest tide gages in the world...several hundred years worth of records don't agree with the adjustments...


What adjustments are ranting about exactly.

Luckily, old data is still hanging around to be found to bring the fraud of the climate science modern climate science community into high relief...even if folks like you are going to deny the reality.... This is the sea level increase between 1880 and 1980 shown by NASA. The graph shows an increase of just over 3 inches of sea level increase between 1880 and 1980....NOTE the sharp decrease in the rate of increase after 1950.

ScreenHunter_2132-May.-31-12.25.jpg


You can't really scare people with a 3 inch sea level increase over a 100 year period so the frauds in climate science increased the figure to 6 inches per century with nothing more than adjustments.... NOTE the completely FAKE acceleration after 1950.

Trends_in_global_average_absolute_sea_level_1870-2008_US_EPA-1.png


Here is an overlay of the two graphs on the same time scale. One is scientific in nature...showing actual observed sea level increases...the other is a piece of alarmist propaganda that has nothing whatsoever to do with science and everything to do with supporting a fraudulent narrative.

CGWXcXUU8AABZ5w.png


Then in 2004, the University of Colorado showed 2.8 mm per year rate of sea level increase.

2.8 mm per year? Not very scary...even to alarmists so again, the data is heavily massaged using inappropriate, and completely fraudulent methods to achieve a 3.3mm per year rate of increase. A global isostatic adjustment was applied which is blatantly fraudulent in the context of sea level increase. Such adjustments are correct in the context of calculating ocean depth as the sea floor sinks and have absolutely no relationship to measuring sea level by satellites. Here is what the adjustments look like...

sl_ns_global-2.png


Here is an overlay of the two graphs at the same time scale.

AnimationImage86.png


So some numbers got a massage and a picture was painted to give the appearance of imminent disaster. Shit happens...right? But when the "spokes agency" for modern climate science repeats the fraud as truth....we have real evidence of deliberate data corruption with the intent to deceive regarding climate change. In 1990 the IPCC said:


paintimage85.png


Then in 2013 using blatantly massaged data and obviously fraudulent graphs, the IPCC said exactly the opposite of what they said in 1990.

And just for fun...take a look at the very early tide information...what sort of new information do you think would require changing tide data from 60, 70, 80, and even 100 years ago?

The fact is that the sea level claims are fraudulent...and anyone who believes them has either been fooled, or is being nothing more than one of the legion of useful idiots.
I think you're comparing apples and oranges.

In the first graph according to the text below the graph, the measurements are taken from tidal gauges. To really compare these 2 graphs the same gauges at the same locations would have to be used. Until sometime in the 20th tidal gauges were basically mechanic devices and measuring sticks. The early tide gauges were expensive and difficult to maintain, and accuracy was always a problem. In the 1960's, the first digital tidal gauges were automated recording of data became widely used improving the accuracy and reliability.

In the second graph, more recent data was taken from satellite altimeters which are much more accurate than tidal gauges and tidal gauges for prior dates. The data collection for the second graph is described on the cmar.csiro website. It states the data prior to 1992 is uncertain because of the use of tidal gauges. The following graph from their website was created form satellite altimeter data which shows 3.5 mm/yr rise or 350 mm over a hundred years which translates to 13.8 inches over a century.

alt_gmsl_seas_rem.jpg


I would think a global average rise in sea level of a 13.8 per century would be pretty alarming.

Past sea level changes - Sea Level, Waves and Coastal Extremes
 
What physical evidence supports the contention that carbon dioxide emissions from burning fossil fuels are the principal cause of global warming since 1970?

If you have it....lets see it. If you don't....then lets hear your best excuse for not providing it.

99 reasons you deniers are idiots

99 One-Liners That Rebut Climate Change Denier Talking Points – Alternet.org
If it was so easy why didn't you rebut his argument point per point instead of providing this nonsense bullshit link?

Okay, first his argument point is stupid.
No, it wasn't.
 
Simple Question for Those Who Subscribe to AGW....

I.E., the global scientific community. But you dont ply your nonsense with them, necause you qould get laughed out of the room. By the way, they are the ones who have the evidence.


First, it is a bit disingenuous to say, "the global scientific community," because I don't really think they all subscribe to the belief that humans are the primary driver,

Earth Science | Climate Change | Global Warming | Renewable Energy | Pollution Treatment | Renewable Energy | USA | Asia | Middle East| Lisbon | Portugal
PLANETOPHYSICAL STATE OF THE EARTH AND LIFE
| PSI Intl

and,

Second, has the scientific community always been completely accurate in all of it's hypothesis's?

I think the question is misstated.
Has Global Warming and Climate Change caused the Polar Shift?
As temperatures increased throughout the 20th century, Greenland's ice mass decreased. In fact, a total of about 7,500 gigatons -- the weight of more than 20 million Empire State Buildings -- of Greenland's ice melted into the ocean during this time period. This makes Greenland one of the top contributors of mass being transferred to the oceans, causing sea level to rise and, consequently, a drift in Earth's spin axis.
Scientists ID three causes of Earth's spin axis drift – Climate Change: Vital Signs of the Planet

But to answer your question, when their is evidence of the most catastrophic event that mankind has ever faced is occurring, we don't need 100% of the scientific community concurrence nor do we need to be 100% correct.

First, in spite of your hysterical, handwaving and hyperventilating, this is not the most catastrophic event that mankind has ever faced...the little ice age that we are coming out of was...it is estimated that the shortened growing seasons which reduced food stores, and the cold itself along with the diseases it brought with it (the black death among them, more than 55 million people died due to the change in climate. Cold is a killer, not warmth.

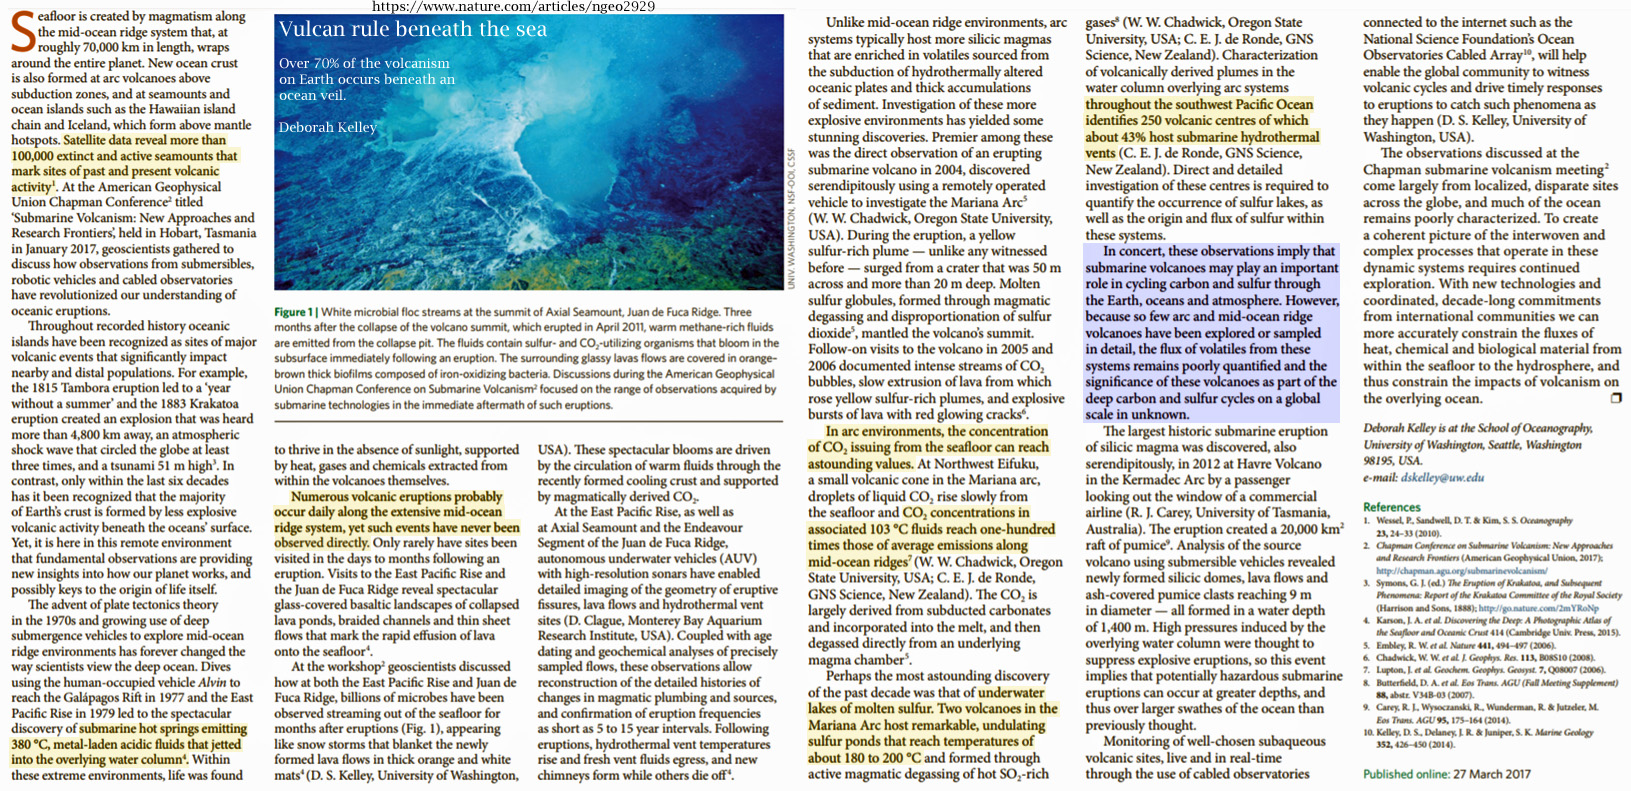
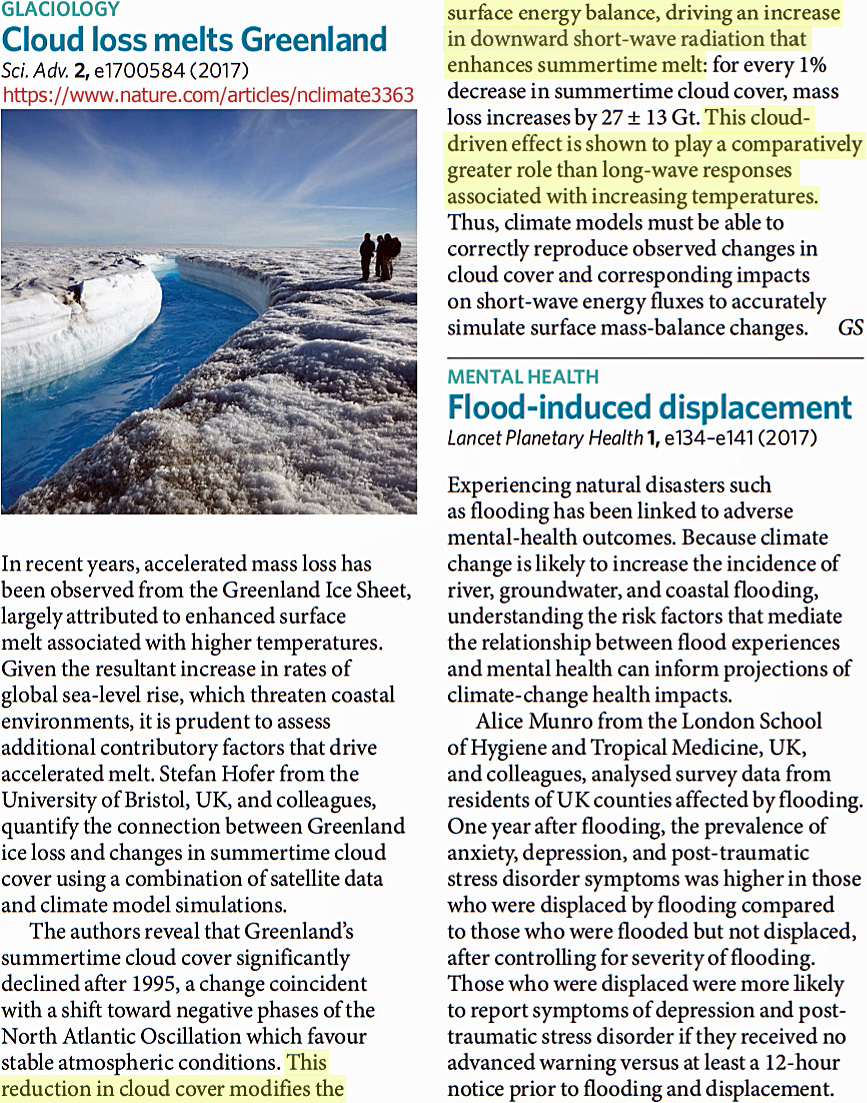
Second as with all the hysterical claims of climate science about everything, the claims about greenland are false as well. Parts of greenland are losing ice because volcanoes have also been discovered under the ice on greenland.. Imagine that...volcanoes melting ice..

From Kelly; 2017
Seafloor-volcanism-Kelly-2017.jpg


From Nature:

Cloud-Loss-Melts-Greenland-Hofer-2017.jpg


There is plenty more....suffice it to say that you have been misled...unfortunate but that is how life is for useful idiots.
 
Status
Not open for further replies.

Forum List

Back
Top