otto105
Diamond Member
- Sep 11, 2017
- 36,425
- 11,651
- 1,315
Okay, I believe the scientists at NASA over a troll on the internet.
Unfortunate to be in a position where you feel that you must believe people who have been caught falsifying data....
What data has been falsified? Well, outside of the denial bubble.
Glad to provide you with some...it isn't as if were hard to find....
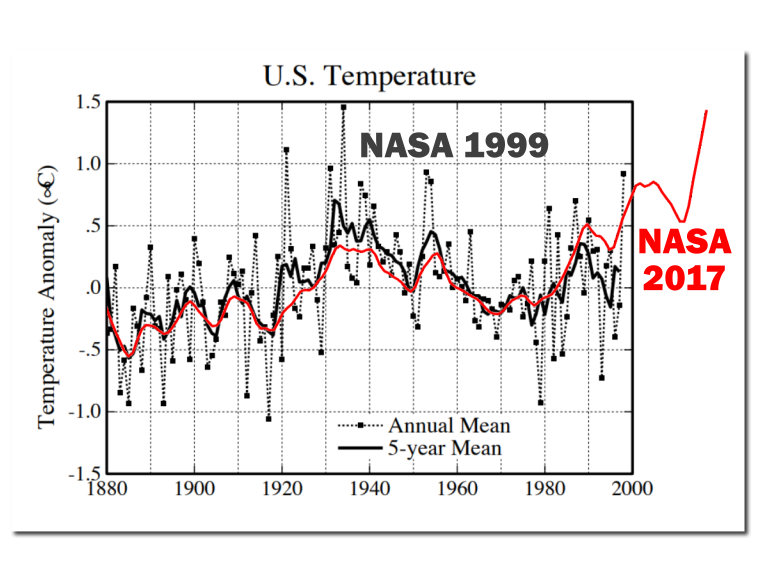
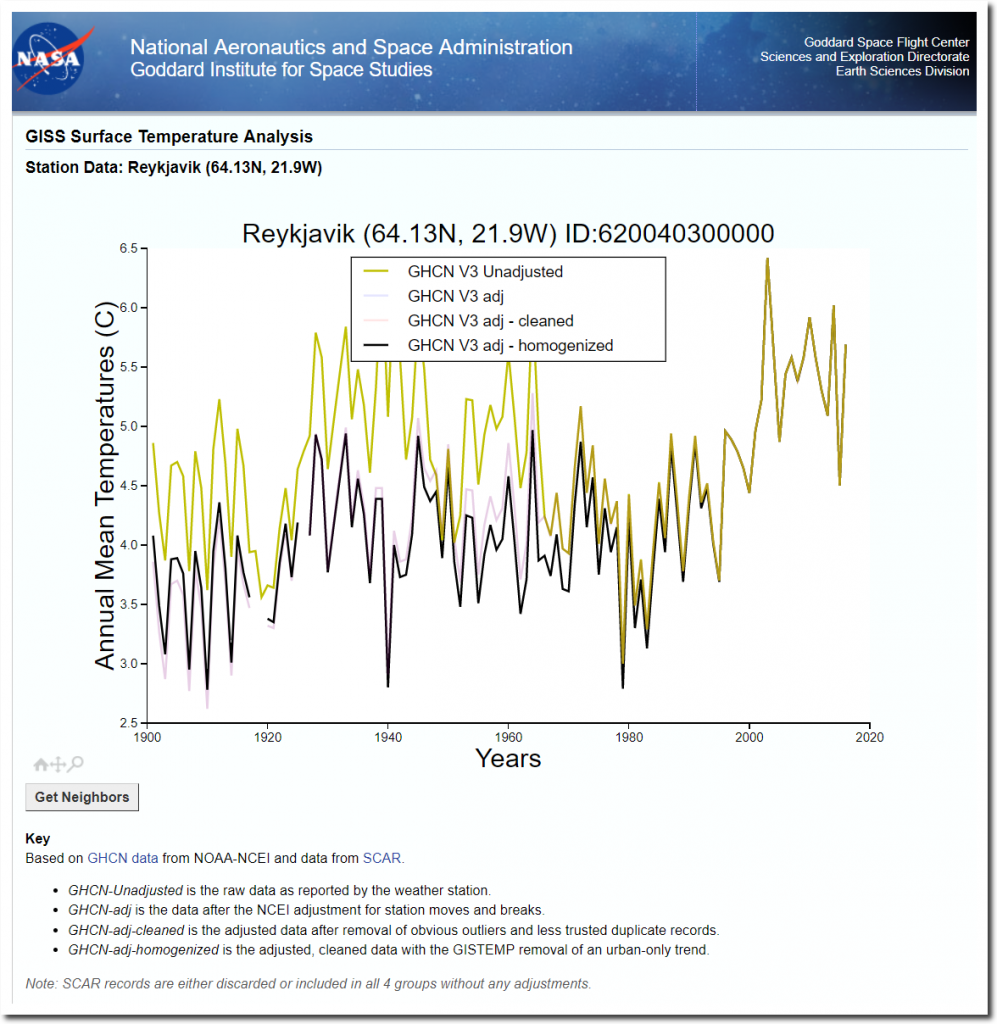
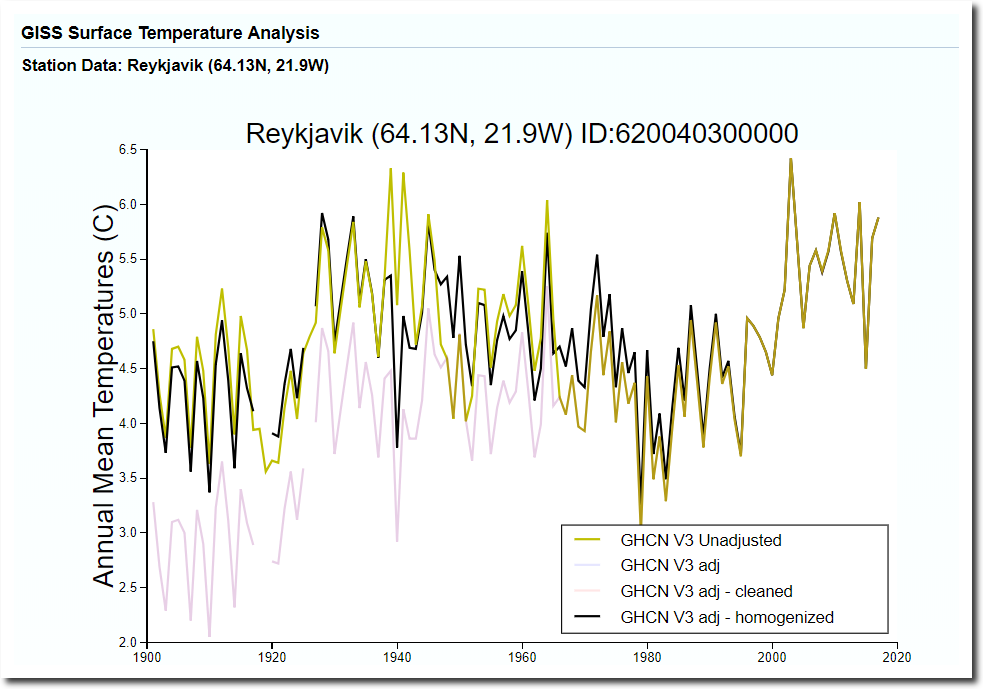
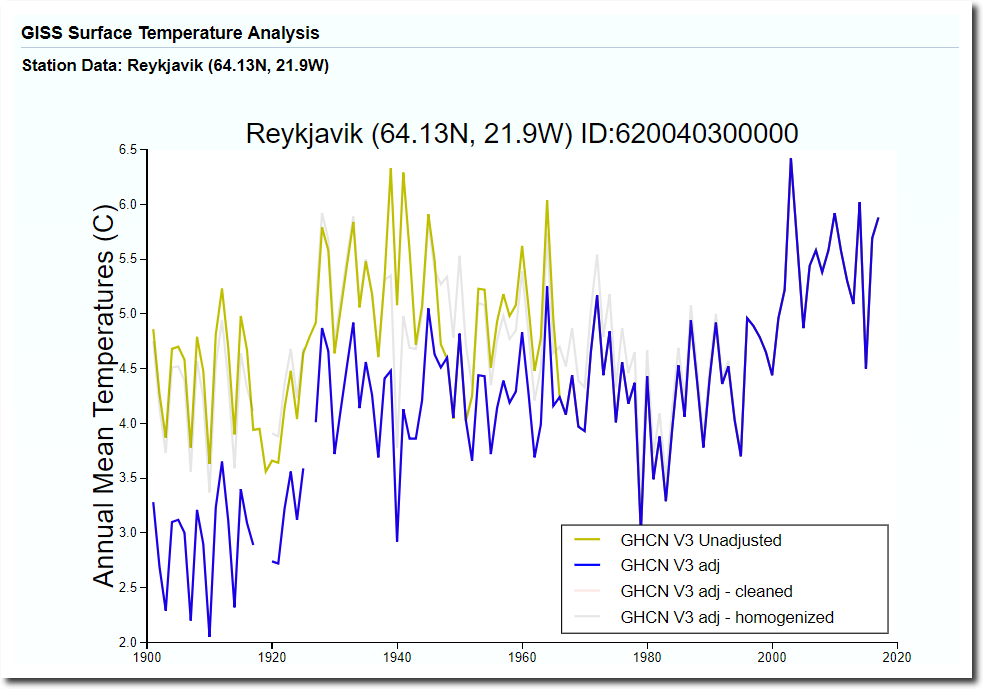
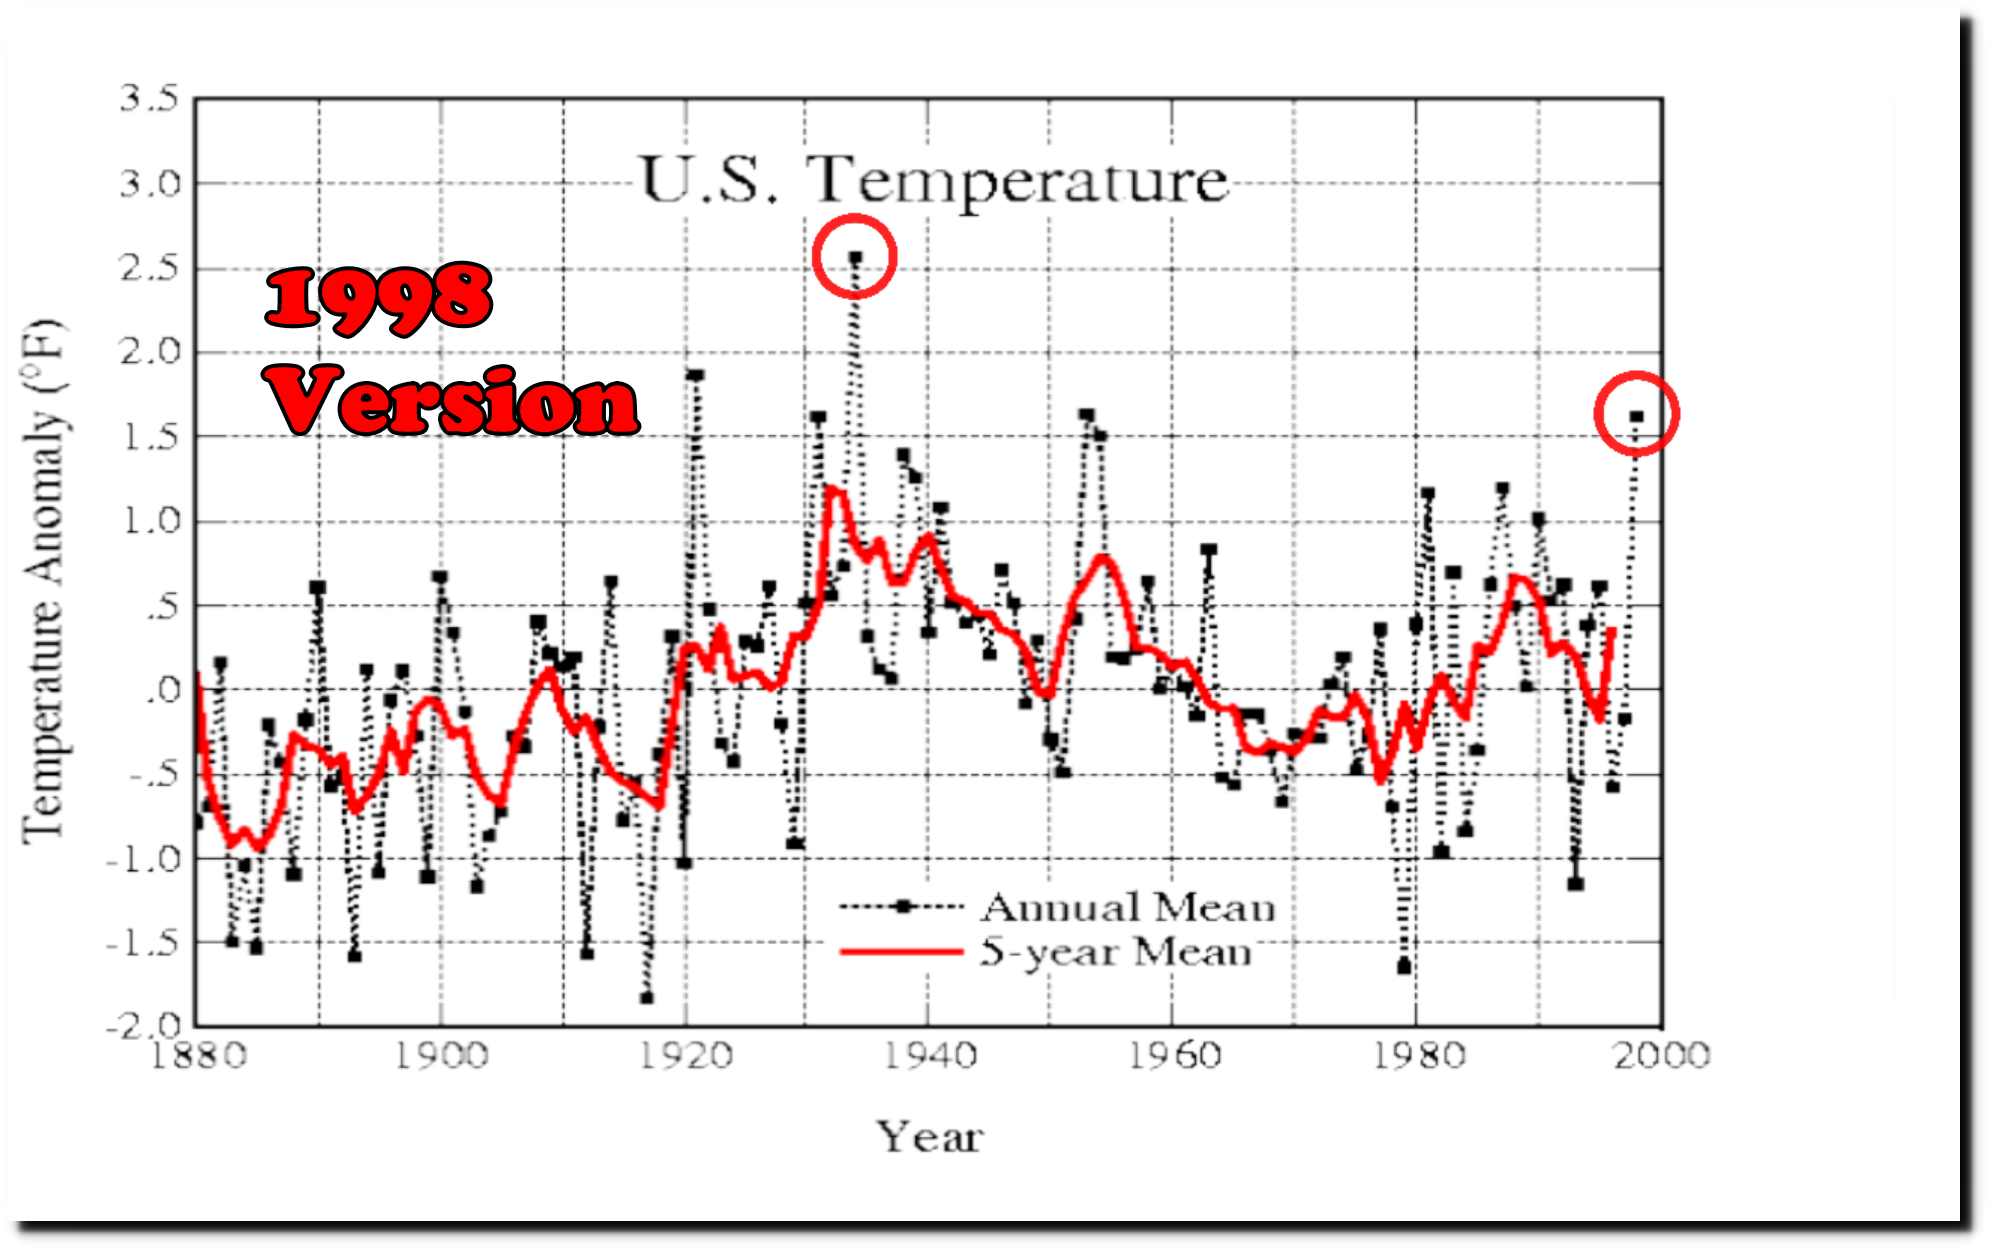
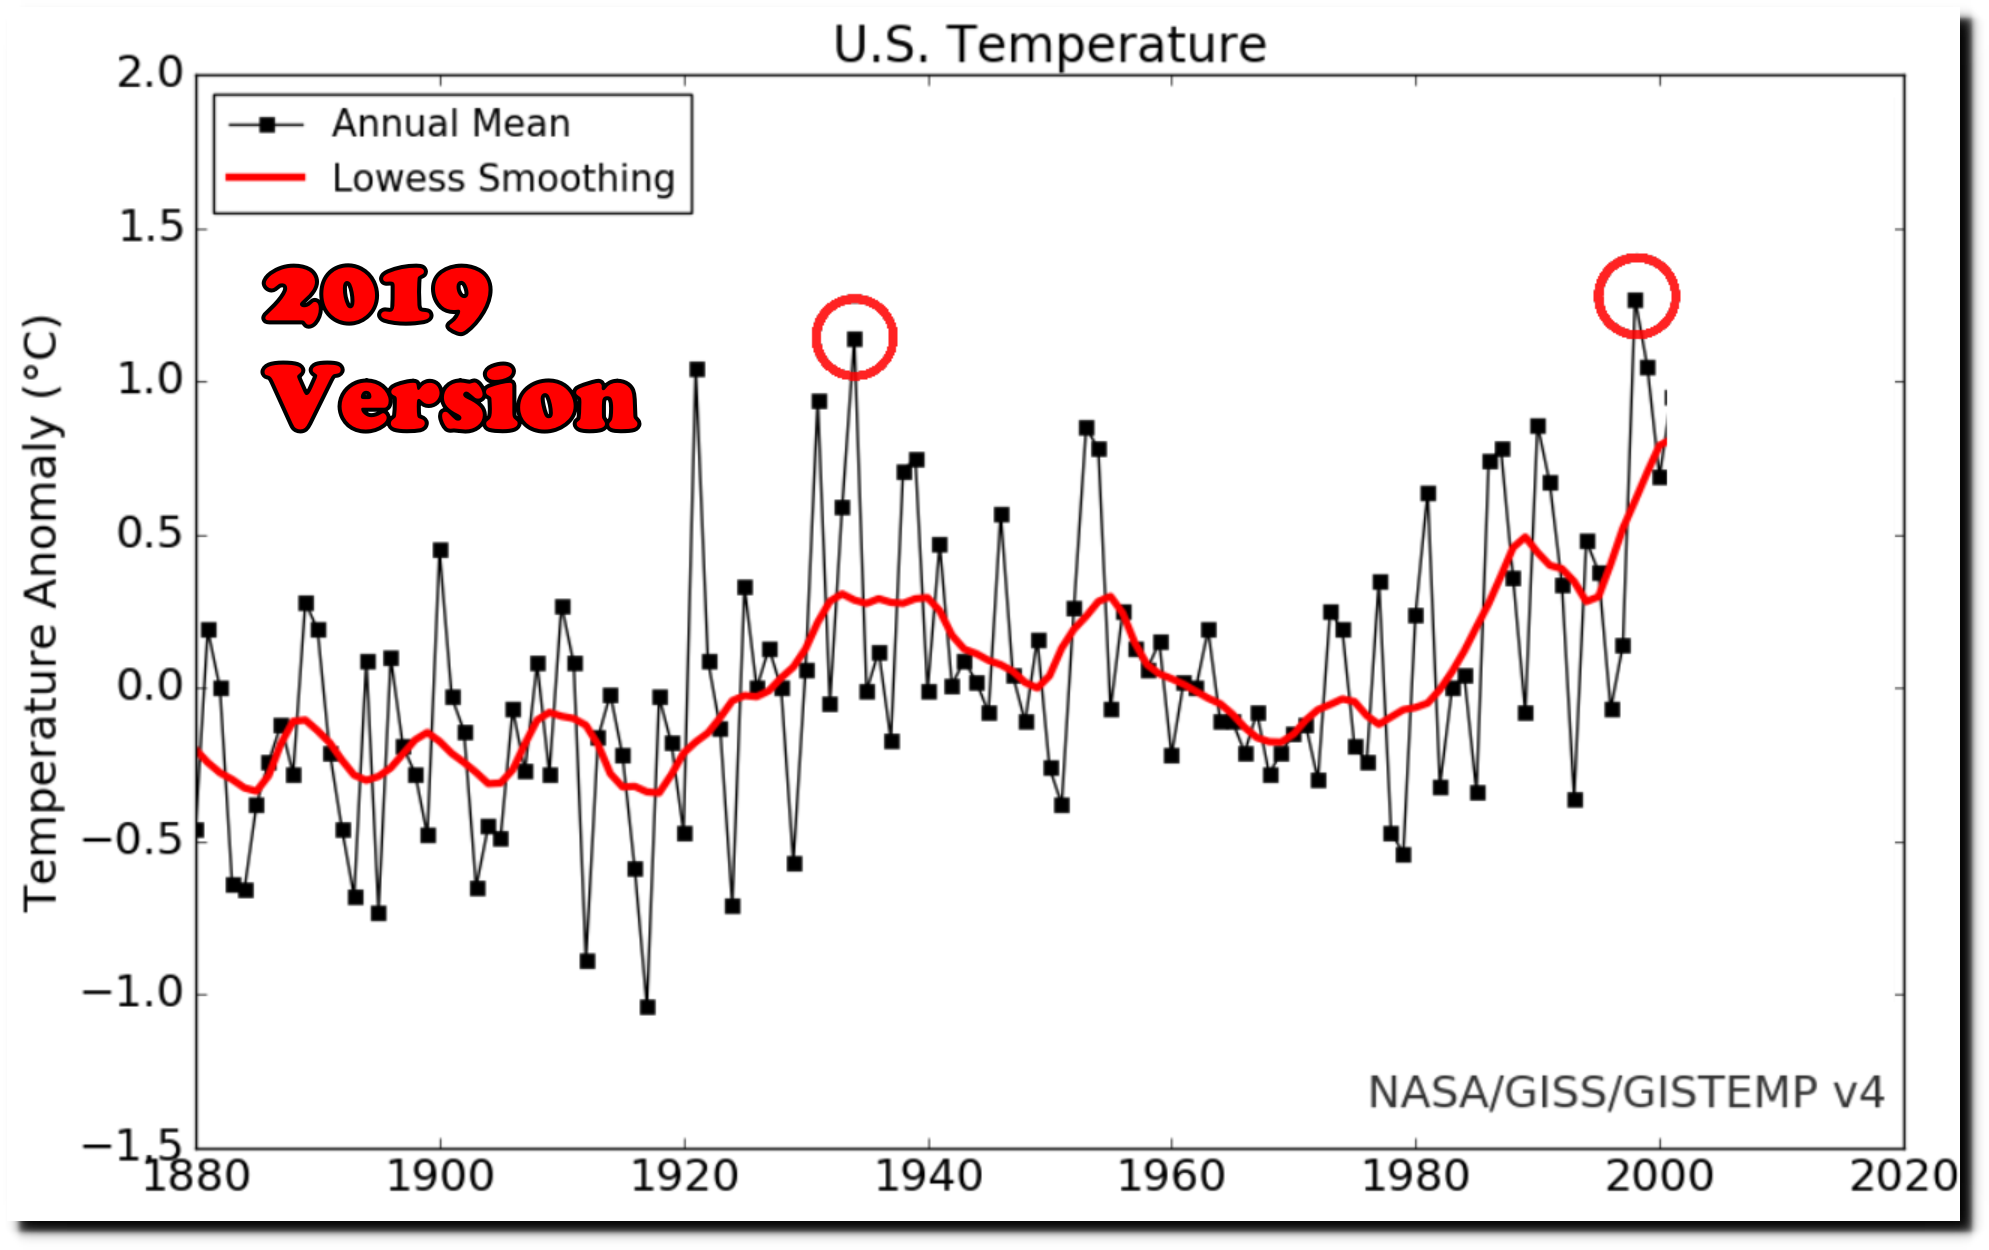
Here is a fine example...the temperature was adjusted down from the raw data in order to give the appearance of more warming than has actually happened and it completely eliminates the hot period of the 1930's (the dust bowl years) which were warmer than the present and makes them appear much cooler than the present.

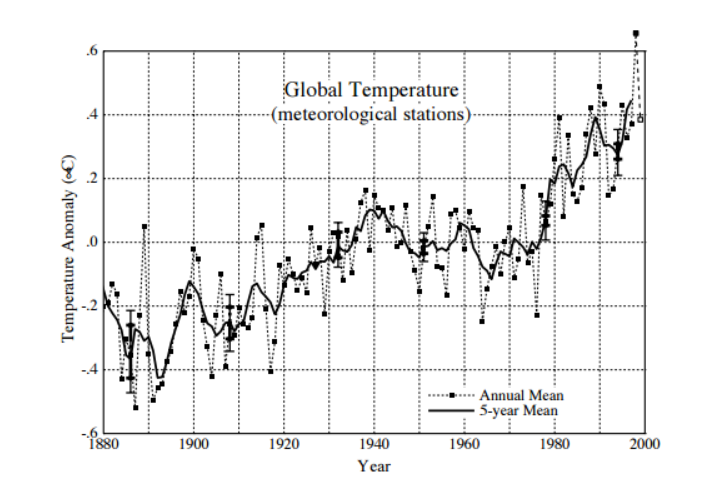
Here is another fine example of the "adjustment" happening at NASA.. Want more? There's plenty out there.
Post the source where you pulled these "graphs" from.
Lets see if you ignore these charts from PISS using THEIR source links. It is all PISS/NASA here.
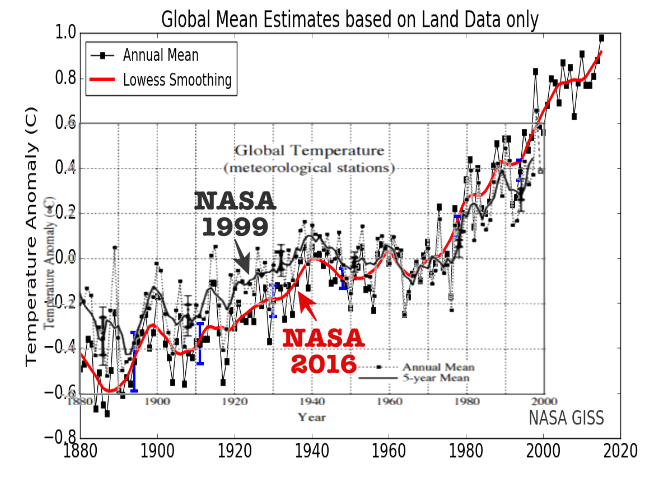
NASA 1998
NASA 2019
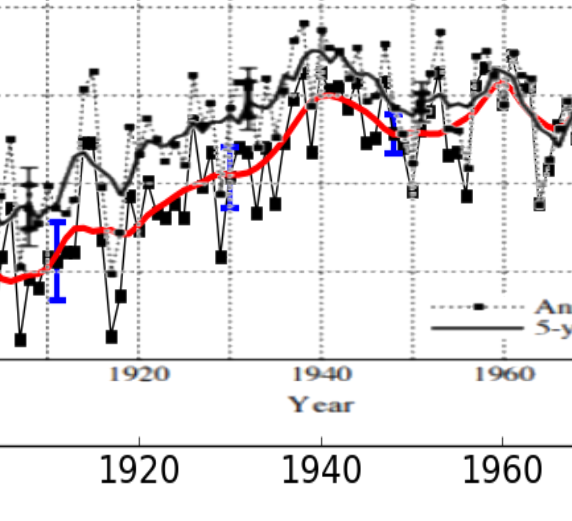
Cooling the past, warming the present is obvious here.
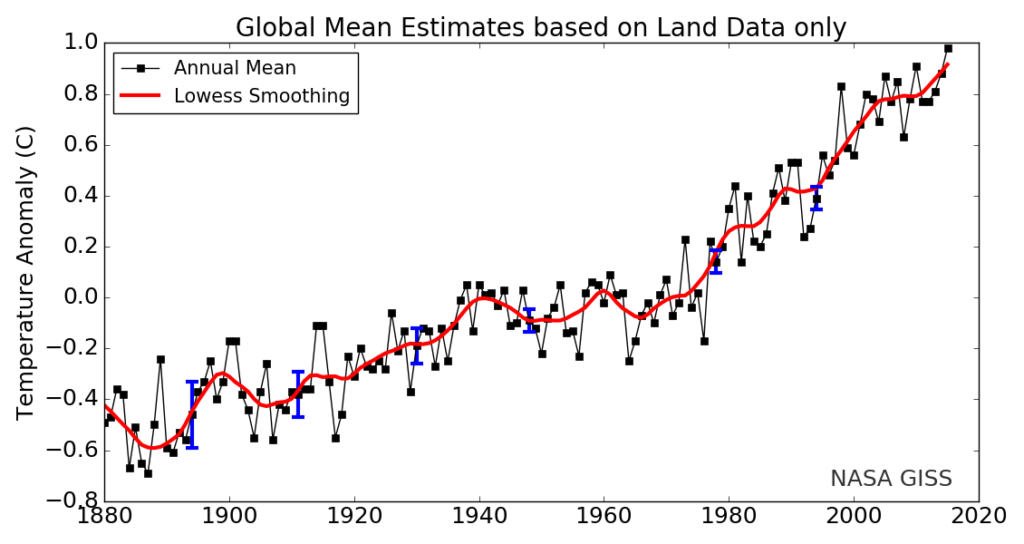
Why don't you links go back to NASA? I could post 1000's of NASA cited graphs which don't show the supposed adjustment that you claim.
Like this one

or this one.

Or this one