SSDD
Gold Member
- Nov 6, 2012
- 16,672
- 1,966
- 280
- Thread starter
- #401
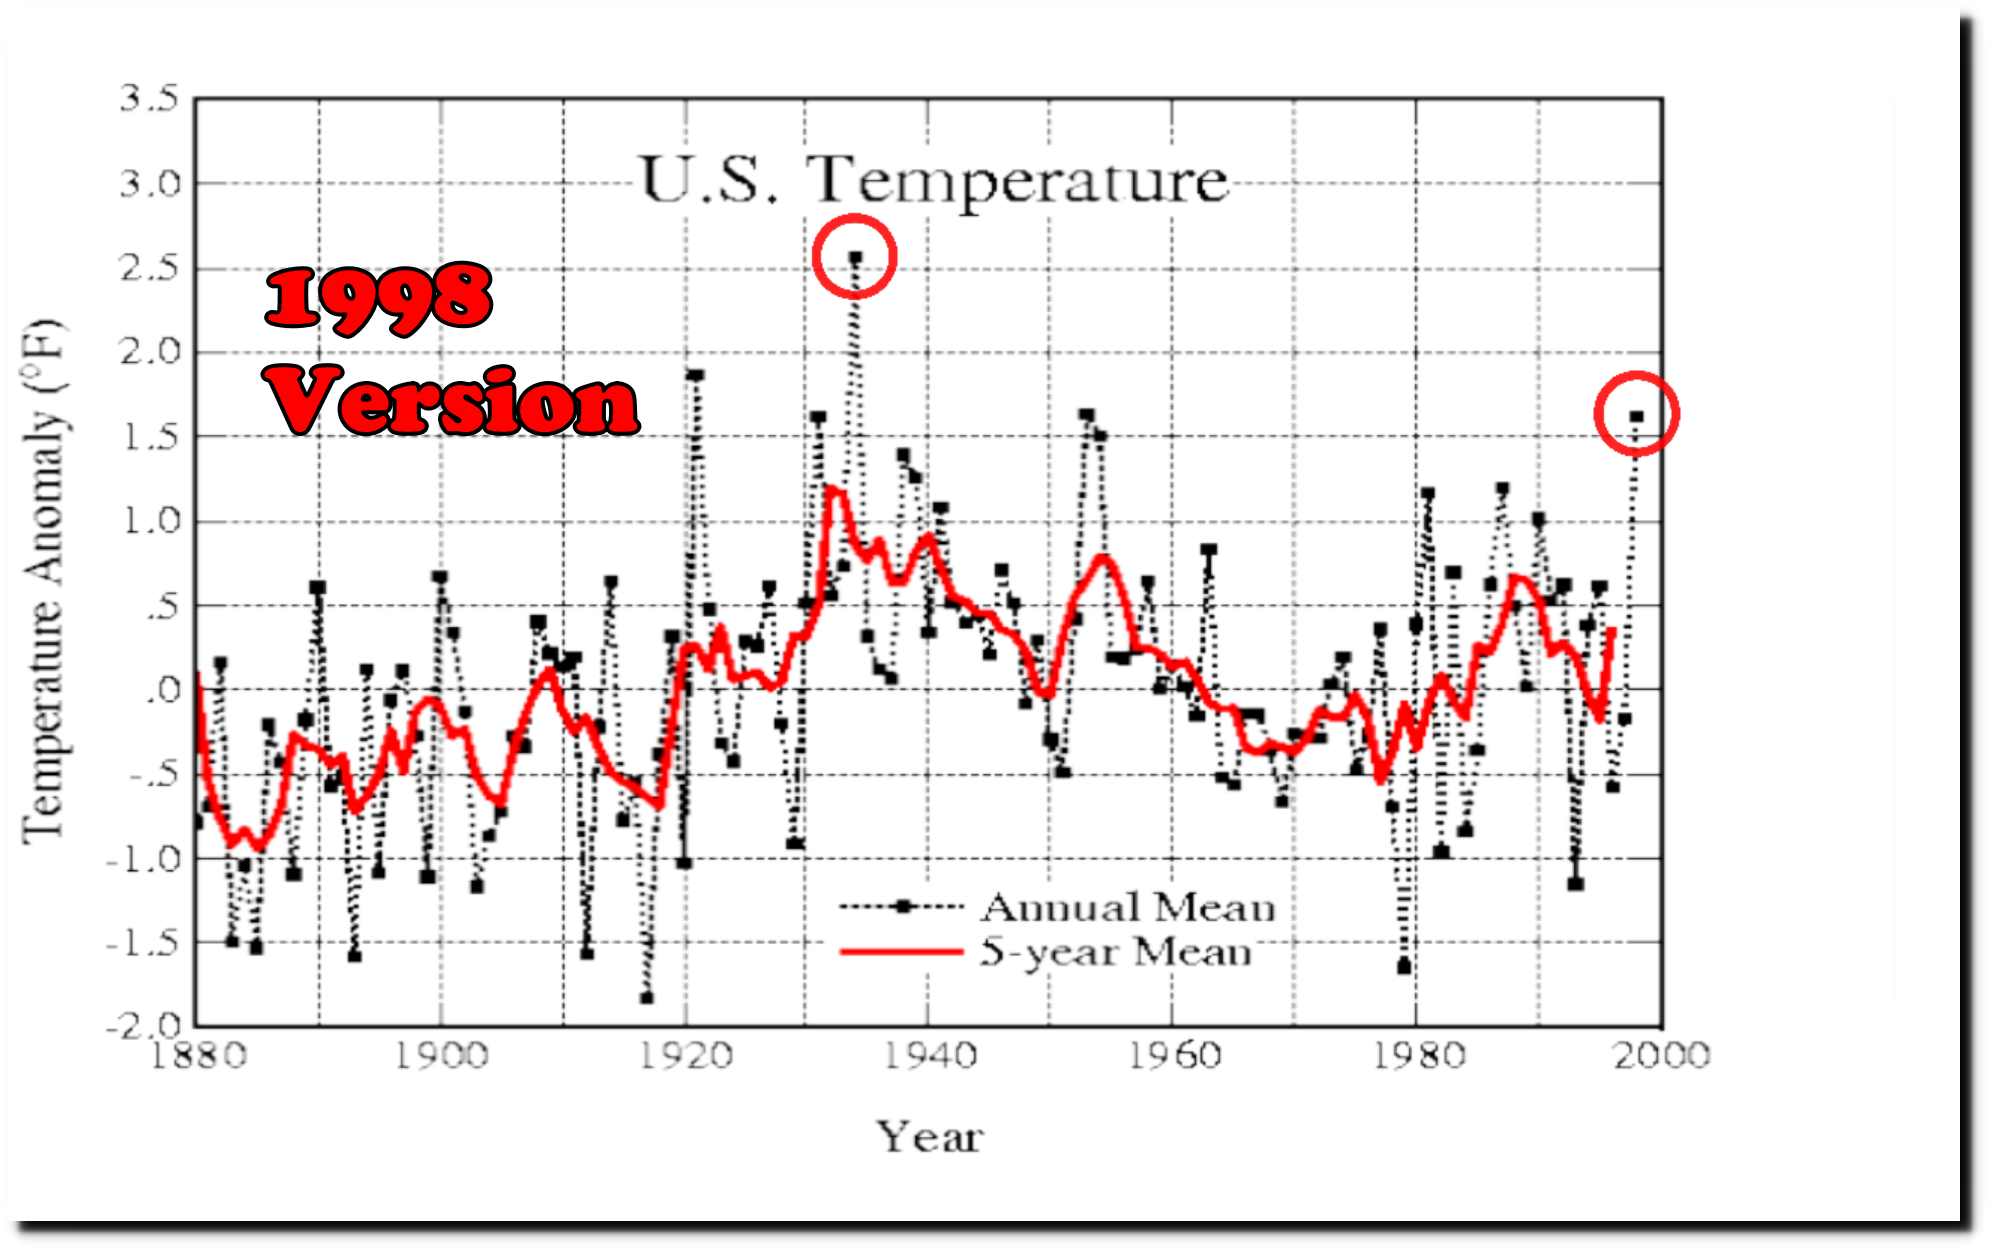
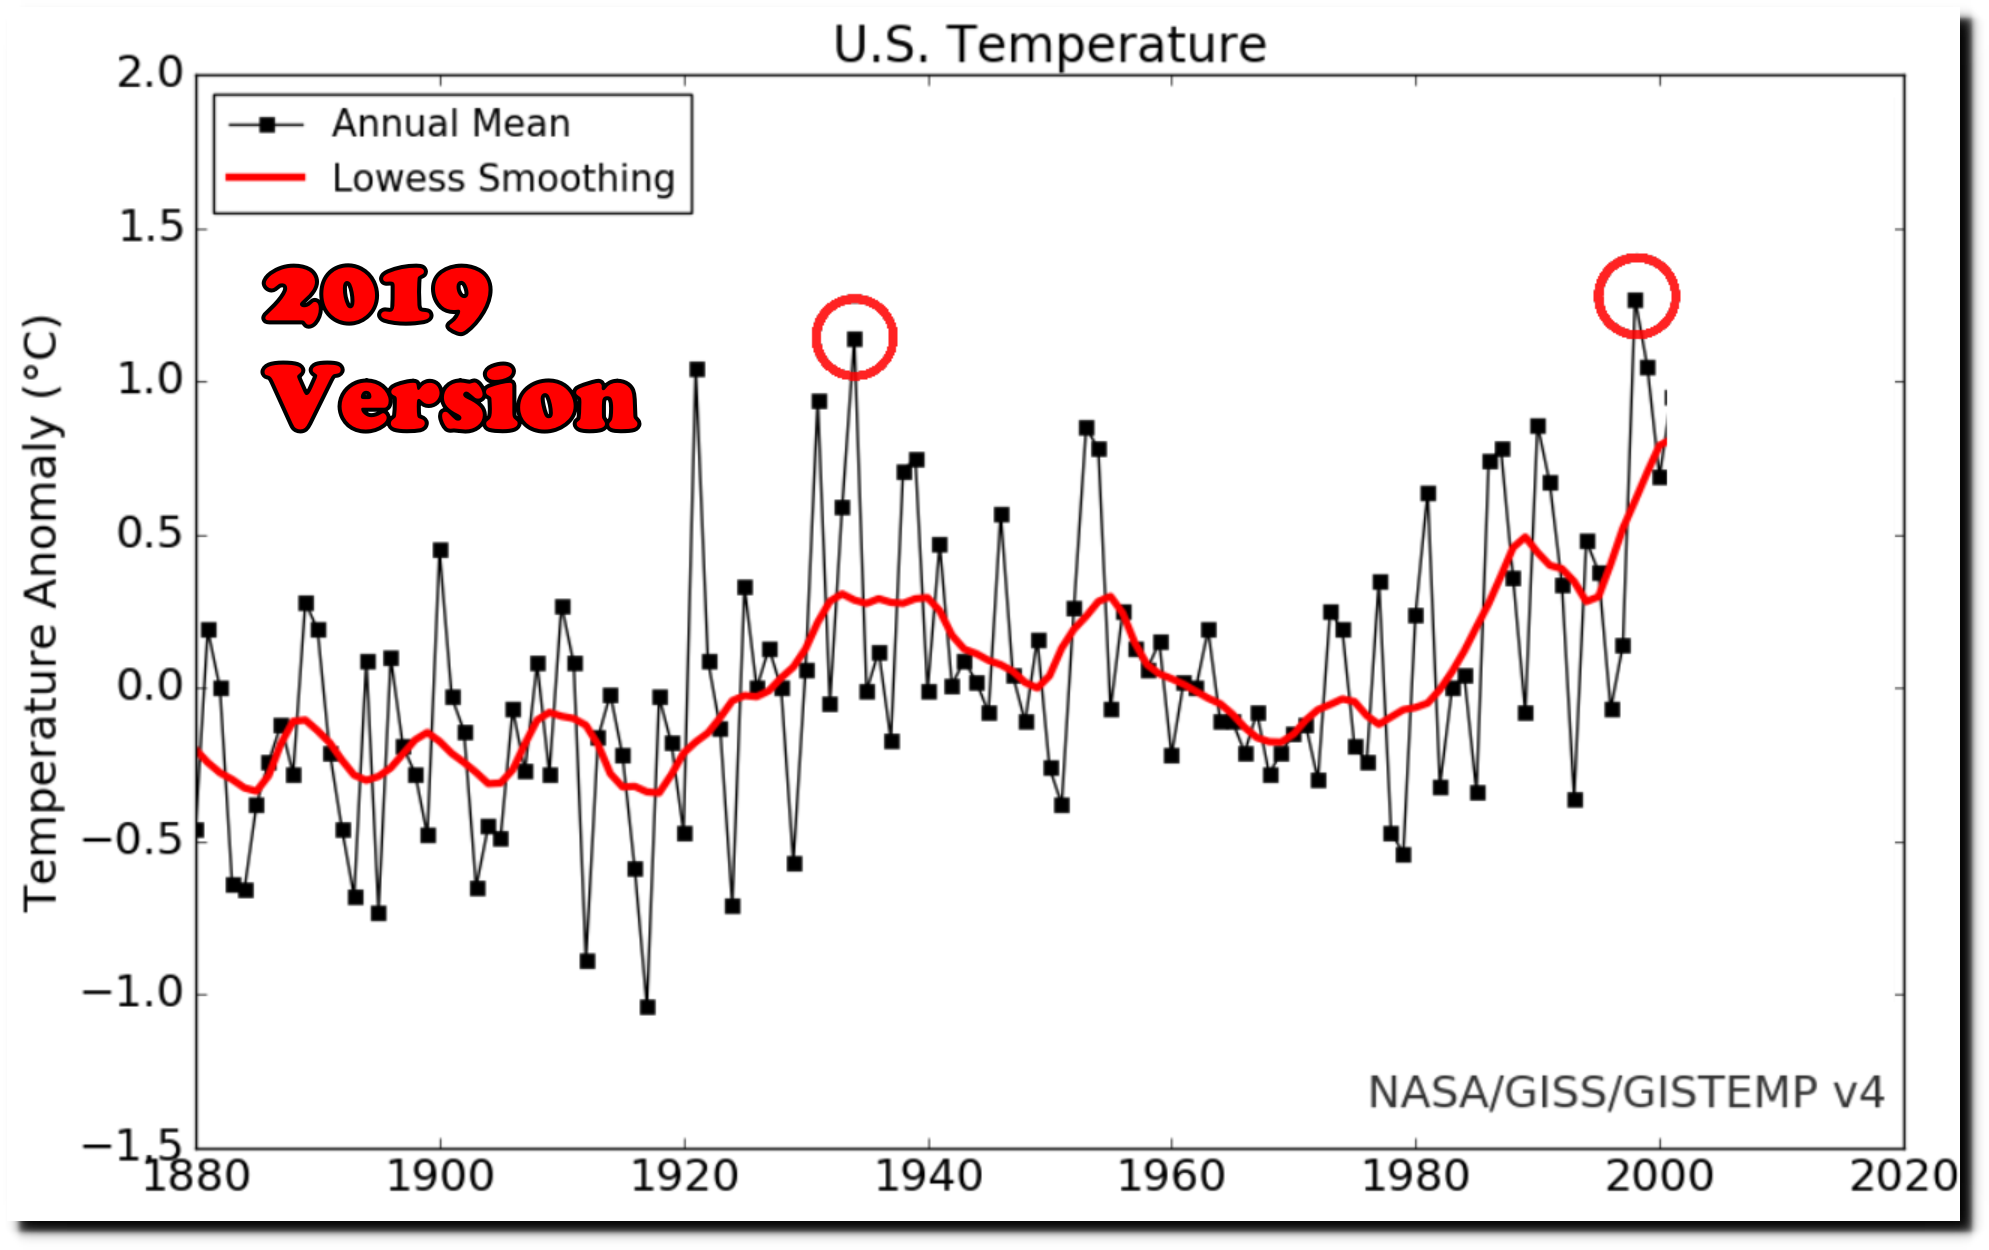
Sorry but it isn't....what's the matter...can't read a graph? If you could, you would see that the amount of change, and the rate of change have been far greater than anything we have seen multiple times over the past 10,000 years....what's the matter? Aren't you smart enough to even read a simple graph?
Your graph has modeling and adjustments, it's wrong.
Next.
So lets see some peer reviewed evidence to contradict it...mine is peer reviewed..yours was from an alarmist blog...given a choice, I will go with the peer reviewed science till some better peer reviewed science comes along...you stick with your alarmist blog...they will give you just the opinion they think you should have. No effort on your part necessary...of course it does leave you looking like a clueless idiot when you try to talk to someone who can actually provide real science to support their position, but luckily you won't be bright enough to even recognize the fact that you are taking a real drubbing in public...
You have not disproved any of the peer reviewed data that Desmog cited. You have used some cut and paste BS backed by nothing.
Actually, I disproved it all...do I expect that you would be bright enough to recognize that fact? No...not a chance in hell. You keep reading your blogs and stay just as ignorant as you are...it is precisely what you deserve.
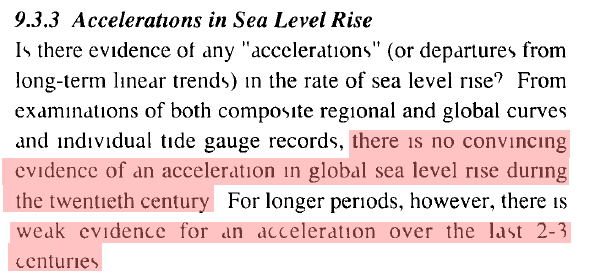
You have not disproved this peer reviewed paper from 2018.
Climate-change–driven accelerated sea-level rise detected in the altimeter era
You have NOT disproved anything from NASA.
You have offered bullshit and paraded around in a little skirt.
Of course I did...as I pointed out already:
2.8 mm per year? Not very scary...even to alarmists so again, the data is heavily massaged using inappropriate, and completely fraudulent methods to achieve a 3.3mm per year rate of increase. A global isostatic adjustment was applied which is blatantly fraudulent in the context of sea level increase. Such adjustments are correct in the context of calculating ocean depth as the sea floor sinks and have absolutely no relationship to measuring sea level by satellites. Here is what the adjustments look like...

Here is an overlay of the two graphs at the same time scale.

You are so far out of your depth (and you reside in the very shallow end of the pool) that you don't even know when your questions have been answered...The acceleration happened when they applied a global isostatic adjustment. Isostatic adjustments are used to determine if the sea floor is sinking...it has nothing to do with sea level rise... And the graphs show the effect of the adjustment...there is no acceleration in sea level rise...there is only fraudulent adjustments...which tide gages....do not agree with...