2011 global temperature thread

This thread is NOT about co2 or fraud. It is about global temperature and comparing the years with others. That is what it is. Make a new thread to discuse the fraud.

How can a thread posting tempertaure data from james hansen not be about fraud? Thats just not possible.
 
This thread is NOT about co2 or fraud. It is about global temperature and comparing the years with others. That is what it is. Make a new thread to discuse the fraud.

How can a thread posting tempertaure data from james hansen not be about fraud? Thats just not possible.


Why on earth would Hansen do something that could get him thrown in prison for the rest of his fucking life and never get to be with his grand kids...He appears to be a good person to me. This is something that I couldn't and wouldn't do.

The giss is the most complete of the surface data we have if his method works. it is far better then Hadcrat, Noaa, ect.
 
The wingnuts hate of Dr. Hansen is because he was one of the first to point out the dangers that we face because of a changing climate. And when the Bush Whitehouse tried to censure him, he went head to head with them and won. He is considered to be the leading climatologist in the US, by many, in the world.

So the baseless accusations of fraud are a constant drumbeat from the clueless wingnuts of the right. Accusations without a shred of proof, based on lies. And in the meantime, Dr. Hansen continues to research the issue, and aid others who are doing the same. He has aided much our understanding of climate, both on this planet and others.
 
This thread is NOT about co2 or fraud. It is about global temperature and comparing the years with others. That is what it is. Make a new thread to discuse the fraud.

How can a thread posting tempertaure data from james hansen not be about fraud? Thats just not possible.


Why on earth would Hansen do something that could get him thrown in prison for the rest of his fucking life and never get to be with his grand kids...He appears to be a good person to me. This is something that I couldn't and wouldn't do.

The giss is the most complete of the surface data we have if his method works. it is far better then Hadcrat, Noaa, ect.
Thats just false and I've already posted the links which discuss the flawed methodologies. gridding in land temps over water, gridding in low altitude temps over high altitude temps, the gridding process in gheneral, ignoring and tossing out data that doesn't support his claims, inserting algorythm that increase temperatures, failing to adjust satalite data for drift and obliquity, using a UHI adjustment that adjust cooler temps up instead of warmer ones down, and the general unreliability of the raw data due to station locations to begin with. he's done all of that and more, and been caught more than once. personally the NCDC, NOAA and Uah are all slightly more reliable, but they use the same flawed sources and many of the same flawed methodolgies. To be honest, there is no record that can be trusted now, they've all been compromised.
 
The wingnuts hate of Dr. Hansen is because he was one of the first to point out the dangers that we face because of a changing climate. And when the Bush Whitehouse tried to censure him, he went head to head with them and won. He is considered to be the leading climatologist in the US, by many, in the world.

So the baseless accusations of fraud are a constant drumbeat from the clueless wingnuts of the right. Accusations without a shred of proof, based on lies. And in the meantime, Dr. Hansen continues to research the issue, and aid others who are doing the same. He has aided much our understanding of climate, both on this planet and others.
and yet you can't comment at all on the science that shows he's not. Sorry dude, hansen is a fraud and he's been taken to school by spencer more than once for his errors.
 
Temperature in Maine tonight................


minus 50

Maine news, sports, politics and election results and obituaries — Bangor Daily News


tell those folks about CO2 levels!!!:fu::fu::fu::fu::fu::fu:

Weather Forecast: Iqaluit, Nunavut - The Weather Network
Current Weather Updated: Tues, Jan. 25, 2011, 0:00 EST - Iqaluit Airport
-30°C
* Feels Like: -49
* Wind: NW 48km/h
* Sunrise: 8:32
* Sunset: 15:01

* Relative Humidity: 61%
* Pressure: 100.79 kPa
* Visibility: 2.4 km
* Ceiling: 600 ft
Your Weather: 80 kph - The Weather Network

Icebreaker prepares to evacuate last ship from ice trap in Sea of Okhotsk | Russia | RIA Novosti
Icebreaker prepares to evacuate last ship from ice trap in Sea of Okhotsk
Topic: Rescue operation in Okhotsk Sea
162107653.jpg

162171426.jpg


The Bereg Nadezhdy ship, the Professor Kizevetter research vessel, and the Sodruzhestvo, carrying altogether over 400 people, got stuck in two-meter-thick ice in the Sea of Okhotsk on December 31. Two other ships, the Mys Yelizavety and the Anton Gurin, became trapped a few days later.

The Admiral Makarov released the Professor Kizevetter and the Mys Yelizavety vessels from the ice trap, while the Anton Gurin managed to cope on its own. The Bereg Nadezhdy has been successfully towed to clear water on Monday.
Meteorologists have predicted worsening weather conditions over the next two days in Russia's Far East Sea of Okhotsk, where an operation to release Russian fishing vessel trapped in ice is ongoing.

The Sodruzhestvo mother fishery ship, with 348 crew members on board, has been trapped in two-meter-thick ice in the Sea of Okhotsk since December 31. It got stuck together with four other ships, three of which were later released by the Krasin and the Admiral Makarov icebreakers.

http://www.theweathernetwork.com/weather/camb0244
current Weather Updated: Mon, Jan. 24, 2011, 23:00 CST - Winnipeg Airport
Winnipeg, MB Partly cloudy

-17°C

* Feels Like: -24
* Wind: S 11km/h
* Sunrise: 8:11
* Sunset: 17:11

* Relative Humidity: 92%
* Pressure: 101.82 kPa
* Visibility: 24.0 km
* Ceiling: 11000 ft
233

http://text.meteo.gc.ca/forecast/city_e.html?nu-21&unit=m
Issued: 8:39 PM EST Monday 24 January 2011
Blizzard warning in effect.

Tonight:
Light snow and blowing snow. Blizzard developing after midnight. Wind northwest 50 km/h gusting to 70. Low minus 33. Extreme wind chill minus 53.

Tuesday:
Blizzard. Wind northwest 70 km/h gusting to 90 diminishing to 50 gusting to 70 early in the afternoon. High minus 26. Extreme wind chill minus 50.

Tuesday night:
Blizzard ending near midnight then clearing. Wind northwest 50 km/h gusting to 70 diminishing to 30 after midnight. Low minus 31. Wind chill minus 44.

Wednesday:
Sunny. High minus 27.

Thursday:
Sunny. Low minus 29. High minus 26.

Friday:
Sunny. Low minus 30. High minus 27.

Saturday:
Sunny. Low minus 31. High minus 26.

Sunday:
Sunny. Low minus 34. High minus 29.
Historical Data
Normals
Max: * -24°C
Min: * -32°C

Historical low =-32 Celsius, Today`s Temp. in Iqaluit = minus 30 C So I guess it has "warmed up" in Iqaluit.

http://wiki.answers.com/Q/What_is_the_Scientific_reason_why_igloos_don%27t_melt
What is the Scientific reason why igloos don't melt?
In the middle of an igloo, a shallow saucer burns seal blubber for heat and light. A high wood fire might melt the structure. But this wide, low blaze and the inhabitants' body heat keep the igloo relatively warm - between 45 and 60 degrees, experts say. That's not bad, considering it can be 40 degrees below zero outside.

Or maybe it`s because the CO2 from burning blubber is not the same as from my SUV...???
 
Last edited:
So is the current weather in Canada just a glitch ?...or was it any better before:

CBC News - Manitoba - Winter takes another swing: record lows set in province
Winter takes another swing: record lows set in province
Last Updated: Thursday, February 26, 2009 | 3:23 PM CT
CBC News
A cold snap that gripped Manitoba this week has pushed temperatures in some parts of the province into record-low territory.

The overnight mercury in Island Lake, Swan River and Thompson dropped to bone-chilling levels.

Island Lake, about 500 kilometres northeast of Winnipeg, dropped to –39.6 C, beating the old record for the day of –39.4 C, set in 1972.

Swan River, about 500 kilometres northwest of Winnipeg, sank to –35.7 C. The old record, set in 1962, was –33.9 C.

And in Thompson, 770 kilometres north of Winnipeg, the temperature was –42.6 C. The old record was –41.4 C in 1985.

The province's capital city was better off, but not by a lot. It was –22 C overnight (it felt like –34 C with the wind chill) and the temperature never got warmer than that throughout the day on Thursday. In fact, it felt like –38 C with the wind chill.

According to CBC meteorologist John Sauder, Manitobans will have to bundle up for the next few days as well.

Record low temperatures for October 12 set across Southwest Saskatchewan - Local - News - The Southwest Booster
Record low temperatures for October 12 set across Southwest Saskatchewan

October 12 brought record low temperatures to seven communities across the Southwest.

Topics :
Southwest Saskatchewan , Val Marie , Swift Current

Val Marie recorded the lowest temperature with a -15 Celsius which beat their old record of -10.5 C set in 2002.

Swift Current ended up with a low of -13 C which eclispes the previous low for October 12 set in 2006 of -9.6 C.

Other record setters were Cypress Hills and Leader at -13 C, Shaunavon and Eastend at -12 C and Maple Creek at -9 C.

Published on October 12th, 2009

So were 2006,2008, and 2009 a freak Years?...
http://www.theweathernetwork.com/your_weather/details/620/3850483/3/camb0227/plpcities/?ref=ugc_city_thumbs

Thompson Manitoba
Your Weather: BITTER COLD

Thompson, Manitoba // Shot: January 17, 2011

233

That looks a lot more like a trend, than these stupid graphs "environmental Scientists" publish in the press


As if anybody here would believe this "increasing average temperature" CRAP!
 
Last edited:
yay we are heading towards a ice age. wahoo!!!

Wahoo...
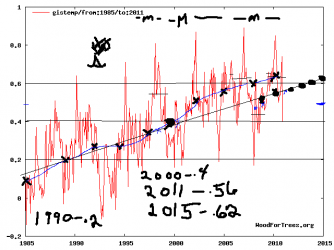
what the fuck is that supposed to represent:
2011 .56
2012 .575
2013 .590
2014 .595
2015 .62............?
12717d1295940106-2011-global-temperature-thread-to-2011.png

If You assholes would really have serious data to represent it would be where the isothermal lines for the yearly average temperatures were and it would look like this:
63363.png


and not like this pitiful "deck of cards" You keep showing here,
You jerks can`t even produce one single area assigned to Your idiotic numbers with 1 single isotherm line!...and for your simpleton trend analysis to be valid there should be isotherm increments with no more than the lowest stupid number in your stupid little list, else you have NO BUSINESS posting fractional numbers of degrees here!
But none of you morons have ever produced such data with even 10 deg C steps!

I'm putting the cards on the table:
2011 .56
2012 .575
2013 .590
2014 .595
2015 .62

You are 47 cards short of a full deck!
 
Last edited:
yay we are heading towards a ice age. wahoo!!!

Wahoo...
what the fuck is that supposed to represent:
2011 .56
2012 .575
2013 .590
2014 .595
2015 .62............?

If You assholes would really have serious data to represent it would be where the isothermal lines for the yearly average temperatures were and it would look like this:
63363.png


and not that pitiful "deck of cards" You keep showing here, You are 47 cards short of a full deck!

:lol::lol::clap2::eusa_boohoo::fu::ssex::alcoholic::laugh2::rock::poop::poke::party: hehehe
 
Last edited:
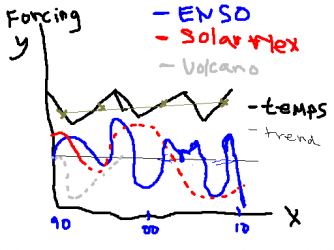
Idiot, that graph shows the super nino in 1998 with the rising solar max from 1997-2005...

2002-2006 was nearly positive enso from .1c to 1.2c within 3.4...So no nina to drop the temperature...deepest solar minimum since 1909-1912 from 2006-2010. This only flattens it. Enjoy your night asshole!:lol::eusa_boohoo::fu: :fu: :boobies: :boobies: :boobies: :boobies::boobies::boobies: :boobies: :boobies: :boobies: :boobies: :boobies: :boobies: :boobies: :boobies: :boobies: :boobies::boobies: :boobies::boobies::ssex: :ssex: :ssex: :ssex: :ssex: :ssex: :laugh2::laugh2::laugh2::laugh2::rock::rock::rock::rock::rock::rock::rock::laugh::laugh::laugh: :anj_stfu::anj_stfu: :anj_stfu: :anj_stfu: :ahole-1::ahole-1::ahole-1::ahole-1::ahole-1::ahole-1::ahole-1::ahole-1::ahole-1::ahole-1::ahole-1::poop::poop::poop::poop:
 
Last edited:

Okay...I had no idea I was talking to an expert here:
retarded_medic.jpg


Now that I know, there should not be any trouble to be a little more specific what the least thing I`ld expect to see than 5 little retard numbers.
This is what I`m after:
Normal distribution, which is a Gaussian function


Because when Bill Gates walks into a bar, by no means did that raise the AVERAGE INCOME OF THE PATRONS

Nice pic of your self, dude.:lol:
 
Idiot, that graph shows the super nino in 1998 with the rising solar max from 1997-2005...

2002-2006 was nearly positive enso from .1c to 1.2c within 3.4...So no nina to drop the temperature...deepest solar minimum since 1909-1912 :

Holy fuck, this idiot actually thought I was talking about a specific date and temperature, because I randomly picked a Google picture for him what an isotherm looks like and somewhere his squinty eyes seen a date on it!

Do You like this one better it has pretty colors instead of numbers:
images


Maybe Your mommy knows a good Therapist fro you, but I`m sure You`ld refuse a date The Rapist or perhaps it was the other way around which would explain a lot what you are writing here.
 
Last edited:
Hmm....... So we are in a major cold spell. But the arctic ice is still well below normal.
http://nsidc.org/data/seaice_index/images/daily_images/N_stddev_timeseries.png

And we have a negative anamoly for the Arctic Ice Pack.

http://arctic.atmos.uiuc.edu/cryosphere/IMAGES/seaice.anomaly.arctic.png

Of course the Antarctic is positive, correct? Oops.
http://arctic.atmos.uiuc.edu/cryosphere/IMAGES/seaice.anomaly.antarctic.png

Last year, you folks were blabering about the record winter, and 2010 ended up on every one's charts as either equal to or warmer than 1998. And the ice in the Arctic was at the third lowest extent.

http://arctic.atmos.uiuc.edu/cryosphere/IMAGES/seaice.area.arctic.png

Of course we know that all them thar pointy headed librul scientists couldn't find their asses with both hands. Ananamous posters on an internet message board are so much more intelligent.

They believe this to be a fraud and wouldn't except any of it as true. A faggot like Polar bear at least wont and will keep pointing at north America, which is below normal, but is being caused by a weather pattern. The arctic has warmed 1c in areas in the last decade. But some people just wish to shit on science because they believe that everyone that is on the other side is some kind of lier and idiot.

I'm fucking sick of hearing the trash that comes out of your mouth to then find out it was a lie and these scientist didn't do anything wrong .. If it is a fraud then prove it already and if not Shut the fuck up. Just like the ice age crap. I think this polar bear cock sucker is one sad little piece of dog shit. He thought he could just attack and throw crap at me and not get it back. Grow a pair mother fucker or get out of the kitchen.:evil:

FUCK WEATHER, Climate don't=it.
 
Last edited:
Hmm....... So we are in a major cold spell. But the arctic ice is still well below normal.
http://nsidc.org/data/seaice_index/images/daily_images/N_stddev_timeseries.png

And we have a negative anamoly for the Arctic Ice Pack.

http://arctic.atmos.uiuc.edu/cryosphere/IMAGES/seaice.anomaly.arctic.png

Of course the Antarctic is positive, correct? Oops.
http://arctic.atmos.uiuc.edu/cryosphere/IMAGES/seaice.anomaly.antarctic.png

Last year, you folks were blabering about the record winter, and 2010 ended up on every one's charts as either equal to or warmer than 1998. And the ice in the Arctic was at the third lowest extent.

http://arctic.atmos.uiuc.edu/cryosphere/IMAGES/seaice.area.arctic.png

Of course we know that all them thar pointy headed librul scientists couldn't find their asses with both hands. Ananamous posters on an internet message board are so much more intelligent.

Good effort! At least that was way better than anything else which came so far from "Mathew".
But You left a "minor detail" unmentioned, either in purpose or You did not do Your homework. It`s not that hard to find the source of Your information. All it takes is to saw off the tail end of Your picture links and then it`s possible to track it back right to the original publication:
Advanced Data Search

And that has long since been discussed. And again it turned out to be a dud:

Arctic Sea Ice 2007
t is important to keep in mind the fact that consistent observations of the Arctic sea ice and related conditions have only been made since 1979 when satellite observations began.
[B]NASA reported (Oct 2007) [/B][http://www.nasa.gov/vision/earth/lookingatearth/quikscat-20071001.html]: “the rapid decline in winter perennial ice the past two years was caused by unusual winds. "Unusual atmospheric conditions set up wind patterns that compressed the sea ice, loaded it into the Transpolar Drift Stream and then sped its flow out of the Arctic," he said. When that sea ice reached lower latitudes, it rapidly melted in the warmer waters.”

NASA Earth Observatory (Dec 2007) reported [http://earthobservatory.nasa.gov/Newsroom/NasaNews/2007/2007121225985.html]: “Using data from CloudSat and NASA’s Cloud-Aerosol Lidar and Infrared Pathfinder Satellite Observation satellite, they found the total cloud cover over the western Arctic, where most of the ice loss occurred, was 16 percent less over the 2007 melt season than in 2006. The resulting clearer skies in 2007 heated the Arctic surface enough to warm ocean waters by 2.4 degrees Celsius (four degrees Fahrenheit) or enough to melt 0.3 meters (one foot) of sea ice.”

And this is what You left out...had skeptics done it, You`ld call it "cherry picking"
So go on and claim all this can happen with an "increase" from 0.035% to 0.0389 % "moisture corrected molar concentration" Carbondioxide...which would by the way be 10% lower if they would publish "ACTUAL" concentration!

And at the same time when the temp trend in the arctic goes down for several years you guys start screaming foul and CHERRY pick out data like that:
Climate Prediction Center: ENSO Diagnostic Discussion
A moderate-to-strong La Niña continued during December 2010 as reflected by well below-average sea surface temperatures (SSTs)

Have YOU ever taken the trouble to see for yourself how little Infrared .0389 % Carbondioxide absorbs...IT IS NOT EVEN POSSIBLE TO MEASURE THAT WITH THE BEST IR SPECTROPHOTOMETER THERE IS!
and you run around repeating what idiots who can`t even measure that tell You the difference of 0.004 % absorbs enough energy to heat the planet!

I have done a lot of IR Spectroscopy sport, and I do know what crock of shit all this is:
7-most-terrifying-global-warming.jpg


And assholes like the "scientists" You quote take the difference between 0.035% and 0.039% moisture "corrected molar CO2 concentration" and say that`s an:
INCREASE OF:

co2-model-exponential-3.gif

Maybe this will make You happy, but "Global warming scientists" had nothing to do with it:
http://www.spiegel.de/auto/aktuell/0,1518,741509,00.html

VW-Aufsichtsratschef Ferdinand Piëch ist ein Mann von eisernem Willen. Was sich der 73-Jährige in den Kopf setzt, .....
Durchschnittsverbrauch von 1,49 Liter je 100 Kilometer auf. Doch jetzt folgt auf der Automesse im Emirat Katar die Enthüllung eines weiterentwickelten Fahrzeugs: des XL 1. Mit einem Verbrauch von 0,9 Litern feiern die Wolfsburger den neuen Spartyp als "effizientestes Auto der Welt".
image-173130-panoV9-jtvw.jpg

It`s a new VW that uses 0.9 liters of gas per 100 kilometers
 
Last edited:
I`ll try and explain it to you one more time as I already have explained it to you in all the other GW realted threads in this forum to no avail!
This is how IR spectroscopy works:
2beam_spectrophotm.gif


If you want to show how much infrared CO2 absorbs you have to run 1 beam from the radiation source through the sample and another one from the source which does not
run through the sample and then compare them.
And all You know then is how much, actually or how little IR CO2 absorbs and that is only one narrow line in the entire infrared region...!
I explained all that to you already!
All the other infrared goes right by CO2..
.
and it`s like saying if you stand under a hydro line it won`t rain on you if you forget, that CO2 absorbs only this line.
I also showed you already an infrared scan of air that contains moisture and if you had a few blinking brain cells you should have noticed that H2O grabs almost all the Infrared over the ENTIRE spectrum.

So even if NASA had a IR spectrophotometer that could run one infrared beam from 1 Satellite to the earths surface ~ 1200 kilometers and a second IR beam to a second satellite at a distance of exactly the same 1200 km where would they find a path through the atmosphere to the surface where the humidity is 0% for the entire path length?...
To measure how much the earth is being heated by what + 0.004 % CO2 can absorb and then only at the spectral lines where it does absorb

Fuck, even he would have comprehended that by now:

mind-me.jpg
 
Idiot, that graph shows the super nino in 1998 with the rising solar max from 1997-2005...

2002-2006 was nearly positive enso from .1c to 1.2c within 3.4...So no nina to drop the temperature...deepest solar minimum since 1909-1912 from 2006-2010. This only flattens it. Enjoy your night asshole!:lol::eusa_boohoo::fu: :fu: :boobies: :boobies: :boobies: :boobies::boobies::boobies: :boobies: :boobies: :boobies: :boobies: :boobies: :boobies: :boobies: :boobies: :boobies: :boobies::boobies: :boobies::boobies::ssex: :ssex: :ssex: :ssex: :ssex: :ssex: :laugh2::laugh2::laugh2::laugh2::rock::rock::rock::rock::rock::rock::rock::laugh::laugh::laugh: :anj_stfu::anj_stfu: :anj_stfu: :anj_stfu: :ahole-1::ahole-1::ahole-1::ahole-1::ahole-1::ahole-1::ahole-1::ahole-1::ahole-1::ahole-1::ahole-1::poop::poop::poop::poop:


Real science experiments with artificial Intelligence, but I begin to wonder if perhaps they also experiment with artificial stupidity and people like you are the lab rabbits.

Although I am now fully aware just how stupid you are I shall make a sincere effort to remedy your handicap:

beerlambert1.gif


by the way that is ABSORBANCE, not absorption!
because with absorption (=%!) measurements of this "catastrophic greenhouse gas" effect it looks like this, when REAL SCIENTISTS
who know how to operate an infrared Spectrophotometer compare their findings with these "scientists":

gore-freezing.jpg


The Climate Catastrophe - A Spectroscopic Artifact

The Climate Catastrophe
- A Spectroscopic Artifact?

by Dr. Heinz Hug

Laboratory measurements of the infrared absorption of carbon dioxide using an FT-IR spectrometre suggest that the radiative forcing for CO2 doubling must be much less than assumed by climate scientists until now. A reduction factor of 80 is likely.
To check for this we hyothesized that we can omit the decadic extinction increase above E = 3 (or T = 10-3) for CO2 doubling. For this case we took the total integral of the bands till the ends of the R- and P-branch with E = 0 for the computed transmission spectrum of the whole atmosphere prepared from digitally recorded spectral measurements. Fig 2 shows in principle - not in correct proportion - how the band edges were integrated.
hug2.gif

We integrated from a value E = 3 (above which absorption deems negligible, related to the way through the whole troposphere) until the ends (E = 0) of the R- and P-branch. So the edges are fully considered. They start at 14.00 µm for the P-branch and at 15.80 µm for the R-branch, going down to the base line E=0. IPCC starts with 13.7 and 16 µm [13]. For the 15 µm band our result was:
Crucial is the relative increment of greenhouse effect . This is equal to the difference between the sum of slope integrals for 714 and 357 ppm, related to the total integral for 357 ppm. Considering the n3 band alone (as IPCC does) we get

(9.79*10-4 cm-1 - 1.11*10-4 cm-1) / 0.5171 cm-1 = 0.17 %
Conclusions

It is hardly to be expected that for CO2 doubling an increment of IR absorption at the 15 µm edges by 0.17% can cause any significant global warming or even a climate catastrophe.

Not that there is any hope in hell you will quit publishing your I.Q. levels here:
Mathew:
2011 .56
2012 .575
2013 .590
2014 .595
2015 .62
I'm putting the cards on the table
.
 
Last edited:

Forum List

Back
Top