Arctic ice thins dramatically

N_stddev_timeseries.png

A right click on the graph shows the source as :
[COLOR="Red"]http://nsidc.org/data/seaice_index/images/daily_images/N_stddev_timeseries.png[/COLOR]
So the original source for this graph image was nsidc.org National Snow and Ice Data Center (NSIDC)
The secret to creativity is knowing how to hide your sources.
Albert Einstein"


and @ NSIDC they freely discuss the problems they had (amongst themselves) , these problems are quite common, but not very often disclosed
http://nsidc.org/pubs/special/5/index.html[/COLOR]]NSIDC Special Report 5: Intercomparison of DMSP F11- and F13-derived Sea Ice Products
The SSM/I instrument as flown on the DMSP spacecraft is a seven channel, four frequency, linearly polarized, passive microwave radiometric system that records emitted energy at 19.3, 22.2, 37.0 and 85.5 GHz. The SSM/I data used here were processed at the National Snow and Ice Data Center in Boulder, Colorado. The final product is a series of daily maps of brightness temperatures for the Northern and Southern hemispheres, gridded into 25 km by 25 km pixels for the 19, 22, and 37 GHz channels, and 12.5 km by 12.5 km pixels at 85 GHz (NSIDC 1996). Since in high latitudes multiple orbit crossings occur over some locations, each pixel consists of an average of all orbit swaths during a 24-hour period.

For the months of May through September 1995, a common data set for the two different SSM/I instruments is available. As indicated in Table 1, the orbit configurations and equator crossing times between F11 and F13 are quite similar, so a reasonable assumption is that any differences between the F11 and F13 brightness temperatures are due primarily to sensor calibration. However, initial examination of the overlapping data showed considerable scatter on specific days. Closer examination of the data for these days indicates that this scatter is due to differences over open ocean areas, resulting from missing orbits in the F11 data. Over such areas, the varying effects of weather over the 24-hour averaging period are substantial enough to introduce considerable differences in the daily averages for F11 and F13. This problem does not affect the systematic sensor-related differences we are considering here, so a visual inspection of brightness temperature scatter plots was used to exclude days with particularly large scatter due to orbit averaging. The end result used for subsequent analysis is a data set of 139 days of overlapping F11 and F13 data, with data excluded for 5 May, 14 July, 1-2 September and 21-22 September.

To assess the impacts of changing from the F11 to the F13 spacecraft on the derivation of ice fractions, DMSP-F11 and F13 SSM/I daily averaged sea ice concentration grids for the Northern and Southern hemispheres were generated using the NASA Team algorithm (Gloersen and Cavalieri 1986; NSIDC 1996). The existing F11 ice concentration data set archived by NSIDC is based on brightness temperatures adjusted using F8 versus F11 coefficients of Abdalati et al. (1995) applied to the 19, 22 and 37 GHz channels used by the sea ice algorithm. We first adjusted our F11 brightness temperatures in an identical manner. The impact of these adjustments on the F11-F13 comparisons and on F8-F11 differences is discussed in later sections. A weather filter, which uses the 22V and 37V channels, is applied to the data to eliminate most of the spurious ice concentrations resulting from wind-roughening of the ocean surface, cloud liquid water and rainfall (Cavalieri et al. 1995). Cavalieri (1992) discusses the general performance of, and sources of error in, the NASA Team algorithm.

In the following two sections, comparisons are made between total and multiyear ice fractions for the Northern Hemisphere, and between total ice fractions in the Southern Hemisphere. In addition, differences in total ice area and ice extent are evaluated.
Comparisons of Sea Ice Fraction
Northern Hemisphere

Table 2 summarizes the comparison of mean monthly total ice concentrations derived from F11 and F13 in terms of mean difference, standard deviation, root-mean-squared (r.m.s.) error and correlation, respectively.

The equations of linear least squares best fit are also given in Table 2. The statistics are computed for the Northern Hemisphere sea ice with and without an expanded land mask. As noted later, the largest differences occur along coastlines as a result of geolocation uncertainty and false retrievals of ice cover in open-ocean coastal pixels due to mixed-pixel effects from adjoining land (land contamination). A land mask expanded to 3 pixels out from the original land mask was used to minimize these effects. Table 2 lists the comparison results using the regular and expanded land mask. An additional calculation was performed for the central Arctic region, where any contaminated land pixels were filtered out using the expanded land mask.

Don`t read me wrong please, I am a fan of satellite data gathering, but You simply can`t beat close up inspection...applies to military intelligence gathering as well as science.

Satellites are great though for spotting subtle changes that You`l never notice close up, however when it comes to detail they are the wrong tool.
Sometimes a microscope is better suited than a telescope, to put it into an analogy what I am saying here.

Looking at the grey shaded Standard deviation on graph You posted here we are not really far off the 79-2000 average, and in that data set You have to wonder about the data quality even more than that of DMSP F11, which was launched November 1991.

So there are 12 years worth of un-explained data in that set 79 -2000 data set.
But the most important feature in the graph You posted is that 79-2000, 2007 and 2011 data from January till May...although they don`t fall exactly on the same Y points all lines proceed almost EXACTLY parallel to each other.

Had there been a "warming climate" these lines would certainly not track along in a perfect unison formation like that, but each line below would have began diverging downwards from the lines above it, as we proceed from left to right on the X-axis....to put it simply, a "warmer climate" also means a sooner melt

But I`m glad You did post this graph, I was always waiting for an opportunity to show how a lot of this kind of data has been washed through various algorithms.......making it not much better than computer model generated "data" of a virtual reality.

Again I am in no way saying You can`t gather valuable data with passive infrared satellite imagery but there are limitations!
 
Last edited:

You wanna see what kind of cheats your sources are...?
It`s easy to show, because from the picture link for that doctored up graph it`s possible to bust right into their archives, the fools are using an insecure server.:
Index of /data/seaice_index/images

and in case You did not notice besides this pack of lies packed into this graph almost every file has been modified over and over...this batch:
N_year_timeseries_webtmb.png 08-Apr-2011 07:55 58K

They want to front as legitimate science and if you want to see the actual data they want to know why you want it and what you plan to do with it...:
Konrad Steffen's group Greenland Climate Network
Request Personal Information
Please detail your project and the goal to use this dataset to achieve
well anyway instead of writing several pages of this phony data which is also only a "soft hack" away I`ll just show you with 3 pictures what these bastards are doing...it should give You a general idea..:

They started with this:
2007annual_melt.jpg


which is less than 625 square kilometers resolution and washed it through algorithms till it became this...:

uncorrected_map.jpg


and this they further dramatized to this, which they published just yesterday @ about half a dozen wikipedia pages..:
Climate change in the Arctic - Wikipedia, the free encyclopedia
titled Arctic shrinkage

Greenland_Ice_Mass_Trend.jpg


Then they boast that they have ground stations on Greenland + a Data set from these ground stations and they even supply a link on their dot climate Orgasm web page...but if You figure You get to see data, WRONG....!!! all You get is:
Object not found!

Then if You dig deeper about these "Greenland ground stations" You find that they either failed to transmit or have been removed years ago.

And why would they do this...???
Well here is the Answer.....:

Research at NSIDC: Satellite Studies of Arctic Climate Connections between Sea Ice, the Greenland Ice Sheet, the Adjacent Land and Atmospheric Cloud Properties

nsidc.org/research/projects
This project is funded by NASA grant NNG04G051G
Test the utility of multivariate analysis of cryospheric variables as a more effective means of detecting climatic change in regions where field observations are scarce

As usual in "climate science" the virtual cyber-space temperature inside a "computer model" is preferred to a real thermometer...and if reality catches up to the latest batch of lies "climatologists" can`t be held accountable for what kind of garbage came out of the Omega Equation"...

Fuck I think they drove by a funeral home and liked the ominous name....goes so well with the flooded New York pictures don`t you think


And on the front pages they are telling the public that they have "numerous groundstations on Greenland, " that monitor every fart

here is what they did see of Greenland...:
The IceBridge crew fly down Petermann Glacier in northern Greenland with NASA's DC-8 aircraft
petermann_glacier.png

One quicky "Climatologist" summer tourist flyby like most of the other "Greenland Experts"

And here is their latest creation"...:

664px-Seaice-1870-part-2009.png


and again it`s child`s play to source their "data"...:

{{Information |Description={{en|1=Extends File:Seaice-1870-2007.png to 2009 using data from ftp://sidads.colorado.edu/DATASETS/NOAA/G02135/, lightly munged.}} |Source={{own}} |Author=William M. Connolley

In other words he cooked it up himself..and that`s how he did it...:

Data Summary
The data is derived from a dynamic model using the omega equation which describes vertical atmospheric motion. The data are arrayed in a 67 x 69 grid with a grid length of 50 km.

Two versions of the data are available in separate directories (ver1 and ver2)


This clusterfuck has been on the $$$$$ gravy train and still is...:
This project is funded by NSF grant ARC 0805821
Project Summary

This effort is testing the hypothesis that the loss of Arctic sea ice and northern high latitude snow cover will invoke changes in the seasonality, spatial distribution and magnitudes of precipitation (P) and net precipitation (P-E) over the Arctic, which along with attendant changes in temperature, have ramifications for the freshwater budget of the Arctic Ocean and the mass balance of the Greenland ice sheet.

See, they are not researching anything, ..as real scientists would do it, they are scavenging for information that substantiates their doomsday prophecies

So that You have something to quote in a forum like this one

Oh yeah this would be right up your alley there "James Bond"...
avatar11254_1.gif


The temperature data set that they once had, but for some strange reason don`t have anymore...like Michael Mann`s Hockey stick data set, which vanished as well...they did email before to some select "clientele"..now they are telling them that they need the "Polaris Program" to decrypt the temperature readings...
As if simple thermometer readings were some sort of "top secret information"...not for the general public.....they are in the "little endian hexa decimal format".
So all You need is one line in C+ and switch the digits so the LSB is behind the MSB, then convert HEX to DEC...
[B][SIZE="4"]and after that You have a shitload of totally meaning less numbers that show ABSOLUTELY NO TREND[/SIZE][/B]

But only members of Annie secret inner circle with the Ovaltine secret decoder ring are supposed to see these numbers...
You want them "James Bond"...?
[IMG]http://www.usmessageboard.com/customavatars/avatar11254_1.gif

I can e-mail them to you

I did not mind doing this for entertainment tonight...it was another one of these nights where I took the night shift to babysit one of the kids who has brought home the flu from school..
 
Last edited:
Polar once again, decimating..............absolutely decimating the competition!!!!!!


Polar bro..........Im laughing my balls off!!!:rofl::rofl::rofl:

Its fascinating these dolts still show up!!! Having said that, I'd be bummed if they didnt!!:lol:
 
Last edited:
dec·i·mate verb \ˈde-sə-ˌmāt\
dec·i·mat·eddec·i·mat·ing
Definition of DECIMATE
transitive verb
1: to select by lot and kill every tenth man of
2: to exact a tax of 10 percent from <poor as a decimated Cavalier — John Dryden>
3a : to reduce drastically especially in number <cholera decimated the population> b : to cause great destruction or harm to <firebombs decimated the city> <an industry decimated by recession>


or...............my definition on this forum = :blowup::blowup::blowup::blowup::blowup:
 
dec·i·mate verb \&#712;de-s&#601;-&#716;m&#257;t\
dec·i·mat·eddec·i·mat·ing
Definition of DECIMATE
transitive verb
1: to select by lot and kill every tenth man of
2: to exact a tax of 10 percent from <poor as a decimated Cavalier — John Dryden>
3a : to reduce drastically especially in number <cholera decimated the population> b : to cause great destruction or harm to <firebombs decimated the city> <an industry decimated by recession>


or...............my definition on this forum = :blowup::blowup::blowup::blowup::blowup:

Think nothing of it...except maybe the way older Germans define "decimate" and the 10% kill rate is not exactly the same as the Oxford dictionary definition,...

You could have fun with that...remember this...:.....?

boom-480x360.png


I do believe I have You covered

Or

Don`t bring a knife to a gun fight

300px-Harry_Callahan.JPG


But some people just don`t learn...:

Never-bring-a-knife-to-a-gun-fight.jpg


And others figure we should all run scared from these kind of guns...:

gonnapopImage2.jpg


Keep bringing it on "OldRocks" and the rest of you Sciencewannabees....:


Valuev_Boxer.jpg


Why stop now...? As far as You guys are concerned You seem to be winning so far...:


boxing-cartoon.gif
 
The news just seems to be getting worse and worse coming out of the Arctic and Antarctic. The melting of ice is not appearing to let up, and is in fact, getting faster. A new NASA-funded satellite study shows that the two biggest ice sheets on Earth - Greenland and Antarctica - are losing mass at an accelerating rate. This is the longest study ever conducted to analyze changing ice conditions at the poles, spanning nearly 20 years. Researchers concluded that the melting of ice caps has overtaken the melting of mountain glaciers to be the most dominant source of global sea level rise, much sooner than previous forecast models predicted.

Over the length of the study, the ice caps have lost an average combined mass of 475 gigatons per year (1 gigaton = 1 billion metric tons). Over the course of the study, that number has risen by 36.3 gigatons for each consecutive year on average. In comparison, the loss of mountain glaciers was estimated at 402 gigatons per year on average. However, the rate of acceleration for mountain glacier loss is three times smaller than that of the ice caps.

NASA: Ice Caps Overtake Glaciers as Biggest Contributors to Rising Seas | Reuters


Really? I think not...

"It turns out these big blobs underneath the ice sheet were ice that had frozen on from the bottom of the ice sheet," she says. "There was water moving around underneath the ice sheet and it had frozen back onto the bottom of the ice sheet."

Ice in Antarctica isn't supposed to form that way — it's supposed to fall from the sky as snow, and form from the top down. But here Bell saw unusual ice structures, thousands of feet thick in places.

Heat from the Earth had melted the bottom of the glaciers, and then that water refroze, and it created what you could think of as gigantic frost heaves, so powerful that they actually altered the shape of the surface, half a mile to 2 miles above.

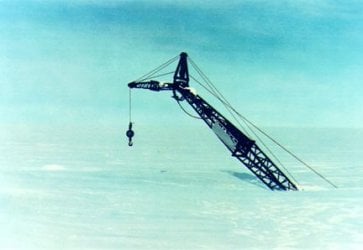
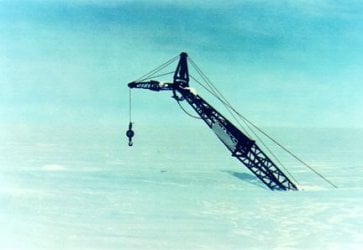
Then of course there's this little photograph that shows the top 30 feet of transmission towers that were built by ITT back in the 1960's...they are 115 feet tall.....that means that 85 FEET of ice has been laid down in 50 years.
That's the crane that was used to help build them.

It's Bottoms Up For Antarctic Ice Sheets : NPR

BBC NEWS | Science/Nature | DNA reveals Greenland's lush past

World Climate Report » Uncertainties Galore!
 

Attachments

  • $Power_Transmission_Towers-1.jpg
    $Power_Transmission_Towers-1.jpg
    9.5 KB · Views: 14
  • $Growing_Antarctic_Ice_Sheet-1.jpg
    $Growing_Antarctic_Ice_Sheet-1.jpg
    16.2 KB · Views: 16

You quoted :
"http://wxmaps.org/"
The first 2 images are forecasts based on the the CRU 100-yr climatology computer model...the web page says so right here.:
Short-Term Climate Outlooks
The climate outlook for temperature shows the 0-7 day and 8-15 day means plus the departure of the first 7-day mean from the CRU 100-yr climatology.

And the third image actually shows that most of North America is 4 to 6 deg Celsius below normal...
And that the arctic is more than 10 degrees below normal

before your`s and the other postings the same2 idiots keep posting the same crap over and over again.

Let`s see what Environment Canada has to say about it...:

1.) about how ice sheets and glaciers break up...:
Environment Canada - Weather and Meteorology - Ice Shelf Calving Mechanisms
Ice Shelf Calving Mechanisms

Environment Canada
lffl.gif


Ice shelves disintegrate mainly through the calving of ice islands. This occurs as the terminus of an ice shelf breaks off and becomes a free floating island of ice.

Although no complete explanations of the mechanisms which cause ice island calving have been accepted, the following is an overview of proposed plausible scenarios:
Scenario One

Persistent winds, tidal action and pressure from the surrounding ice pack may cause cracks to develop within the ice shelf: this producing an ice island. (Holdsworth 1971, Jeffries 1985)

Scenario Two

Vibrations due to wave action cause a resonance. This motion is generally called oscillation. Sometimes the oscillation is easy to see such as the motion of a swing on a playground or the vibration in a guitar string. In other cases the oscillation is impossible to see without measuring instruments. For example, electrons in an electrical circuit can oscillate but it happens on a molecular level.

Ultimately some of the energy in the oscillations has to be removed from the object or the size of the oscillations get so large that the object breaks. Taken from The Physics of Resonance that causes stresses in the ice shelf to the point where a fracture can occur. (Holdsworth & Glynn 1978)

X-201012171225088751.jpg

2.) how does melting from above occur when it does...:


Winds in the Arctic blow in mainly from the west as part of the westerlies, the name given to the main pattern of atmospheric circulation in the Northern Hemisphere. Wind speeds in the western Arctic are generally lower than in the east. In Davis Strait, wind storms lasting two or three days per month are a common phenomenon each month throughout the winter.

Winds blowing downslope, from high to low ground, accelerate as the air descends. Such winds reach hurricane force over the Melville Hills at the base of the Parry Peninsula, in the Amundsen Gulf, NWT. These winds may also form over the glaciers in mountainous areas of the eastern Arctic Islands. Air flowing over these icy areas cools rapidly and flows downslope under the force of gravity. In some cases, these downslope or katabatic winds are very warm. In the Arctic, warm, dry foehn winds can cause melting at the edges of glaciers, and have been recorded over the White Glacier of Axel Heiberg Island.
Winds blow more strongly over the flat, open areas of the central and western Arctic Islands and less over the more rugged terrain of the eastern Arctic Islands. These winds redistribute the snow cover, piling it into dunes or raking it into sastrugi (parallel ridges). The rougher the terrain, the more unequal the surface snow cover. Snow cover is relatively uniform over flat tundra and sea ice, but is generally blown away from watersheds, windward slopes, and plateaus into adjacent hollows.

Snow in the Arctic is easily wind-borne because it is not "sticky". At wind speeds of 60 km/h, blowing snow makes it difficult to see more than a few metres. With cold temperatures and windy conditions, a winter storm becomes a blizzard. In spring and fall, the snow and sky often have a uniform whiteness. Landscape and clouds blend together, causing the horizon to disappear.


And GW "science" + every moron that believes it continues to ignore these well known factc

They also have no interest in the extensive data collection carried out with the "Scandinavian Triangle"
One interesting thing that the "Scandinavian Triangle" has monitored over the years are the location and frequency of lightning...
Before we go into that, a little foreword explanation why this data is significant is in order.

1.)Heat causes convection...that can not be avoided
2.) Convective air-flows build up an electrical charge
3.) the more heat, the more convection, the more lightning activity.

So monitoring lightning activity gives a far wider overview for large areas and the prevailing temperatures...
Consider this...:


800px-HRFC_AnnualFlashRate_0.5.png


there is a direct relation to temperature and lightning activity:
world.jpg


And that relationship bears out short term and long term....:


http://www.geophysica.fi/pdf/geophysica_2008_44_1-2_067_tuomi.pdf
Thunderstorm Climate of Finland 1998–2007
Tapio J. Tuomi and Antti Mäkelä
Finnish Meteorological Institute
P.O. Box 503, FIN-00101 Helsinki, Finland
(Received: March 2008; Accepted: August 2008)
Abstract
The ten-year period 1998–2007 of relatively even-quality lightning location data in Finland is
summarized into diagrams of spatial and temporal variations.

comparison between thunder days and forest growth has also been made (Solantie and
Tuomi, 2000). A yearbook of lightning observations (location data) in Finland has been
published since 1984, and the latest ones (e.g. Tuomi and Mäkelä, 2007, 2008a) are
available electronically.
Published by the Geophysical Society of Finland, Helsinki
And here is the area they monitored:
lightningactivity.jpg


If You are looking for a trend, for the time period of 1998-2002 theres is no trend, but a status quo however 2003 -2007 clearly shows a downward trend and with it also clearly shows that the was NO INCREASE IN AVERAGE TEMPERATURE.
No point doing such a survey for Ellesmere & Greenland because the temperatures are far too low to set up the convection you need for lightning to ever occur, but Environment Canada does have maps for that and on these maps the zone of increased temperatures for this convective action has not traveled one single mile further up North ever since lightning activity has been monitored.
Environment Canada - Weather and Meteorology - Lightning activity in major cities in Canada - Manitoba
Lightning Detection - Environment Canada

So on one hand GW doomsday prophets predict catacalysmic storms with "computer models", yet ignore common lightning storms, why they happen, where and when...the same way they do it with "virtual" instead of REAL ice and with VIRTUAL temperature instead of REAL temperature, that in no way matched their predictions.

All the while REAL science is saying if your computer model can`t even replicate empirical data then it it`s not valid...

"GW climatology" has cemented their feet in the bucket using exaggerated data and an exaggerated model. Their is no way now they can go back now to actual empirical data 10 years back, run it through the model and show that it was right.
And now You know the reason why they refuse to publish the data set that they have used.

No matter how often that is pointed out these utter morons + their following keep on quoting FORECASTS based on comedy models over and over again...

Like this guy for example:
avatar11254_1.gifhttp:

Join Date: May 2008
Location: Colbert Nation
Posts: 13,611

That`s almost 13 posts every day for 1075 consecutive days..
That sure as shit does not leave a whole lot of time for reading and informing yourself....
as the stupid stuff he keeps posting here clearly shows

Albert Einstein
"If A is a success in life, then A equals x plus y plus z. Work is x; y is play; and z is keeping your mouth shut."
Two things are infinite: the universe and human stupidity; and I'm not sure about the the universe."
 
Last edited:
The news just seems to be getting worse and worse coming out of the Arctic and Antarctic. The melting of ice is not appearing to let up, and is in fact, getting faster. A new NASA-funded satellite study shows that the two biggest ice sheets on Earth - Greenland and Antarctica - are losing mass at an accelerating rate. This is the longest study ever conducted to analyze changing ice conditions at the poles, spanning nearly 20 years. Researchers concluded that the melting of ice caps has overtaken the melting of mountain glaciers to be the most dominant source of global sea level rise, much sooner than previous forecast models predicted.

Over the length of the study, the ice caps have lost an average combined mass of 475 gigatons per year (1 gigaton = 1 billion metric tons). Over the course of the study, that number has risen by 36.3 gigatons for each consecutive year on average. In comparison, the loss of mountain glaciers was estimated at 402 gigatons per year on average. However, the rate of acceleration for mountain glacier loss is three times smaller than that of the ice caps.

NASA: Ice Caps Overtake Glaciers as Biggest Contributors to Rising Seas | Reuters

Really? I think not...
It's Bottoms Up For Antarctic Ice Sheets : NPR
But that's only because you're an ignorant, moronic dupe of the fossil fuel industry's propaganda machine. The article you're citing in no way suggests that the amount of water being refrozen under one section of East Antarctica equals the amount of ice mass loss that is being recorded for Antarctica and Greenland. It is not, as would be obvious to any intelligent person reading that article. You only "think"(?) otherwise because some oil corp stooge put a deliberately twisted interpretation of that article up on some denier cult blog where you picked it up.


Then of course there's this little photograph that shows the top 30 feet of transmission towers that were built by ITT back in the 1960's...they are 115 feet tall.....that means that 85 FEET of ice has been laid down in 50 years.
That's the crane that was used to help build them.
Soooooooo gullible and sooooooooo stupid. Did you imagine that global warming means that it will stop snowing in Antarctica? LOL. Actually, global warming is increasing the water content of the atmosphere and is thus causing increased snowfall in cold areas like Antarctica and the northeastern US in wintertime and increased rainfalls/flooding in many places. Antarctica is losing ice mass mostly along the coastlines of Western Antarctica, although scientists have recently noticed ice mass losses from East Antarctica as well.

I think 85 feet of ice added in 50 years is a hell of a lot more compelling...don't you?
Only if you're an idiot.


And just what, pray tell, does this article mean in relation to current global warming in your twisted little pea brain, walleyed? Do you imagine that "Greenland's lush past" refers to the Viking colonization? LOL.

From the article (excerpt):
"DNA extracted from ice cores shows that moths and butterflies were living in forests of spruce and pine in the area between 450,000 and 800,000 years ago."
The ancient boreal forests were thought to cover southern Greenland during a period of increased global temperatures, known as an interglacial. Temperatures at the time were probably between 10C in summer and -17C in winter.
Although the ice contained only a handful of pollen grains and no fossils, the researchers were able to extract DNA from the organic matter held in the silt.
Previously, the youngest fossil evidence of a native forest in the region came from fossils found in the Kap Kobenhavn Formation in northern Greenland. There, the fossils date from around 2.4m years ago.


So, they're talking about conditions in southern Greenland very far in the past, many glaciations ago. So what???

Ice core evidence of recent glaciation

Ice cores are used to obtain a high resolution record of recent glaciation. It confirms the chronology of the marine isotopic stages. Ice core data shows that the last 400,000 years have consisted of short interglacials (10,000 to 30,000 years) about as warm as the present alternated with much longer (70,000 to 90,000 years) glacials substantially colder than present. The new EPICA Antarctic ice core has revealed that between 400,000 and 780,000 years ago, interglacials occupied a considerably larger proportion of each glacial/interglacial cycle, but were not as warm as subsequent interglacials.


Another fossil fuel industry sponsored disinformation site. Zero credibility.

"worldclimatereport.com"?

World Climate Report, a newsletter edited by Patrick Michaels, was produced by the Greening Earth Society, a non-profit organization created by the Western Fuels Association.

Western Fuels Association currently owns two mining operations that supply coal to its members... The Western Fuels Association has played a controversial role in the debate over global warming. They have established groups such as the Greening Earth Society which promote various forms of climate change skepticism and have funded individual skeptics, such as Patrick Michaels[2], Craig D. Idso and Sherwood Idso. Groups established by industry bodies like the Western Fuels Association have been criticized as Astroturf organizations, since they appear superficially to be grassroots initiatives. In addition to Patrick Michaels (chief editor), the staff is listed as Robert C. Balling, Jr (contributing editor)...


The Cato Institute and Patrick Michaels - It's a Small World After All
26 May 09

It&#8217;s not often the public gets to follow the money trail, so it was a treat this week when PR Watch revealed the Cato Institute has been bankrolling a consulting company owned by notorious climate denier Patrick Michaels to the tune of $242,900 since April 2006.

Michaels is a Senior Fellow at the Cato Institute and according to tax documents uncovered by PR Watch for 2006 and 2007, Cato ponyed up almost a quarter million to Michaels&#8217; firm New Hope Environmental Services for "environmental policy" services.

Koch Industries (pronounced "coke") is the largest privately owned company in the United States[1]; though diversified, it amassed most of its fortune in oil trading and refining.[1] In spring 2010, Koch Industries was named one of the United States' top 10 air polluters in a study released by the University of Massachusetts at Amherst&#8217;s Political Economy Research Institute. [2]. The company was started in 1927 by Fred Koch, a charter member of the John Birch Society and father of the current owners, who appear to be the most active orchestrators of anti-regulation efforts in the United States.

Robert C. Balling, Jr. is a professor of geography at Arizona State University, and the former director of its Office of Climatology. Balling has declared himself one of the scientists who oppose the consensus on global warming, arguing in a 2009 book that anthropogenic global warming "is indeed real, but relatively modest",[2]...
Balling was mentioned as a fossil fuel industry - funded scientist in Ross Gelbspan's 1997 book The Heat is On. ...Balling "acknowledged that he had received $408,000 in research funding from the fossil fuel industry over the last decade... Between December 1998[5] and September 2001[6] Balling was listed as a "Scientific Adviser" to the Greening Earth Society, a group that was funded and controlled by the Western Fuels Association (WFA), an association of coal-burning utility companies. WFA founded the group in 1997, according to an archived version of its website, "as a vehicle for advocacy on climate change, the environmental impact of CO2, and fossil fuel use."[7]
 
Last edited:
Soooooooo gullible and sooooooooo stupid. Did you imagine that global warming means that it will stop snowing in Antarctica?
One of the foremost and leading climatologists DID say however that snow would be a "rare and exciting event" in Europe due to global warming, back in 2000...

He really looks stupid and gullible now, by your own measure. Does he not?

Snowfalls are now just a thing of the past - Environment - The Independent

According to Dr David Viner, a senior research scientist at the climatic research unit (CRU) of the University of East Anglia,within a few years winter snowfall will become "a very rare and exciting event". "Children just aren't going to know what snow is," he said.
:lol::lol::lol::lol::lol:

We're supposed to just faithfully believe what he says now, and not pay any attention to 11 years ago. Right?

:rofl:
 

I think you are truly a dumb ass for even posting that kind of foolishness. And you dare try to pass yourself off as a scientist.
 
NASA Finds Polar Ice Adding More to Rising Seas - NASA Jet Propulsion Laboratory

The authors conclude that, if current ice sheet melting rates continue for the next four decades, their cumulative loss could raise sea level by 15 centimeters (5.9 inches) by 2050. When this is added to the predicted sea level contribution of 8 centimeters (3.1 inches) from glacial ice caps and 9 centimeters (3.5 inches) from ocean thermal expansion, total sea level rise could reach 32 centimeters (12.6 inches). While this provides one indication of the potential contribution ice sheets could make to sea level in the coming century, the authors caution that considerable uncertainties remain in estimating future ice loss acceleration.

Study results are published this month in Geophysical Research Letters. Other participating institutions include the Institute for Marine and Atmospheric Research, Utrecht University, The Netherlands; and the National Center for Atmospheric Research, Boulder, Colo.

JPL developed Grace and manages the mission for NASA. The University of Texas Center for Space Research in Austin has overall mission responsibility. GeoForschungsZentrum Potsdam (GFZ), Potsdam, Germany, is responsible for German mission elements.

Lots of interesting information on this site. Even more here;

GRACE Tellus
 
Soooooooo gullible and sooooooooo stupid. Did you imagine that global warming means that it will stop snowing in Antarctica?
One of the foremost and leading climatologists DID say however that snow would be a "rare and exciting event" in Europe due to global warming, back in 2000...

Snowfalls are now just a thing of the past - Environment - The Independent

He really looks stupid and gullible now, by your own measure. Does he not?
No, it is still you denier cult dimwits who look stupid and gullible.

Dr. Viner was working with the information they had at the time and since then some other newer trends have postponed his predictions but not invalidated them. "Within a few years" now seems to be more like 'within a few decades or so'.

As the article you cited stated, the conditions when he made that statement were like this:
"The first two months of 2000 were virtually free of significant snowfall in much of lowland Britain, and December brought only moderate snowfall in the South-east. It is the continuation of a trend that has been increasingly visible in the past 15 years: in the south of England, for instance, from 1970 to 1995 snow and sleet fell for an average of 3.7 days, while from 1988 to 1995 the average was 0.7 days. London's last substantial snowfall was in February 1991. "

Meanwhile, scientists have found that a rapidly warming Arctic, when coupled with the negative phase of the Arctic Oscillation, is pushing the cold weather south and, combined with the higher moisture content of the atmosphere created by global warming, is creating heavier snowfalls in North America and Europe.


Climate Change Makes Major Snowstorms More Likely
March 1, 2011
Heavy Snowpack, “Spring Creep” Raise Threat Of Record Floods

WASHINGTON (March 1, 2011) – Global warming is “loading the dice” to increase the frequency of record-setting snowstorms like those that have pounded the United States and Europe the past two winters, according to scientists participating in a telephone press conference held today by the Union of Concerned Scientists (UCS).

“Heavy snowstorms are not inconsistent with a warming planet,” said Jeff Masters, director of meteorology for the Weather Underground website. “In fact, as the Earth gets warmer and more moisture gets absorbed into the atmosphere, we are steadily loading the dice in favor of more extreme storms in all seasons, capable of causing greater impacts on society.” ~Edit in accordance with our copyright rule, linked below. Please adhere to it in the future. - Moderator

http://www.usmessageboard.com/announcements-and-feedback/144985-ok-listen-up.html


MORE RESOURCES
For more information about ties between extreme winter weather and global warming, see the UCS backgrounder: “It’s Cold and My Car Is Buried in Snow. Is Global Warming Really Happening?”

For more information on the record low levels of sea ice in the Arctic, see the National Snow and Ice Data Center website.

For more information on extreme weather trends across the country, see the Weather Underground website.


©2010 Union of Concerned Scientists

(In accordance with Title 17 U.S.C. Section 107, this material is distributed without profit to those who have expressed a prior interest in receiving the included information for research and educational purposes.)
 

I think you are truly a dumb ass for even posting that kind of foolishness. And you dare try to pass yourself off as a scientist.


Tell that to the ice! Seems to me it has sure grown pretty damned deep in half a century don't you?:lol::lol: Gosh you're blind.
 

Attachments

  • $Growing_Antarctic_Ice_Sheet-1.jpg
    $Growing_Antarctic_Ice_Sheet-1.jpg
    16.2 KB · Views: 19
  • $Power_Transmission_Towers-1.jpg
    $Power_Transmission_Towers-1.jpg
    9.5 KB · Views: 19
Soooooooo gullible and sooooooooo stupid. Did you imagine that global warming means that it will stop snowing in Antarctica?
One of the foremost and leading climatologists DID say however that snow would be a "rare and exciting event" in Europe due to global warming, back in 2000...

Snowfalls are now just a thing of the past - Environment - The Independent

He really looks stupid and gullible now, by your own measure. Does he not?
No, it is still you denier cult dimwits who look stupid and gullible.

Dr. Viner was working with the information they had at the time and since then some other newer trends have postponed his predictions but not invalidated them. "Within a few years" now seems to be more like 'within a few decades or so'.


You want to know what's really funny? You guys are trying so hard to rewrite history you no longer can remember which lie you told. Sad and funny at the same time. I'll just post one link which refutes your bloviating quite nicely, quality over quantity and all that you know....I hate to tell you blunder but no one cares about you and your failed religion any longer....buck up old chap, there will be some other "terrible threat" pop up any moment now and you can throw your religious fervor into that cause. Cheerio!

Al Gore makes latest global-warming pitch in New York Times - NYPOST.com
 
NASA Finds Polar Ice Adding More to Rising Seas - NASA Jet Propulsion Laboratory

The authors conclude that, if current ice sheet melting rates continue for the next four decades, their cumulative loss could raise sea level by 15 centimeters (5.9 inches) by 2050. When this is added to the predicted sea level contribution of 8 centimeters (3.1 inches) from glacial ice caps and 9 centimeters (3.5 inches) from ocean thermal expansion, total sea level rise could reach 32 centimeters (12.6 inches). While this provides one indication of the potential contribution ice sheets could make to sea level in the coming century, the authors caution that considerable uncertainties remain in estimating future ice loss acceleration.

Study results are published this month in Geophysical Research Letters. Other participating institutions include the Institute for Marine and Atmospheric Research, Utrecht University, The Netherlands; and the National Center for Atmospheric Research, Boulder, Colo.

JPL developed Grace and manages the mission for NASA. The University of Texas Center for Space Research in Austin has overall mission responsibility. GeoForschungsZentrum Potsdam (GFZ), Potsdam, Germany, is responsible for German mission elements.

Lots of interesting information on this site. Even more here;

GRACE Tellus


From your link....yet another case of some black box scientist plugging numbers into a poorly written computer model and thinking that is data...just like you folks. Computer models are not data, they are predictions and they have never been correct once.


Rignot's team combined nearly two decades (1992-2009) of monthly satellite measurements with advanced regional atmospheric climate model data to examine changes in ice sheet mass and trends in acceleration of ice loss.
 

Forum List

Back
Top