Quantum Windbag
Gold Member
- May 9, 2010
- 58,308
- 5,100
- 245
Who'da thunk it? If only someone had pointed this out before we might have been able to do something like cut spending instead of trying to raise taxes.
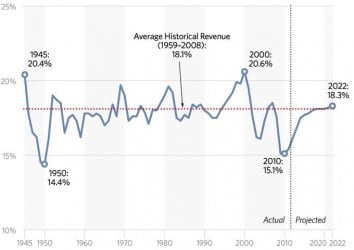
9 Takeaways From the CBO?s New Budget Report - Hit & Run : Reason.com
9 Takeaways From the CBO?s New Budget Report - Hit & Run : Reason.com


") if you get 18% of 120, you're better off than getting 18.5 of 100...tax reform gets us there, smart tax reform.
if you get 18% of 120, you're better off than getting 18.5 of 100...tax reform gets us there, smart tax reform.