flacaltenn
Diamond Member
- Jun 9, 2011
- 67,573
- 22,962
You're wrong and/or over interpreting.Which claims do you speak of?And this is fine in the published literature.Bullshit. The mark of an accomplished scientist is to produce GOOD work. The only people who try and prevent discourse are those who have something to hide. No legitimate scientist is ever afraid to defend his work.
Period.
Otherwise, it's like a creationist site. Or a homeopathic site. Blogs. Blargh.
Or an actual INTERVIEW with the AUTHOR of a famous peer-reviewed paper --- just like this dishonest data prep that you're discussing --- where they REFUTE the outrageous UNFOUNDED claims made for his work... Or have you forgotten?
Claims that YOU have digested and internalized mostly from complicit media or blogs or Nat Geo TV..
Because you didn't understand that refutation of your "unprecendented" claims --- you probably need to study a bit..
Why is it that the memories of all our warmer buddies is so bad? I think there an inference here..
That graph posted above in the thread. You tossed out the claim that it proves "unprecendented rates of warming or temperatures"..
Then Ian and I pointed out to you that if you took a heavily filtered and sparsely sampled historical proxy over 10,000 years and "tacked on" a modern hi accuracy instrumentation to it --- you would ALWAYS get a hockey stick..
And I gave you an interview with Marcott -- lead author of one of the famous of those Global proxy studies CONFIRMING that the data prep and methods would never see a 60 year blip like ours in it. And you pranced away with your hands over your ears and spouting ad homs.
Now -- You take some of the INDIVIDUAL proxies that are used in the GLOBAL data prep and look at those at HIGHER resolution --- You'll see temperature mins and maxs and rates that are virtually INVISIBLE in those hockey stick worldwide filtering excercises. True story der 'derp....
A spike in temps can't be seen because the assumption is that spike goes down as rapidly as it went up- which is not the case in the present.
And yeah, you'll always get a hockey stick because the spike we have in warming is real, and hasn't happened before as far as we can tell.
This blog explains it. It pretends there are short term temp spikes that resolve quickly. Totally unrealistic, of course, but that's your supposition.
Smearing Climate Data
But it's a blog, just like yours, so caveats are needed. The reason I need to use a blog is because the issue isn't a real one in the scientific literature.
Now you're just winging it and IGNORING the science as Marcott explained it to you.. Doesn't matter to a filter whether the "wiggle" is UP or Down or both. It be attenuated and it's rise/fall times will be reduced by the bandwidth of the filter applied. When you are trying to merge ice cores, mudbug shells and tree rings, they all have different sampling points and sampling rates. To MERGE these in data prep --- your best resolution is closer to the WORSE proxies than the good ones and you HAVE to filter heavily..
When Marcott says that events less than 300 yrs are INVISIBLE in his work he means it.. PLEASE don't wing it. I might end up liking you better...
I've already told you -- might have SHOWED you --- that there are INDIVIDUAL PROXIES --- that SHOW transistions like ours all THRU this interglacial period. Lemme post this AGAIN for you below. The problem comes in because of the attempt to take a sparse number of mudbugs, tree rings, and ice cores from different parts of world and PRETEND you have a temperature record as accurate as the DEVIOUSLY tacked on modern thermometer record..
Here's a start -- I've clipped many others...
Ice cores and climate change - Publication - British Antarctic Survey
Abrupt climate changes
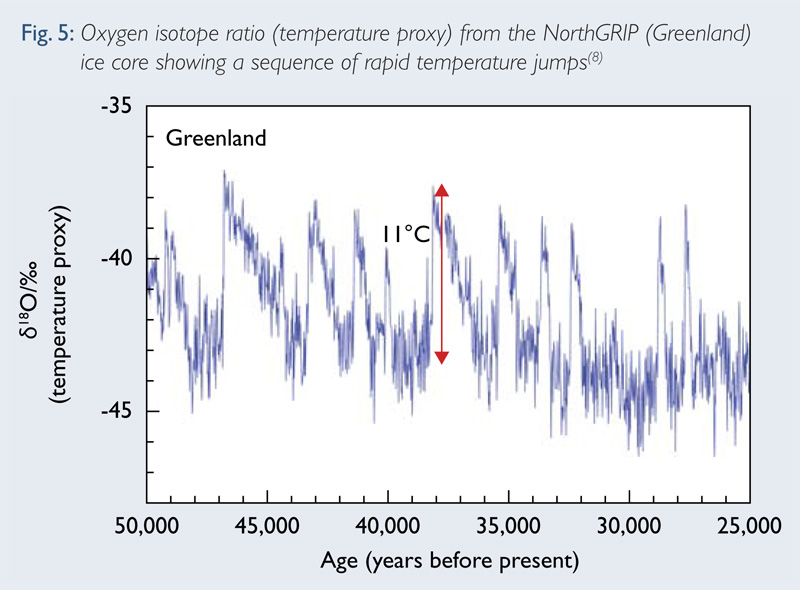
The climate changes described above were huge, but relatively gradual. However, ice cores have provided us with evidence that abrupt changes are also possible. During the last glacial period, Greenland experienced a sequence of very fast warmings (see Fig. 5 overleaf). The temperature increased by more than 10°C within 40 years. Other records show us that major changes in atmospheric circulation and climate were experienced all around the northern hemisphere. Antarctica and the Southern Ocean experienced a different pattern, consistent with the idea that these rapid jumps were caused by sudden changes in the transport of heat in the ocean. At this time, there was a huge ice sheet (the Laurentide) over northern North America. Freshwater delivered from the ice sheet to the North Atlantic was able periodically to disrupt the overturning of the ocean, causing the transport of tropical heat to the north to reduce and then suddenly increase again. While this mechanism cannot occur in the same way in today’s world, it does show us that, at least regionally, the climate is capable of extraordinary changes within a human lifetime – rapid switches we certainly want to avoid experiencing.
Go compare that to the GLOBAL hockeystick chart (about post 371) that you shoved at us.. Shows NONE of the 2 - 10 degC changes that this INDIVIDUAL proxy study does..
UNPRECENDENTED --- my ass...

Last edited:
 Just by eyeball -- I'd say somewhere on the Western slopes of Mt Stupid..

