He actually received 81 million votes (supposedly) and his voters aren't embarrassed at all.

Don't read the NY Times. What you posted was a student exercise in statistical probability of the timeline of various steps needed to make a vaccine. And you're presenting it
as, "this is what Democrats and liberals thought". :)

You are a hack. Nothing more. Nothing less.


Stop lying.

Your posts are rife with the Left's propaganda.

I just eviscerated you latest lies.....and yet you're still gonna try to dig your way out.


Too late, dunce.
 
Stop lying.

Your posts are rife with the Left's propaganda.

I just eviscerated you latest lies.....and yet you're still gonna try to dig your way out.


Too late, dunce.
There you go. You're as predictable as your savior. You run off and declare your non-existent victory. :)

I've enjoyed kicking your ass. :auiqs.jpg:
 
By stagnant, you mean....

One with Proven Growth.As per more than mere GDP.
But take home pay and jobs filled and things believed impossible
like establishing Oil Independence.
Right now under Biden there is a critical lack of Growth.
Biden is Degrowing the Economy.
And don't dare cite Biden Low Unemployment.The direct result of
lowering the Labor Participation rate.By offering incentives like extended
unemployment to keep from working.The Lower the Labor Participation rate
the easier for a lower Unemployment rate.Fewer workers to record as
not working.Obama pulled that hat trick in 2012 { staring a couple months
earlier { November and December of 2011 }.In Janiuary there were debates over
how Obama could get Re-elected when no President in American History ever got
Re-elected when Unemploymnet was 8 % or higher.
So in January 2012 there was a very strange occurance.Over One million
{ 1.2 Million } workers vanished from the labor force.That Immediately
made for a Lower Unemployment number.
By "proven growth," you mean riding the Obama wave with employment growing at the same rate after Yrump became president as it did before. About the same with GDP.

By "lowering the Labor Participation rate" you mean going from 61.4% to 61.6%.

Which actually makes taking the unemployment rate from 6.3% down to 4.8% even more impressive.

What was the unemployment rate in Obama's 2011.
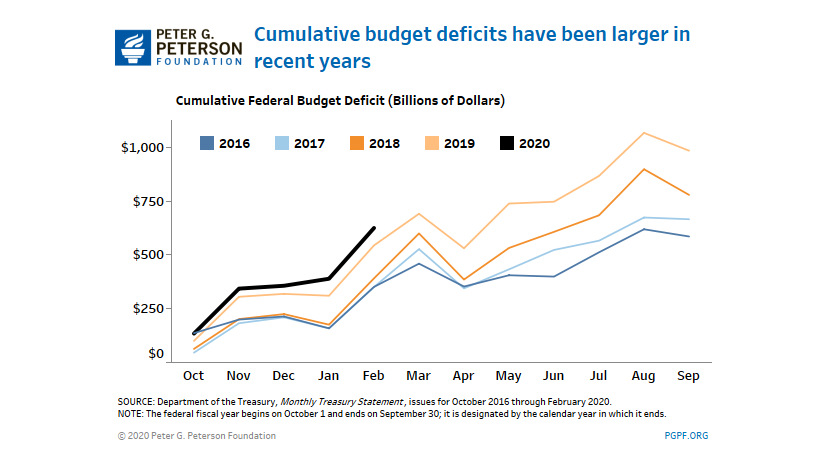
What were his Budget Deficits. Try averaging over $ 1.2 Trillion his
first term.What was Unemployement rate the month before Obama's 2012
election.It was 7.8 %. When in one month September it magically dropped
.3 %. From 8.1 % { in August } to 7.8 %. Just in time to fulfill Obama's Dream.
The September Jobs report and numbers were the key.
Even CEO Jack Welch was mortified.Responding instantly to the Friday
report in early October at 9 am ...
" Unbelievable jobs numbers,these Chicago guys will do anything.
Can't debate so change numbers. "
Later adding " I was right about Strange Jobs Repoort ".
Furthermore ... both the Civilian labor force { 154.6 Million } and the
Labor Force Participation rate { 63.5 % } Declined in August.
There is also something known as Part-time employment stats.
 
Liar. In January, 2012, the labor force did not decrease by 1.2 million. It increased by 386,000.

From December 2011 to January 2012 over a million persons previously
recorded as workers vanished.Plus the Bureau of Labor Statistics were
suspicioulsy guilty of changing the way Unemployement is arrived at.
By determing those considered as part of the Labor force for a full
year ... down to as little as 4 weeks.Making for workers considered and
counted as full time for a full year,down to just 4 weeks instead.
 
What was the unemployment rate in Obama's 2011.
What were his Budget Deficits. Try averaging over $ 1.2 Trillion his
first term.What was Unemployement rate the month before Obama's 2012
election.It was 7.8 %. When in one month September it magically dropped
.3 %. From 8.1 % { in August } to 7.8 %. Just in time to fulfill Obama's Dream.
The September Jobs report and numbers were the key.
Even CEO Jack Welch was mortified.Responding instantly to the Friday
report in early October at 9 am ...
" Unbelievable jobs numbers,these Chicago guys will do anything.
Can't debate so change numbers. "
Later adding " I was right about Strange Jobs Repoort ".
Furthermore ... both the Civilian labor force { 154.6 Million } and the
Labor Force Participation rate { 63.5 % } Declined in August.
There is also something known as Part-time employment stats.
Debt increased an average of $2 trillion a year under Trump. You're in no position to cry about debt under Obama.

As far as part time jobs... 90% of the jobs added under Obama were full time jobs.
 
From December 2011 to January 2012 over a million persons previously
recorded as workers vanished.Plus the Bureau of Labor Statistics were
suspicioulsy guilty of changing the way Unemployement is arrived at.
By determing those considered as part of the Labor force for a full
year ... down to as little as 4 weeks.Making for workers considered and
counted as full time for a full year,down to just 4 weeks instead.
You really should stop lying.

Again, the number of people from in January, 2012 was +386. In December, 2011, it was -133.

Screenshot_20211017-152436_Samsung Internet.jpg
 
Debt increased an average of $2 trillion a year under Trump. You're in no position to cry about debt under Obama.

As far as part time jobs... 90% of the jobs added under Obama were full time jobs.
Debt this time in 2008, About $10,771,xxx,xxx,xxx (almost $11 trillion)
Debt this time in 2016, $20,027,xxx,xxx,xxx ($20 plus trillion)

That's nearly doubled in just eight years, and more than $2 trillion annual average, under Obama.

Both links also provide employment numbers on the right side of data column, for those wanting to see actual numbers.

Current numbers;
 
That's nearly doubled in just eight years, and more than $2 trillion annual average, under Obama.
That's $9.3 trillion in 8 years, an average of $1.2 trillion per year. Who the fuck knows from where you came up with "more than $2 trillion"?

face-palm-gif.278959
 
Debt increased an average of $2 trillion a year under Trump. You're in no position to cry about debt under Obama.

As far as part time jobs... 90% of the jobs added under Obama were full time jobs.
Bush 43 handed Obama a little over a $ 10 trillion Natiional debt.
Obama Handed Trump around $ 20 Trillion national debt.
So National debts by 2 term Presidents can be expected to Double.
As I just pointed out.
Joe Biden is on Schedule to hit maybe a $ 30 Trilion National Debt
in One year or lees.
Go ahead and just try and Austan Goolsbee yer way out of dat.
Goolsbee was the youngest member of Obama's inner circle of
Cabinet advisers
And yes,Goolsbee teaches Economics in Chicago.And yes,he's a frequent
guest on Fox.
 
That's $9.3 trillion in 8 years, an average of $1.2 trillion per year. Who the fuck knows from where you came up with "more than $2 trillion"?

face-palm-gif.278959
And to tink that Economic experts in October of 2019 were seriously
speculating that by year 2028 the National Debt could hit $ 40 Trillion.
I guess they weren't done prepared for an Old Fart Career Pol
Potus and his Career Posse of lunatics { Pelosi,Schumer }.
 
That's $9.3 trillion in 8 years, an average of $1.2 trillion per year. Who the fuck knows from where you came up with "more than $2 trillion"?

face-palm-gif.278959
Again ... Bush 43 had a $ 162 Billion budget deficit in 2007.
Barack Obama AVERAGED Over $ 1.2 Trillion in his first Term.
A term is 4 years ...
 
You damn right it's beyond absurd. A President that committed sedition and insurrection against his own country, and he hasn't been hung yet. Absurd

His children that actually had to be made by a judge to take a class on how to NOT steal from charities. Absurd

His son in law who lied 10 different times on the top secret security clearance application. Each lie a felony, and he hasn't been arrested and prosecuted yet. Absurd
Yeap...plus the current president whose dealing with China, and his son's obvious meddling and power for play schemes with the CCP.

Why hasn't the FBI continued its investigation on those laptops?

Trump was sold out to the Zionists, and the Israeli government, and Biden, the Chinese.
 
That's $9.3 trillion in 8 years, an average of $1.2 trillion per year. Who the fuck knows from where you came up with "more than $2 trillion"?

face-palm-gif.278959
Forgetting to double check my math, plus some domestic(homefront~spouse) distraction.

Still, we saw the 'basic" Federal/National Debt double during Obama's eight years in office.

Two items to remember;
1) The POTUS can recommend a Federal Budget, but Congress actually makes the budget and then the POTUS can either accept and sign-off, or decline and send back to Congress. Declining to accept and sign-off can result in a "government shutdown", which produces public negative feedback, and some economic repercussions. The last Budget Congress presented to Trump was way larger than he proposed/wanted, but under duress he signed-off on it.
...
Government shutdowns in the United States occur when there is a failure to enact funding legislation to finance the government for its next fiscal year or a temporary funding measure. Ever since a 1980 interpretation of the 1884 Antideficiency Act, a "lapse of appropriation" due to a political impasse on proposed appropriation bills requires that the US federal government curtail agency activities and services, close down non-essential operations, furlough non-essential workers, and only retain essential employees in departments covering the safety of human life or protection of property.[1] Voluntary services may only be accepted when required for the safety of life or property.[1] Shutdowns can also occur within and disrupt state, territorial, and local levels of government.

Since the enactment of the US government's current budget and appropriations process in 1976, there have been a total of 22 funding gaps in the federal budget, ten of which have led to federal employees being furloughed. Prior to 1980, funding gaps did not lead to government shutdowns, until Attorney General Benjamin Civiletti issued a legal opinion requiring the government to be shut down when a funding gap occurs.[2] This opinion was not consistently adhered to through the 1980s, but since 1990 all funding gaps lasting longer than a few hours have led to a shutdown.

Some of the most significant shutdowns in U.S. history have included the 21-day shutdown of 1995–1996 during the Bill Clinton administration over opposition to major spending cuts; the 16-day shutdown in 2013 during the Barack Obama administration caused by a dispute over implementation of the Affordable Care Act (ACA);[3] and the 35-day shutdown of 2018-2019 during the Donald Trump administration, the longest shutdown in US history,[4] caused by a dispute over the funding amount for an expansion of the U.S.–Mexico border barrier.[5][6]

Shutdowns cause the disruption of government services and programs, including the closure of national parks and institutions (in particular, due to shortages of federal employees). A major loss of government revenue comes from lost labor from furloughed employees who are still paid, as well as loss of fees that would have been paid during the shutdown. Shutdowns also cause a significant reduction in economic growth (depending on the length of the shutdown). During the 2013 shutdown, Standard & Poor's, the financial ratings agency, stated on October 16 that the shutdown had "to date taken $24 billion out of the economy", and "shaved at least 0.6 percent off annualized fourth-quarter 2013 GDP growth".[7]
...
See also;

Government Shutdowns in 1995, 2013, 2018, and 2019 Explained​

~~~~~~~~~~~~~~~~~~~
2) Federal Debt in dollars alone is not the gauge. Inflation over time provides a relativity factor to consider. For example, this on the 1980 Dollar versus the 2021 dollar;
...

Value of $1 from 1980 to 2021​

$1 in 1980 is equivalent in purchasing power to about $3.33 today, an increase of $2.33 over 41 years. The dollar had an average inflation rate of 2.98% per year between 1980 and today, producing a cumulative price increase of 232.90%.

This means that today's prices are 3.33 times higher than average prices since 1980, according to the Bureau of Labor Statistics consumer price index. A dollar today only buys 30.03% of what it could buy back then.

The 1980 inflation rate was 13.50%. The current year-over-year inflation rate (2020 to 2021) is now 5.39%1. If this number holds, $1 today will be equivalent in buying power to $1.05 next year. The current inflation rate page gives more detail on the latest inflation rates.
...
~~~~~~~~~~~~~~~

A bit more on this in the next post ...
 
I have constantly said that Trumps biggest problem was his communication style.

That said,

Donald Trump NEVER EVER EVER EVER said anything even remotely as retarded as the video in the OP. I mean dear baby Jesus this guy is so far off the reservation its not even funny. The fact that he is (supposedly) in charge of the free world has to scare the shit out of everyone.
 
For comparison, consider the growth of the Federal Debt over time, remember that inflation is a factor in these growing dollar amounts;
1980 - $918.4 Billion
1990 - $3.138 Trillion
2000 - $5.656 Trillion
2004 - $7.476 Trillion
2008 - $10.775 Trillion
2012 - $15.770 Trillion
2016 - $20.030 Trillion
2021 - $28.891 Trillion*

Figures for years prior to 2021 via the "Debt Clock Time Machine" function in the upper right portion of the main page here;
Note also these are 'real time' calculators so going back to say 1990 on the "time machine" a few days from now might show slight change in number/value.
* Some of this jump of 2021 versus 2016 reflects the huge budget/spending increases from the Biden Admin. of the past nine months.
~~~~~~~~~~~~
See also;
And:

US Debt By President​

The National Debt, which reached $27.8 trillion at the end of Trump's presidency, is a number that for most of us is too high to even conceive of. Through time, National Debt has continued to climb, from President to President, as a result of decision making and events that have fallen both within and outside of the White House's control.

This article will dive into how much each President has contributed to National Debt, the types of decisions they make that impact debt levels the most and the events that have shaped America’s economic reality throughout history.
...
 

Forum List

Back
Top