IPCC Issues Bleakest Warning Yet- Only Small Window Left to Save Planet

Bwahahahahahahahahahaha!!!

Cut and Paste master is baaack!

No one here believes in your IPCC god who created the stupid 8.5 modeling scenario (You know what a scenario is don't you crick?) that was so preposterous that even some of the warmist/alarmists don't accept it as it is IMPOSSIBLE.

You continue to ignore much evidence of modeling failures, consensus failures and ignoring the fact of NO climate crisis developing.

Fact: No Lower Tropospheric hot spot seen after 30 years of looking.

Fact: Warming rate is in decline since 1994.

Fact: Warming forcing of CO2 at the 430-ppm level is negligible.

Fact: Numerous prediction failures exists.

Fact: NO Positive Feedback Loop exist.

Reality defeats your delusions every time.
Then you must have some good science references to support those claims. Where might they be?

Let's address your comment about SSP5-8.5 first. Here is some data as to what the various scenarios include:

1678314031334.png

From AR 6, Summary for Policy Makers, pg 13


You'll have to forgive me but SSP5-8.5 doesn't look that crazy to me given that its emission projections fall within the other projections on every category other than CO2. I think it would be quite easy to argue that the impossible one here is SSP1-1.9. Scenario 8.5, after all, is PRECISELY what would happen were you and all the other AGW deniers to have your way.
 
Then you must have some good science references to support those claims. Where might they be?

Let's address your comment about SSP5-8.5 first. Here is some data as to what the various scenarios include:

View attachment 763759
From AR 6, Summary for Policy Makers, pg 13


You'll have to forgive me but SSP5-8.5 doesn't look that crazy to me given that its emission projections fall within the other projections on every category other than CO2. I think it would be quite easy to argue that the impossible one here is SSP1-1.9. Scenario 8.5, after all, is PRECISELY what would happen were you and all the other AGW deniers to have your way.
:auiqs.jpg:

You continue to ignore the fact that CO2 warm forcing at 430 ppm level is negligible and that the stupid Positive Feedback Loop doesn't exist.

You live in the Scenario fantasy world that only Pseudoscientist lives in.

You keep ignoring this reality over and over:

===

"Next, here is the radical change in downwelling radiation at the surface from the increase in CO2 that is supposed to be driving the “CLIMATE EMERGENCY!!!” What I’ve shown is the change that in theory would have occurred from the changes in CO2 from 1750 to the present, and the change that in theory will occur in the future when CO2 increases from its present value to twice the 1750 value. This is using the generally accepted (although not rigorously derived) claim that the downwelling radiation change from a doubling of CO2 is 3.7 watts per square metre (W/m2). The purpose is to show how small these CO2-caused changes are compared to total downwelling radiation.

change-in-downwelling-surface-radiation-2.png


The changes in downwelling radiation from the increase in CO2 are trivially small, lost in the noise …"

bolding mine
YOU continue to ignore how large the impacts of a small a change in temperature can be. The world's average temperature has risen a total of 1 centigrade degree in the 180+ years since the Industrial Revolution - a change you might not notice in your living room - yet the Arctic ice extents have fallen at least 66%, Antarctic sea ice has fallen 90%, sea level has risen over 20 cm, drinking water supplies, weather intensity, flooding, crop failures have all been affected.

What is the source of your graphic and quoted text?
 
YOU continue to ignore how large the impacts of a small a change in temperature can be. The world's average temperature has risen a total of 1 centigrade degree in the 180+ years since the Industrial Revolution - a change you might not notice in your living room - yet the Arctic ice extents have fallen at least 66%, Antarctic sea ice has fallen 90%, sea level has risen over 20 cm, drinking water supplies, weather intensity, flooding, crop failures have all been affected.

change-in-downwelling-surface-radiation-2.png

This is why you are considered a pseudoscientist because you continually IGNORE the FACTS of the following, I have posted many times, you never address it because you KNOW you can't which is why you ran off with a deflection.

No Climate Crisis exists LINK

global-climate-deaths-per-mil-mine-square.png

=====

Warming RATE declining since 1994 LINK

Figure-2.png

Figure 2. Evolution of the warming rate for 15-year periods between 1979 and 2022 in °C/decade and its linear trend, from monthly UAH 6.0 satellite temperature data.

=====

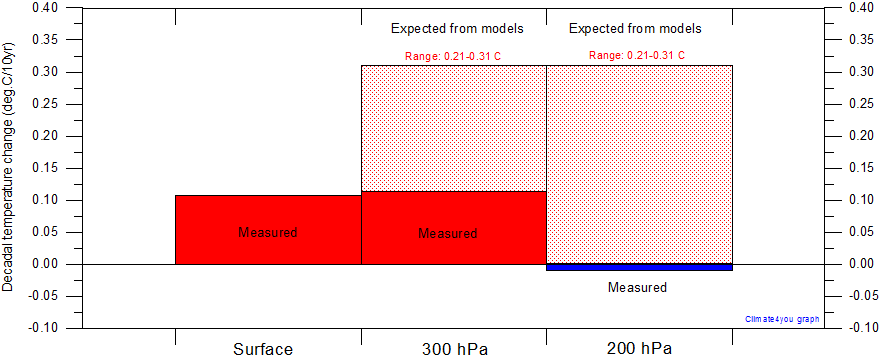
NO Hot spot exists LINK

HadAT%20200hPa%2020N-20S%20MonthlyTempSince1979%20With37monthRunningAverage.gif


HadAT%20300hPa%2020N-20S%20MonthlyTempSince1979%20With37monthRunningAverage.gif


EquatorSurface300hPa200hPaDecadalTempChange%20BARCHART.gif

Diagram showing observed linear decadal temperature change at surface, 300 hPa and 200 hPa, between 20oN and 20oS, since January 1979. Data source: HadAT and HadCRUT4. Click here to compare with modelled altitudinal temperature change pattern for doubling atmospheric CO2. Last month included in analysis: December 2012. Last diagram update: 4 May 2013.

LINK

Scroll down about 80% of the way to see the chart.
=====

NO Positive Feedback Loop either and hasn't for over 12,000 years and ultimately the last BILLION years. LINK

El_Nino_plot.jpg


=====

Little to no summer sea ice in the arctic for long periods of time in the interglacial time no calamity events is brought up and the Polar Bears and the Eskimos are here. LINK

Crick flat out lies: "Antarctic sea ice has fallen 90%"

LINK at NASA
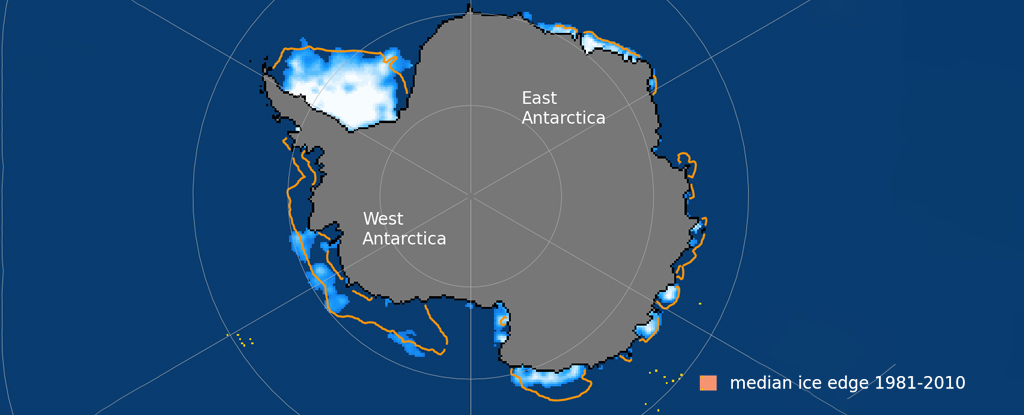
SH_decadal_plot.png

Figure 5: 10-year averages between 1979 and 2018 and yearly averages for 2012, 2014, and 2023 of the daily (a) ice extent and (b) ice area in the Southern Hemisphere and a listing of the extent and area of the current, historical mean, minimum, and maximum values in km2.

Posted many times showing that the sea ice decline at the Arctic region stopped after 2007.

======

You continue to ignore this because it utterly destroys the stupid idea that CO2 is a major climate driver when its warm forcing power is negligible at the 430 ppm level and the doubling of CO2 from 280 ppm to 556 ppm is warm forcing increase is negligible 3.7 (W/m2)

change-in-downwelling-surface-radiation-2.png

Crick then exposes his dishonest question since I have posted the link to the chart several times before when I posted this chart in front of him.

"What is the source of your graphic and quoted text?"

:cuckoo:

I stopped because you never addressed it the last few times, I posted the chart because you ignore it over and over besides it was enough for YOU to make a countering reply to it, but you didn't.
 
Last edited:
YOU continue to ignore how large the impacts of a small a change in temperature can be. The world's average temperature has risen a total of 1 centigrade degree in the 180+ years since the Industrial Revolution - a change you might not notice in your living room - yet the Arctic ice extents have fallen at least 66%, Antarctic sea ice has fallen 90%, sea level has risen over 20 cm, drinking water supplies, weather intensity, flooding, crop failures have all been affected.

What is the source of your graphic and quoted text?

A degree or two is nothing, compared the the noise of normal daily variations in temperature. Just over the course of a normal, day, the temperature in any one location can vary by a dozen degrees or more. Over the course of a year, it can vary much more than that.

If a change of a degree or two is catastrophic, than we should be seeing huge climate catastrophes on a daily basis.
 
Last edited:
A degree or two is nothing, compared the the noise of normal daily variations in temperature. Just over the course of a normal, day, the temperature in any one location can vary by a dozen degrees or more. Over the course of a year, it can vary much more than that.

If a change of a degree or two is catastrophic, than we should be seeing huge climate catastrophes on a daily basis.

I wake up around 6:30 most morning when it is around 25F outside when I go outside for various reasons I noticed it has become steaming hot since it went up more than IPPECAC predicted to a burning hot 51F a 26F increase heck of a lot more than the 2-5C increase predicted.

Manage to make it home on time will remember to bring my ice packs next time I venture out into the sweltering hot 50F weather.
 
This is why you are considered a pseudoscientist because you continually IGNORE the FACTS of the following, I have posted many times, you never address it because you KNOW you can't which is why you ran off with a deflection.

No Climate Crisis exists LINK

global-climate-deaths-per-mil-mine-square.png

=====

Warming RATE declining since 1994 LINK

Figure-2.png

Figure 2. Evolution of the warming rate for 15-year periods between 1979 and 2022 in °C/decade and its linear trend, from monthly UAH 6.0 satellite temperature data.

=====

NO Hot spot exists LINK

HadAT%20200hPa%2020N-20S%20MonthlyTempSince1979%20With37monthRunningAverage.gif


HadAT%20300hPa%2020N-20S%20MonthlyTempSince1979%20With37monthRunningAverage.gif


EquatorSurface300hPa200hPaDecadalTempChange%20BARCHART.gif

Diagram showing observed linear decadal temperature change at surface, 300 hPa and 200 hPa, between 20oN and 20oS, since January 1979. Data source: HadAT and HadCRUT4. Click here to compare with modelled altitudinal temperature change pattern for doubling atmospheric CO2. Last month included in analysis: December 2012. Last diagram update: 4 May 2013.

LINK

Scroll down about 80% of the way to see the chart.
=====

NO Positive Feedback Loop either and hasn't for over 12,000 years and ultimately the last BILLION years. LINK

El_Nino_plot.jpg


=====

Little to no summer sea ice in the arctic for long periods of time in the interglacial time no calamity events is brought up and the Polar Bears and the Eskimos are here. LINK

Crick flat out lies: "Antarctic sea ice has fallen 90%"

LINK at NASA
SH_decadal_plot.png

Figure 5: 10-year averages between 1979 and 2018 and yearly averages for 2012, 2014, and 2023 of the daily (a) ice extent and (b) ice area in the Southern Hemisphere and a listing of the extent and area of the current, historical mean, minimum, and maximum values in km2.

Posted many times showing that the sea ice decline at the Arctic region stopped after 2007.

======

You continue to ignore this because it utterly destroys the stupid idea that CO2 is a major climate driver when its warm forcing power is negligible at the 430 ppm level and the doubling of CO2 from 280 ppm to 556 ppm is warm forcing increase is negligible 3.7 (W/m2)

change-in-downwelling-surface-radiation-2.png

Crick then exposes his dishonest question since I have posted the link to the chart several times before when I posted this chart in front of him.

"What is the source of your graphic and quoted text?"

:cuckoo:

I stopped because you never addressed it the last few times, I posted the chart because you ignore it over and over besides it was enough for YOU to make a countering reply to it, but you didn't.


Which is perfectly normal for an interglacial period. The previous interglacial was worse with 26 ft higher seas with 120 ppm less CO2. :rolleyes:
 
But it is the result of an interglacial period which is a part of the glacial cycle.
According to the conclusions of thousands of scientists far more educated on this topic than you or I and who study this subject for their daily bread, it is NOT.
 
According to the conclusions of thousands of scientists far more educated on this topic than you or I and who study this subject for their daily bread, it is NOT.
I have yet to see them explain the empirical climate data because they ignore the empirical data in favor of a flawed computer model.


Yawn didn't dispute the numbers dummy; I posted similar numbers!!!

SH_decadal_plot.png

It appears you need glasses. :cool:

I was responding to your LIE:

"Antarctic sea ice has fallen 90%"

From YOUR link is this expose of how small the data history is and the hypocrisy was when warmist/alarmists ignored the very high sea ice levels of just a few years ago.

"The National Snow and Ice Data Center in the United States said Antarctica's sea ice fell to 1.91 million square kilometers (737,000 square miles) this week, the lowest extent since records began in 1979.

The previous all-time low was set last year."

===

Wow just 44 years against MILLIONS of years the Ice field has been there thus your concern is silly and CO2 isn't causing the cyclic changes in the sea ice surrounding the continent.

:auiqs.jpg:

It is clear you are continually avoiding most of my posts this day since you can't counter them.
 
I have yet to see them explain the empirical climate data because they ignore the empirical data in favor of a flawed computer model.
That is simply not true. And I am not certain that climate parameters from hundreds of millions of years ago would be considered empirical data.
Yawn didn't dispute the numbers dummy; I posted similar numbers!!!

SH_decadal_plot.png

It appears you need glasses. :cool:

I was responding to your LIE:


From YOUR link is this expose of how small the data history is and the hypocrisy was when warmist/alarmists ignored the very high sea ice levels of just a few years ago.

"The National Snow and Ice Data Center in the United States said Antarctica's sea ice fell to 1.91 million square kilometers (737,000 square miles) this week, the lowest extent since records began in 1979.

The previous all-time low was set last year."

===

Wow just 44 years against MILLIONS of years the Ice field has been there thus your concern is silly and CO2 isn't causing the cyclic changes in the sea ice surrounding the continent.

:auiqs.jpg:

It is clear you are continually avoiding most of my posts this day since you can't counter them.
I saw multiple articles claiming a 90% loss in less than a decade. Unfortunately, I could find no text articles of such reports - they were all video. I just listened to one and it turns out that NSIDC reports (somewhere) that Antarctic ice extents have fallen from 7 million square miles in 2014 to 700,000 square miles this year, a 90% drop. Obviously, 2014 was a year with unusually high sea ice extents and this year is unusually low. So, this was some cherry picking. But the claims made here that Antarctic sea ice is not declining do not hold either. It is declining. For instance, the graphic below shows 24 years with negative anomalies and only 18 with positive anomalies.

1678489648752.png

 
That is simply not true. And I am not certain that climate parameters from hundreds of millions of years ago would be considered empirical data.
Great, then post the link with their explanation for why the planet cooled for millions of years with atmospheric CO2 greater than 600 ppm?

Was radiative forcing of CO2 and its associated feedback different back then?
 
Great, then post the link with their explanation for why the planet cooled for millions of years with atmospheric CO2 greater than 600 ppm?

Was radiative forcing of CO2 and its associated feedback different back then?
Who cares? We are not living under the same conditions now.
 
My god are you stupid.
So you are saying that the feedback from CO2 at 420 ppm - which according to the models is 3 times the GHG effect of CO2 by itself - is less than the feedback from CO2 at 600 ppm and greater? That makes no sense at all.
 

Forum List

Back
Top