It is not getting better

Because of the proportionality change, the tail end of the tree ring data didn't match up with the beginning of the instrumental data

The tree ring proxy failed at the end. Was that why Mann added instrument data to tree ring data to hide the decline?
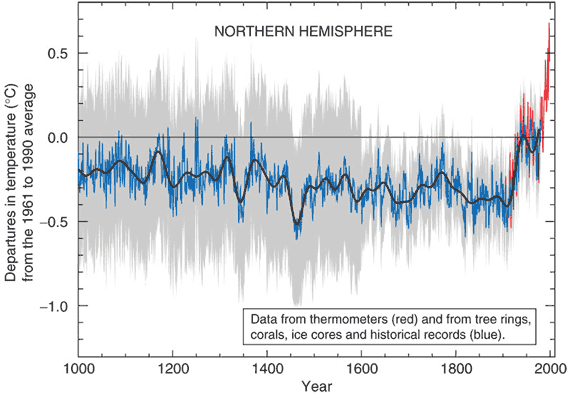
The two were clearly distinguished; plotted in two different colors and identified in the legend. If you actually think the full refutation of AGW is in that plot, Todd, you've lost you're fucking mind.
 
Because of the proportionality change, the tail end of the tree ring data didn't match up with the beginning of the instrumental data

The tree ring proxy failed at the end. Was that why Mann added instrument data to tree ring data to hide the decline?
But the hidden decline magically disappears once you adjust the baseline and add in the heat “trapped” in the deep ocean
 
The two were clearly distinguished; plotted in two different colors and identified in the legend. If you actually think the full refutation of AGW is in that plot, Todd, you've lost you're fucking mind.

The two were clearly distinguished; plotted in two different colors and identified in the legend.

Nice. Post it, so we can all enjoy the legend.

What was the trick? What was the decline? Why did they want to hide it?

If you actually think the full refutation of AGW is in that plot

Snap out of it, chucklehead.

It shows how Nobel Prize Winner Michael Mann likes to molest the data.
 
Last edited:
The two were clearly distinguished; plotted in two different colors and identified in the legend.

Nice. Post it, so we can all enjoy the legend.
Todd, did you actually think I was lying?
hockey_stick.gif

What was the trick? What was the decline? Why did they want to hide it?
As I've said repeatedly now, the proportionality factor between ring thickness and temperature changed over the last century or so. This was well known in the field of dendrochronology. They wanted to hide the apparent discontinuity that would produce and used in essence a variable scaling factor
If you actually think the full refutation of AGW is in that plot

Snap out of it, chucklehead.

It shows how Nobel Prize Winner Michael Mann likes to molest the data.
Todd, I don't see a lot of difference between a willful misinterpretation and a blatant, bold-faced lie. Do you?
 
Todd, did you actually think I was lying?
hockey_stick.gif


As I've said repeatedly now, the proportionality factor between ring thickness and temperature changed over the last century or so. This was well known in the field of dendrochronology. They wanted to hide the apparent discontinuity that would produce and used in essence a variable scaling factor

Todd, I don't see a lot of difference between a willful misinterpretation and a blatant, bold-faced lie. Do you?

Todd, did you actually think I was lying?

What was the part where he added instrument data to proxy data?

As I've said repeatedly now, the proportionality factor between ring thickness and temperature changed over the last century or so.

So what was the decline?

They wanted to hide the apparent discontinuity that would produce and used in essence a variable scaling factor


Apparent?

Todd, I don't see a lot of difference between a willful misinterpretation and a blatant, bold-faced lie. Do you?

Nobel Prize winner Michael Mann is a liar, I agree.
 
Todd, did you actually think I was lying?

What was the part where he added instrument data to proxy data?
Since they are both clearly identified, he did not.
As I've said repeatedly now, the proportionality factor between ring thickness and temperature changed over the last century or so.

So what was the decline?
Jesus, are you getting dense? It was the change in proportionality of the tree ring's response to temperature changes.
They wanted to hide the apparent discontinuity that would produce and used in essence a variable scaling factor

Apparent?
Do you think there has been a disontinuity (a finite change in zero time) in the Earth's temperature?
Todd, I don't see a lot of difference between a willful misinterpretation and a blatant, bold-faced lie. Do you?

Nobel Prize winner Michael Mann is a liar, I agree.
No, Todd, YOU are.
 
Todd, did you actually think I was lying?
hockey_stick.gif


As I've said repeatedly now, the proportionality factor between ring thickness and temperature changed over the last century or so. This was well known in the field of dendrochronology. They wanted to hide the apparent discontinuity that would produce and used in essence a variable scaling factor

Todd, I don't see a lot of difference between a willful misinterpretation and a blatant, bold-faced lie. Do you?
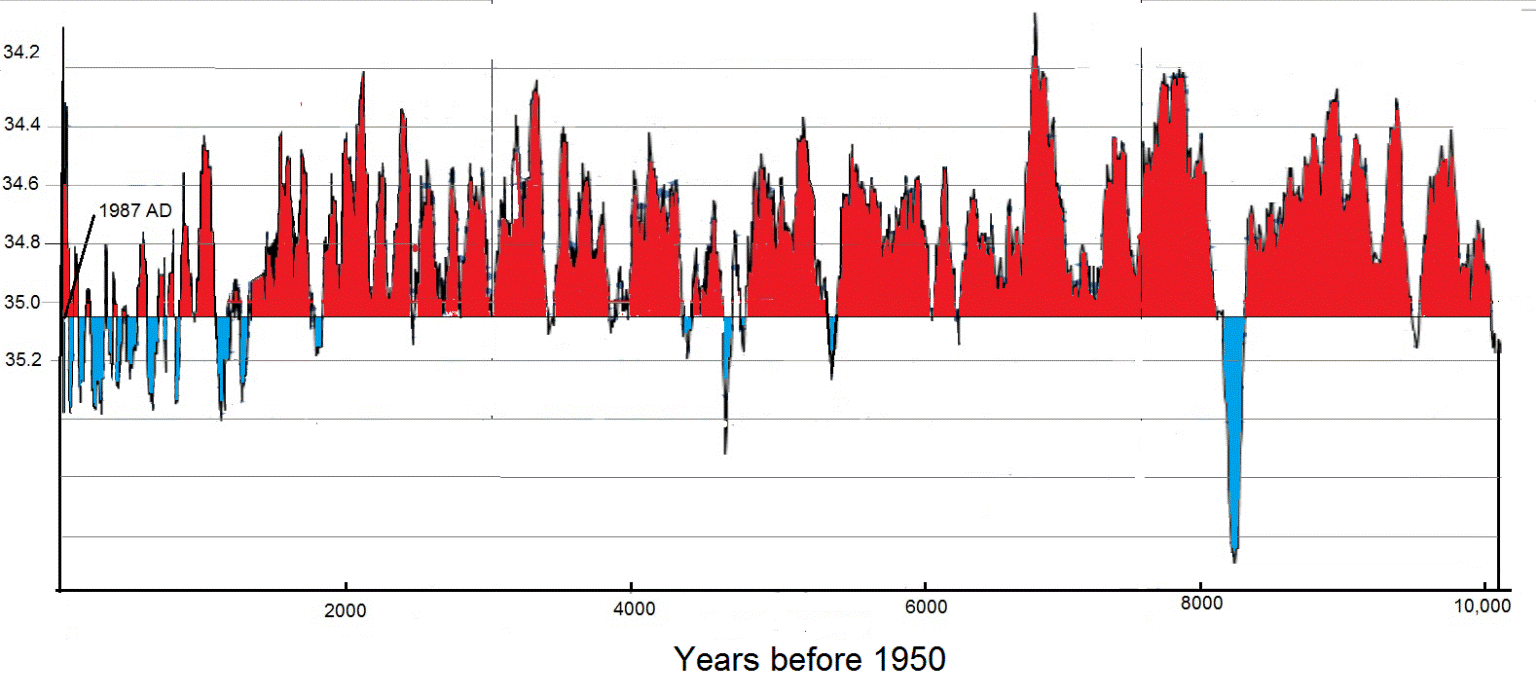
Yes. Northern hemisphere ice core data says you are lying.

don1.gif

δ18O from the GISP2 ice core for the past 10,000 years
 
Since they are both clearly identified, he did not.

Jesus, are you getting dense? It was the change in proportionality of the tree ring's response to temperature changes.

Do you think there has been a disontinuity (a finite change in zero time) in the Earth's temperature?

No, Todd, YOU are.

Since they are both clearly identified, he did not.

Did you post a graph that he produced?

It was the change in proportionality of the tree ring's response to temperature changes.

And what did that look like on the graph?

Do you think there has been a disontinuity (a finite change in zero time) in the Earth's temperature?

Nope.

No, Todd, YOU are.

Why do you feel that?
So, for Christmas, you've decided to become a troll.

What it looks like, Todd, is that you've realized you can't refute my position with actual evidence, logic or reason.
 
So, for Christmas, you've decided to become a troll.

What it looks like, Todd, is that you've realized you can't refute my position with actual evidence, logic or reason.

Your position is that Mann didn't hide anything.
Your proof was a random graph.

Merry Christmas!
 
And Frank here is faking quotes.

He knows he's faking quotes. It's been pointed out to him before.

Like I said, deniers _always_ lie.
Oh?

That does not sound anymore like the climate policy that we know.

Basically it’s a big mistake to discuss climate policy separately from the major themes of globalization. The climate summit in Cancun at the end of the month is not a climate conference, but one of the largest economic conferences since the Second World War.

An actual interview
 
Anytime you want to get embarrassed in the bull ring debating AGW, give me a call. You can even bring your stick.
I’m in. Problem with him he doesn’t ever answer a direct question. Strange
 
Your position is that Mann didn't hide anything.
Your proof was a random graph.

Merry Christmas!
Mann didn't hide anything. My evidence was Mann's graph in which the lot of you think he lied and somehow simulated a century and a half of global warming.
 
Mann didn't hide anything. My evidence was Mann's graph in which the lot of you think he lied and somehow simulated a century and a half of global warming.

Mann didn't hide anything.

There was nothing wrong with the honest graph of tree rings?

My evidence was Mann's graph

That was a graph, I saw no evidence it was Mann's.

in which the lot of you think he lied and somehow simulated a century and a half of global warming.

Are we talking about his dishonest hockey stick?

Or the one where he needed a trick to hide a decline?

Where was the decline on his graph?
Go to this link (this was the graph source). Read the article.
 
Last edited:
Go to this link (this was the graph source). Read the article.

I've been there.
I saw no evidence that that was the graph where Mann was dishonestly
adding proxy data to temperature data from 1961 to 2001.
 
I've been there.
I saw no evidence that that was the graph where Mann was dishonestly
adding proxy data to temperature data from 1961 to 2001.
So all you have is a spoonfed blurb you don't understand? I have a feeling that's not going to present an actual challenge to a robust scientific theory.
 

Forum List

Back
Top