One Graph Says It All.

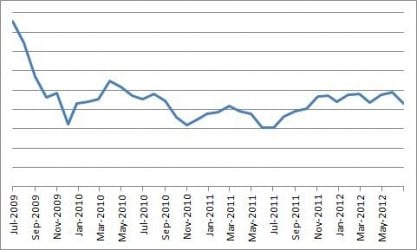
Here are the numbers (in thousands) from the BLS ...

date ..... employed civ.pop.
Jul-2009 139901 235870
Aug-2009 139492 236087
Sep-2009 138818 236322
Oct-2009 138432 236550
Nov-2009 138659 236743
Dec-2009 138013 236924
Jan-2010 138451 236832
Feb-2010 138599 236998
Mar-2010 138752 237159
Apr-2010 139309 237329
May-2010 139247 237499
Jun-2010 139148 237690
Jul-2010 139179 237890
Aug-2010 139427 238099
Sep-2010 139393 238322
Oct-2010 139111 238530
Nov-2010 139030 238715
Dec-2010 139266 238889
Jan-2011 139287 238704
Feb-2011 139422 238851
Mar-2011 139655 239000
Apr-2011 139622 239146
May-2011 139653 239313
Jun-2011 139409 239489
Jul-2011 139524 239671
Aug-2011 139904 239871
Sep-2011 140154 240071
Oct-2011 140335 240269
Nov-2011 140747 240441
Dec-2011 140836 240584
Jan-2012 141677 242269
Feb-2012 141943 242435
Mar-2012 142079 242604
Apr-2012 141963 242784
May-2012 142257 242966
Jun-2012 142432 243155
Jul-2012 142272 243354

Bureau of Labor Statistics Data

Bureau of Labor Statistics Data
 

Attachments

  • $Untitled.jpg
    $Untitled.jpg
    20.3 KB · Views: 55
Libs can't read graphs so they wont get it.
10155956_633370946752647_7005239434944822825_n.png

That chart correlates very closely to the increase in government spending under Reagan versus the actual drop in total government spending seen under Obama, proving that austerity measures pushed for by Republicans have been an abysmal failure.

That could be because the chart he posted is actually of government jobs, not total jobs. :eek::eek::eek:
 
Depends on who creates the graph and what information they used, now doesn't it?

The This-Says-It-All graph traces back to some guy named a.akamaihd's Facebook page. And it looks like the IJ Review, a blog, is where it was originally published by a guy named Fred.

The editor's first name is Bubba. Seriously. Bubba Atkinson.

Rabbit, if it wasn't for some rightwing blog, you wouldn't have anything to post.

Then you wont have any problem showing that the information in the graph is incorrect, right?
No problem at all.

Compare it to this chart ...

cumul-govt-job-growth-from-inauguration-to-jan-2013.png


Proving you to be the imbecile you are couldn't be easier.

:lol::lol::lol::lol::lol:

You've proven
1) You can't read a chart
2) You can't respond to an argument appropriately
3) You are losing this argument very very badly
4) You are a dolt.
 
Libs can't read graphs so they wont get it.
10155956_633370946752647_7005239434944822825_n.png

That chart correlates very closely to the increase in government spending under Reagan versus the actual drop in total government spending seen under Obama, proving that austerity measures pushed for by Republicans have been an abysmal failure.

Most of the drop in total gov't spending came from states pushing austerity. If you assume that all employment is government employment you might have a point. Of course if you assumed that you would also be a retard.
 
Libs can't read graphs so they wont get it.
10155956_633370946752647_7005239434944822825_n.png

That chart correlates very closely to the increase in government spending under Reagan versus the actual drop in total government spending seen under Obama, proving that austerity measures pushed for by Republicans have been an abysmal failure.

That could be because the chart he posted is actually of government jobs, not total jobs. :eek::eek::eek:

It could be. But it isn't. Because that's not what the chart shows.
/fail.
You should really give up here.

Moron, just because the person who created the chart fallaciously portayed it as total job growth when it is, in fact, government jobs, doesn't mean it is total jobs. I posted the numbers from the BLS of total jobs and the civilian population rate along with a chart created with those numbers and the chart looks nothing like the one you posted.
You did no such thing.
I'm done with you. You have proven yourself incapable of dealing with the evidence and engaging in a reasonable way.
Go away. Just go away.
 
That chart correlates very closely to the increase in government spending under Reagan versus the actual drop in total government spending seen under Obama, proving that austerity measures pushed for by Republicans have been an abysmal failure.

That could be because the chart he posted is actually of government jobs, not total jobs. :eek::eek::eek:

It could be. But it isn't. Because that's not what the chart shows.
/fail.
You should really give up here.
Here's another chart of total job growth of population. Again, it's beyond obvious to anyone with a brain that your chart is not total job growth, but of only government job growth...

083113krugman2-blog480.png

Honestly I dont have time or energy to explain to you why you have absolutely no idea what you're talking about. But trust me, you don't.
 
That could be because the chart he posted is actually of government jobs, not total jobs. :eek::eek::eek:

It could be. But it isn't. Because that's not what the chart shows.
/fail.
You should really give up here.
Here's another chart of total job growth of population. Again, it's beyond obvious to anyone with a brain that your chart is not total job growth, but of only government job growth...

083113krugman2-blog480.png

the idiot is you.

dont tell me; i just got here but i will go out on a limb and assume you're one of the lib idiots that tries to claim obama has reduced the size of "government"?

that is a LIE
 
It could be. But it isn't. Because that's not what the chart shows.
/fail.
You should really give up here.
Here's another chart of total job growth of population. Again, it's beyond obvious to anyone with a brain that your chart is not total job growth, but of only government job growth...

/QUOTE]

the idiot is you.

dont tell me; i just got here but i will go out on a limb and assume you're one of the lib idiots that tries to claim obama has reduced the size of "government"?

that is a LIE
Yeah, arrogance and stupidity are a bad combination, but he has both in spades. He is so stupid he doesn't realize what kind of mistakes he's making. I can't tell him. He wont listen. He'll deflect to something else and then call anyone disagreeing an idiot. His main problem is he can't read a graph to know what the graph is actually showing.
 
It could be. But it isn't. Because that's not what the chart shows.
/fail.
You should really give up here.

Moron, just because the person who created the chart fallaciously portayed it as total job growth when it is, in fact, government jobs, doesn't mean it is total jobs. I posted the numbers from the BLS of total jobs and the civilian population rate along with a chart created with those numbers and the chart looks nothing like the one you posted.
You did no such thing.
I'm done with you. You have proven yourself incapable of dealing with the evidence and engaging in a reasonable way.
Go away. Just go away.
Run, Forrest! Run!!! :lol:

post #101 has the numbers from the BLS and the accompanying chart you deny I posted.

See, there you go again. I didnt deny you posted it. I denied it had anything to do with what I posted. Which is the case.
Go back and read the chart carefully so you know what it purports to show. That's just a hint.
 
It could be. But it isn't. Because that's not what the chart shows.
/fail.
You should really give up here.
Here's another chart of total job growth of population. Again, it's beyond obvious to anyone with a brain that your chart is not total job growth, but of only government job growth...

083113krugman2-blog480.png

the idiot is you.

dont tell me; i just got here but i will go out on a limb and assume you're one of the lib idiots that tries to claim obama has reduced the size of "government"?

that is a LIE
Great, another imbecile. Can you follow the thread? The OP posted a chart of cummulative government job growth of the population which he ridiculously defends as being total job growth, even though he's been shown the actual numbers from the BLS. I said nothing about Obama lowering the size of government.
 
You did no such thing.
I'm done with you. You have proven yourself incapable of dealing with the evidence and engaging in a reasonable way.
Go away. Just go away.
Run, Forrest! Run!!! :lol:

post #101 has the numbers from the BLS and the accompanying chart you deny I posted.

See, there you go again. I didnt deny you posted it. I denied it had anything to do with what I posted. Which is the case.
Go back and read the chart carefully so you know what it purports to show. That's just a hint.
It claims to show the cummulative total job growth net of population growth. That's what I showed, with the numbers from the BLS, in post #101.

Actually it doesn't. You can't even read.
And no you didnt show that with numbers from BLS in post 101 either.
Oh for 2.
 
like i said you're an idiot.

the federal government has grown under obama; and obama has nothing to do with the size of the governments of states and cities; the other part of "government"
 
like i said you're an idiot.

the federal government has grown under obama; and obama has nothing to do with the size of the governments of states and cities; the other part of "government"

Little distinctions like that are meaningless to him. That's why he thinks cumulative job growth is the same as total employment, and other nonsense.
 
like i said you're an idiot.

the federal government has grown under obama; and obama has nothing to do with the size of the governments of states and cities; the other part of "government"

Rightard, for the second time ... I said nothing about the government shrinking or growing under Obama. How many more times must I inform you of that until it sinks in?
 

Forum List

Back
Top