Scientists Warn Drastic Cooling in North Atlantic Beyond Worst Fears

Please tell us how much 33F water is required to lower the North Atlantic ocean one degree.

Please tell us why you think the whole ocean has to be chilled.

You're just stupid. As I keep telling you, you have no business bothering the grownups with your idiot prattle.
 
Last edited:
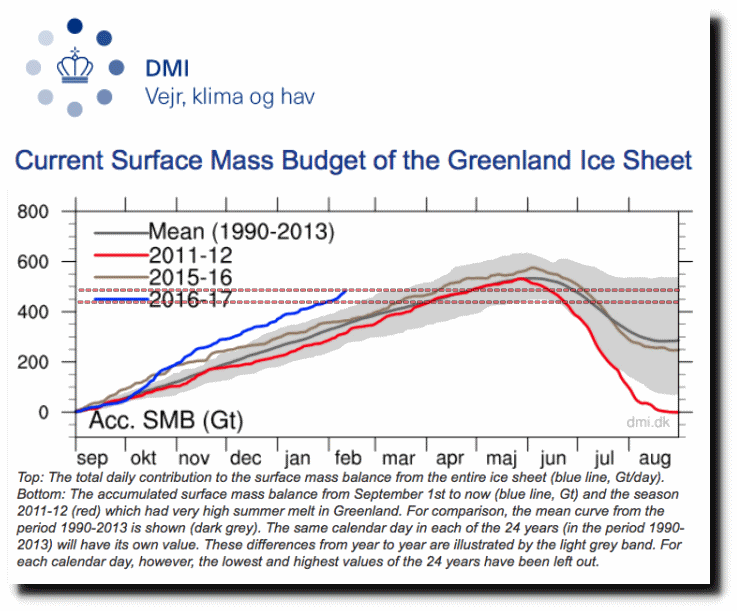
Yeah...this chart shows how much ice water is flooding off Greenland...the ice gain on Greenland is breaking all records...gaining ice at a rate of about 5 billion tons per day.

That's the surface mass balance, dumbass, not the total mass balance. There's an edge as well as a surface. Glacier calving is not taken into account in the surface mass balance. The page makes that very clear, that calving is not part of the surface mass balance.

Greenland Ice Sheet Surface Mass Budget: DMI
---
If climate changes, the surface mass balance may change such that it no longer matches the calving and the ice sheet can start to gain or lose mass.
---

Oops. Another crazy claim of yours debunked. Were you just being an idiot again, brainlessly parroting cult propaganda, or was it deliberate dishonesty? In any case, everyone knows you'll now refuse to admit you pooched it hard, and that you'll just deny reality and dig ever deeper into the stupid-hole.

Screen-Shot-2017-02-11-at-11.02.43-PM-down.gif
 
Please tell us how much 33F water is required to lower the North Atlantic ocean one degree.

Please tell us why you think the whole ocean has to be chilled.

You're just stupid. As I keep telling you, you have no business bothering the grownups with your idiot prattle.
Ok, tell us how much 33F water is needed to chill the part of the North Atlantic you think is important.
 
Yeah...this chart shows how much ice water is flooding off Greenland...the ice gain on Greenland is breaking all records...gaining ice at a rate of about 5 billion tons per day.

That's the surface mass balance, dumbass, not the total mass balance. There's an edge as well as a surface. Glacier calving is not taken into account in the surface mass balance. The page makes that very clear, that calving is not part of the surface mass balance.

Greenland Ice Sheet Surface Mass Budget: DMI
---
If climate changes, the surface mass balance may change such that it no longer matches the calving and the ice sheet can start to gain or lose mass.
---

Oops. Another crazy claim of yours debunked. Were you just being an idiot again, brainlessly parroting cult propaganda, or was it deliberate dishonesty? In any case, everyone knows you'll now refuse to admit you pooched it hard, and that you'll just deny reality and dig ever deeper into the stupid-hole.

That's the surface mass balance, dumbass, not the total mass balance.
So ice is in the rocks? How much?
And learn what calving is, of course it's not included in that data.
 
Well, I guess it's head-up-the-ass 'alternative-reality' wacko-quacko time in Denierstan again.....but then, when isn't it?

I posted the facts about the accelerating Greenland ice loss being responsible for the cooling of the waters around Greenland, which make a mockery of this deranged and very ignorant thread, in post #28....which was followed by eight posts by reality denying denier cult wackos demonstrating how clueless and brainwashed they are.

In the real world....

1_5_17_Andrea_CC_Greenlandmoulin_720_479_s_c1_c_c.jpg
Meltwater pours into a hole called a moulin on the surface of the Greenland Ice Sheet. - Click image to enlarge. Credit: J. Box/ESA

Greenland Ice Loss Accelerates 110-Year-Old Record Reveals
Scientists have pieced together a history of Greenland’s ice over the last century

Scientific American
By Malavika Vyawahare
December 17, 2015
(excerpts)
Thousands of black-and-white aerial photographs of Greenland taken between 1978 and 1987 are helping scientists reconstruct a 110-year-long record of ice loss in this region.

A new study published in Nature yesterday that used the photographs found that the Greenland ice sheet lost about 9,000 gigatons of ice between 1900 and 2010 and that the rate has accelerated in recent years. The reduction in the ice mass has contributed to global average sea-level rise of 25 millimeters.

The results are consistent with other estimates, but this is the first time scientists have used actual observations from this far back in time rather than relying on model-generated estimates. “We have observation-based estimates that is new and super important,” emphasized Kristian Kjellerup Kjeldsen, the lead author of the study at the Natural History Museum of Denmark.

Reliable records of this scope both in time and geographic area are difficult to obtain because the use of satellite imagery for climate research became popular only in the 1990s. “The effort to use the old photographs to learn how the margins of the ice sheet have changed is wonderful,” said Richard Alley, a glaciologist at Pennsylvania State University. “There have been many efforts over the years to photograph the edge of the ice sheet, for many purposes,” he added. “This new effort is the most comprehensive and consistent that I know of to pull evidence together and produces useful and important results.

The study -- the result of an international team led by climate researchers at the Natural History Museum of Denmark -- divided the studied time period into three phases, largely dictated by the availability of data: 1900 to 1983, 1983 to 2003, and 2003 to 2010.

The 1900 start date was chosen to mark the end of what is called as the Little Ice Age. There is some debate about when the “Little Ice Age” -- the last time when global average temperatures were falling -- ended, but it is well documented that glaciers started receding around that time as a result of the relative warming of the planet. Regional variations notwithstanding, 1900 was a fair guess for when all of the Greenland ice sheet was in retreat, Kjeldsen said.

More than 3,500 images were recorded during aerial surveys by the National Survey and Cadastre of Denmark in the late 1970s and early ’80s, captured with a camera that used film. These were very high-resolution images that were later digitized.

The 1983 time stamp for the start of the second phase was chosen because it was the midpoint of the period when the photographs were taken. The images from this period are not just a window into where the boundaries of glaciers were when the photographs were taken, but a measure of how far they had receded from their maximum expansion at the end of the Little Ice Age. The photographs of the landscape allowed the researchers to visually capture the extent to which the boundaries of the glaciers had receded since the 1900s.

The line that demarcates the farthest reach of a glacier from areas that have not been overrun by a glacier is called the trim line. It can be distinguished by the difference in the vegetative cover on either side of the line. When glaciers advance, they erode and transform the landscape they pass over. When they retreat, they leave behind a freshly polished, pristine landscape that is markedly different from land that has not been buried under an ice sheet.

The movement of these large masses of ice also leaves distinct marks on the walls of valleys and in the form of deposits of glacial sediment. Much of the work of analyzing the photographs in the study was left to sophisticated software that is designed for the purpose of processing images and generating estimates.

Observing techniques have vastly improved with greater reliance on remote sensing data from satellites and aircraft that capture high-resolution images over large areas. For the last phase, from 2003 to 2010, the researchers relied on laser altimetry and radar altimetry to estimate the ice elevation and map the receding ice sheet.


Their estimations show an average annual ice loss of about 75 gigatons for the first two phases—an 80-year-long period and a 20-year one.
The most recent data showed that an average of 186 gigatons of ice was lost during 2003-10, which is only a seven-year period.
Please tell us how much 33F water is required to lower the North Atlantic ocean one degree.

How crazy are you, WitheredMan?

Your OP on this thread is about a cooling of the Labrador Sea off the coast of Greenland. It is an observed and measured phenomenon. How exactly does it matter whether or not you know precisely how much ice water flowing off Greenland it took to lower the ocean temperatures around Greenland by "one degree"?

The article from Scientific American that I just cited gave this figure, BTW.....

"The most recent data showed that an average of 186 gigatons of ice was lost during 2003-10, which is only a seven-year period."

Those figures are for a period of time that ended in 2010....the melting has accelerated even more since then.

Your question is the kind of meaningless twaddle that crackpot science deniers like you throw out just to try to confuse the issue.

In the real world.....

Ice loss accelerating in Greenland's coastal glaciers
ScienceDaily
Source: Dartmouth College Science News
April 28, 2016
(excerpts)
Dartmouth College scientists have found that surface meltwater draining through and underneath Greenland's tidewater glaciers is accelerating their loss of ice mass, in a study that sheds light on the relationship between meltwater and subglacial discharge. Greenland has the potential to contribute six to seven meters of global sea level rise predominantly through ice mass lost out of large tidewater glaciers. The findings appear in the journal Annals of Glaciology.
So you really do not know the Labrador Sea is part of the earths vast ocean with currents flowing through it. It is not a lake like the Sea of Galilee. It is a very large area with large currents flowing through it.

upload_2017-3-8_13-13-18.png
 
Well, I guess it's head-up-the-ass 'alternative-reality' wacko-quacko time in Denierstan again.....but then, when isn't it?

I posted the facts about the accelerating Greenland ice loss being responsible for the cooling of the waters around Greenland, which make a mockery of this deranged and very ignorant thread, in post #28....which was followed by eight posts by reality denying denier cult wackos demonstrating how clueless and brainwashed they are.

In the real world....

1_5_17_Andrea_CC_Greenlandmoulin_720_479_s_c1_c_c.jpg
Meltwater pours into a hole called a moulin on the surface of the Greenland Ice Sheet. - Click image to enlarge. Credit: J. Box/ESA

Greenland Ice Loss Accelerates 110-Year-Old Record Reveals
Scientists have pieced together a history of Greenland’s ice over the last century

Scientific American
By Malavika Vyawahare
December 17, 2015
(excerpts)
Thousands of black-and-white aerial photographs of Greenland taken between 1978 and 1987 are helping scientists reconstruct a 110-year-long record of ice loss in this region.

A new study published in Nature yesterday that used the photographs found that the Greenland ice sheet lost about 9,000 gigatons of ice between 1900 and 2010 and that the rate has accelerated in recent years. The reduction in the ice mass has contributed to global average sea-level rise of 25 millimeters.

The results are consistent with other estimates, but this is the first time scientists have used actual observations from this far back in time rather than relying on model-generated estimates. “We have observation-based estimates that is new and super important,” emphasized Kristian Kjellerup Kjeldsen, the lead author of the study at the Natural History Museum of Denmark.

Reliable records of this scope both in time and geographic area are difficult to obtain because the use of satellite imagery for climate research became popular only in the 1990s. “The effort to use the old photographs to learn how the margins of the ice sheet have changed is wonderful,” said Richard Alley, a glaciologist at Pennsylvania State University. “There have been many efforts over the years to photograph the edge of the ice sheet, for many purposes,” he added. “This new effort is the most comprehensive and consistent that I know of to pull evidence together and produces useful and important results.

The study -- the result of an international team led by climate researchers at the Natural History Museum of Denmark -- divided the studied time period into three phases, largely dictated by the availability of data: 1900 to 1983, 1983 to 2003, and 2003 to 2010.

The 1900 start date was chosen to mark the end of what is called as the Little Ice Age. There is some debate about when the “Little Ice Age” -- the last time when global average temperatures were falling -- ended, but it is well documented that glaciers started receding around that time as a result of the relative warming of the planet. Regional variations notwithstanding, 1900 was a fair guess for when all of the Greenland ice sheet was in retreat, Kjeldsen said.

More than 3,500 images were recorded during aerial surveys by the National Survey and Cadastre of Denmark in the late 1970s and early ’80s, captured with a camera that used film. These were very high-resolution images that were later digitized.

The 1983 time stamp for the start of the second phase was chosen because it was the midpoint of the period when the photographs were taken. The images from this period are not just a window into where the boundaries of glaciers were when the photographs were taken, but a measure of how far they had receded from their maximum expansion at the end of the Little Ice Age. The photographs of the landscape allowed the researchers to visually capture the extent to which the boundaries of the glaciers had receded since the 1900s.

The line that demarcates the farthest reach of a glacier from areas that have not been overrun by a glacier is called the trim line. It can be distinguished by the difference in the vegetative cover on either side of the line. When glaciers advance, they erode and transform the landscape they pass over. When they retreat, they leave behind a freshly polished, pristine landscape that is markedly different from land that has not been buried under an ice sheet.

The movement of these large masses of ice also leaves distinct marks on the walls of valleys and in the form of deposits of glacial sediment. Much of the work of analyzing the photographs in the study was left to sophisticated software that is designed for the purpose of processing images and generating estimates.

Observing techniques have vastly improved with greater reliance on remote sensing data from satellites and aircraft that capture high-resolution images over large areas. For the last phase, from 2003 to 2010, the researchers relied on laser altimetry and radar altimetry to estimate the ice elevation and map the receding ice sheet.


Their estimations show an average annual ice loss of about 75 gigatons for the first two phases—an 80-year-long period and a 20-year one.
The most recent data showed that an average of 186 gigatons of ice was lost during 2003-10, which is only a seven-year period.
Please tell us how much 33F water is required to lower the North Atlantic ocean one degree.

How crazy are you, WitheredMan?

Your OP on this thread is about a cooling of the Labrador Sea off the coast of Greenland. It is an observed and measured phenomenon. How exactly does it matter whether or not you know precisely how much ice water flowing off Greenland it took to lower the ocean temperatures around Greenland by "one degree"?

The article from Scientific American that I just cited gave this figure, BTW.....

"The most recent data showed that an average of 186 gigatons of ice was lost during 2003-10, which is only a seven-year period."

Those figures are for a period of time that ended in 2010....the melting has accelerated even more since then.

Your question is the kind of meaningless twaddle that crackpot science deniers like you throw out just to try to confuse the issue.

In the real world.....

Ice loss accelerating in Greenland's coastal glaciers
ScienceDaily
Source: Dartmouth College Science News
April 28, 2016
(excerpts)
Dartmouth College scientists have found that surface meltwater draining through and underneath Greenland's tidewater glaciers is accelerating their loss of ice mass, in a study that sheds light on the relationship between meltwater and subglacial discharge. Greenland has the potential to contribute six to seven meters of global sea level rise predominantly through ice mass lost out of large tidewater glaciers. The findings appear in the journal Annals of Glaciology.
So you really do not know the Labrador Sea is part of the earths vast ocean with currents flowing through it. It is not a lake like the Sea of Galilee. It is a very large area with large currents flowing through it.

View attachment 116013[/QUOTE]

So what, retard?

That has no bearing on the observed fact that the ocean waters around Greenland are getting colder....or the observed fact that the glaciers around Greenland's coast are melting and losing ice at accelerating rates.
 
Well, I guess it's head-up-the-ass 'alternative-reality' wacko-quacko time in Denierstan again.....but then, when isn't it?

I posted the facts about the accelerating Greenland ice loss being responsible for the cooling of the waters around Greenland, which make a mockery of this deranged and very ignorant thread, in post #28....which was followed by eight posts by reality denying denier cult wackos demonstrating how clueless and brainwashed they are.

In the real world....

1_5_17_Andrea_CC_Greenlandmoulin_720_479_s_c1_c_c.jpg
Meltwater pours into a hole called a moulin on the surface of the Greenland Ice Sheet. - Click image to enlarge. Credit: J. Box/ESA

Greenland Ice Loss Accelerates 110-Year-Old Record Reveals
Scientists have pieced together a history of Greenland’s ice over the last century

Scientific American
By Malavika Vyawahare
December 17, 2015
(excerpts)
Thousands of black-and-white aerial photographs of Greenland taken between 1978 and 1987 are helping scientists reconstruct a 110-year-long record of ice loss in this region.

A new study published in Nature yesterday that used the photographs found that the Greenland ice sheet lost about 9,000 gigatons of ice between 1900 and 2010 and that the rate has accelerated in recent years. The reduction in the ice mass has contributed to global average sea-level rise of 25 millimeters.

The results are consistent with other estimates, but this is the first time scientists have used actual observations from this far back in time rather than relying on model-generated estimates. “We have observation-based estimates that is new and super important,” emphasized Kristian Kjellerup Kjeldsen, the lead author of the study at the Natural History Museum of Denmark.

Reliable records of this scope both in time and geographic area are difficult to obtain because the use of satellite imagery for climate research became popular only in the 1990s. “The effort to use the old photographs to learn how the margins of the ice sheet have changed is wonderful,” said Richard Alley, a glaciologist at Pennsylvania State University. “There have been many efforts over the years to photograph the edge of the ice sheet, for many purposes,” he added. “This new effort is the most comprehensive and consistent that I know of to pull evidence together and produces useful and important results.

The study -- the result of an international team led by climate researchers at the Natural History Museum of Denmark -- divided the studied time period into three phases, largely dictated by the availability of data: 1900 to 1983, 1983 to 2003, and 2003 to 2010.

The 1900 start date was chosen to mark the end of what is called as the Little Ice Age. There is some debate about when the “Little Ice Age” -- the last time when global average temperatures were falling -- ended, but it is well documented that glaciers started receding around that time as a result of the relative warming of the planet. Regional variations notwithstanding, 1900 was a fair guess for when all of the Greenland ice sheet was in retreat, Kjeldsen said.

More than 3,500 images were recorded during aerial surveys by the National Survey and Cadastre of Denmark in the late 1970s and early ’80s, captured with a camera that used film. These were very high-resolution images that were later digitized.

The 1983 time stamp for the start of the second phase was chosen because it was the midpoint of the period when the photographs were taken. The images from this period are not just a window into where the boundaries of glaciers were when the photographs were taken, but a measure of how far they had receded from their maximum expansion at the end of the Little Ice Age. The photographs of the landscape allowed the researchers to visually capture the extent to which the boundaries of the glaciers had receded since the 1900s.

The line that demarcates the farthest reach of a glacier from areas that have not been overrun by a glacier is called the trim line. It can be distinguished by the difference in the vegetative cover on either side of the line. When glaciers advance, they erode and transform the landscape they pass over. When they retreat, they leave behind a freshly polished, pristine landscape that is markedly different from land that has not been buried under an ice sheet.

The movement of these large masses of ice also leaves distinct marks on the walls of valleys and in the form of deposits of glacial sediment. Much of the work of analyzing the photographs in the study was left to sophisticated software that is designed for the purpose of processing images and generating estimates.

Observing techniques have vastly improved with greater reliance on remote sensing data from satellites and aircraft that capture high-resolution images over large areas. For the last phase, from 2003 to 2010, the researchers relied on laser altimetry and radar altimetry to estimate the ice elevation and map the receding ice sheet.


Their estimations show an average annual ice loss of about 75 gigatons for the first two phases—an 80-year-long period and a 20-year one.
The most recent data showed that an average of 186 gigatons of ice was lost during 2003-10, which is only a seven-year period.
Please tell us how much 33F water is required to lower the North Atlantic ocean one degree.

How crazy are you, WitheredMan?

Your OP on this thread is about a cooling of the Labrador Sea off the coast of Greenland. It is an observed and measured phenomenon. How exactly does it matter whether or not you know precisely how much ice water flowing off Greenland it took to lower the ocean temperatures around Greenland by "one degree"?

The article from Scientific American that I just cited gave this figure, BTW.....

"The most recent data showed that an average of 186 gigatons of ice was lost during 2003-10, which is only a seven-year period."

Those figures are for a period of time that ended in 2010....the melting has accelerated even more since then.

Your question is the kind of meaningless twaddle that crackpot science deniers like you throw out just to try to confuse the issue.

In the real world.....

Ice loss accelerating in Greenland's coastal glaciers
ScienceDaily
Source: Dartmouth College Science News
April 28, 2016
(excerpts)
Dartmouth College scientists have found that surface meltwater draining through and underneath Greenland's tidewater glaciers is accelerating their loss of ice mass, in a study that sheds light on the relationship between meltwater and subglacial discharge. Greenland has the potential to contribute six to seven meters of global sea level rise predominantly through ice mass lost out of large tidewater glaciers. The findings appear in the journal Annals of Glaciology.
So you really do not know the Labrador Sea is part of the earths vast ocean with currents flowing through it. It is not a lake like the Sea of Galilee. It is a very large area with large currents flowing through it.

View attachment 116013

So what, little retard?

What do you imagine that factoid has to do with the observed fact that the ocean waters around Greenland are getting colder?....or with the observed fact that the glaciers around Greenland's coastline are melting and pouring ice water into the ocean at an accelerating rate that currently amounts to several dozen gigatons (billions of tons) of water every year?
So you have no idea how much water at 33F is required to cool the Labrador Sea one degree F wo support your absurd claim.
Yet another anti-science myther busted.
 
Well, I guess it's head-up-the-ass 'alternative-reality' wacko-quacko time in Denierstan again.....but then, when isn't it?

I posted the facts about the accelerating Greenland ice loss being responsible for the cooling of the waters around Greenland, which make a mockery of this deranged and very ignorant thread, in post #28....which was followed by eight posts by reality denying denier cult wackos demonstrating how clueless and brainwashed they are.

In the real world....

1_5_17_Andrea_CC_Greenlandmoulin_720_479_s_c1_c_c.jpg
Meltwater pours into a hole called a moulin on the surface of the Greenland Ice Sheet. - Click image to enlarge. Credit: J. Box/ESA

Greenland Ice Loss Accelerates 110-Year-Old Record Reveals
Scientists have pieced together a history of Greenland’s ice over the last century

Scientific American
By Malavika Vyawahare
December 17, 2015
(excerpts)
Thousands of black-and-white aerial photographs of Greenland taken between 1978 and 1987 are helping scientists reconstruct a 110-year-long record of ice loss in this region.

A new study published in Nature yesterday that used the photographs found that the Greenland ice sheet lost about 9,000 gigatons of ice between 1900 and 2010 and that the rate has accelerated in recent years. The reduction in the ice mass has contributed to global average sea-level rise of 25 millimeters.

The results are consistent with other estimates, but this is the first time scientists have used actual observations from this far back in time rather than relying on model-generated estimates. “We have observation-based estimates that is new and super important,” emphasized Kristian Kjellerup Kjeldsen, the lead author of the study at the Natural History Museum of Denmark.

Reliable records of this scope both in time and geographic area are difficult to obtain because the use of satellite imagery for climate research became popular only in the 1990s. “The effort to use the old photographs to learn how the margins of the ice sheet have changed is wonderful,” said Richard Alley, a glaciologist at Pennsylvania State University. “There have been many efforts over the years to photograph the edge of the ice sheet, for many purposes,” he added. “This new effort is the most comprehensive and consistent that I know of to pull evidence together and produces useful and important results.

The study -- the result of an international team led by climate researchers at the Natural History Museum of Denmark -- divided the studied time period into three phases, largely dictated by the availability of data: 1900 to 1983, 1983 to 2003, and 2003 to 2010.

The 1900 start date was chosen to mark the end of what is called as the Little Ice Age. There is some debate about when the “Little Ice Age” -- the last time when global average temperatures were falling -- ended, but it is well documented that glaciers started receding around that time as a result of the relative warming of the planet. Regional variations notwithstanding, 1900 was a fair guess for when all of the Greenland ice sheet was in retreat, Kjeldsen said.

More than 3,500 images were recorded during aerial surveys by the National Survey and Cadastre of Denmark in the late 1970s and early ’80s, captured with a camera that used film. These were very high-resolution images that were later digitized.

The 1983 time stamp for the start of the second phase was chosen because it was the midpoint of the period when the photographs were taken. The images from this period are not just a window into where the boundaries of glaciers were when the photographs were taken, but a measure of how far they had receded from their maximum expansion at the end of the Little Ice Age. The photographs of the landscape allowed the researchers to visually capture the extent to which the boundaries of the glaciers had receded since the 1900s.

The line that demarcates the farthest reach of a glacier from areas that have not been overrun by a glacier is called the trim line. It can be distinguished by the difference in the vegetative cover on either side of the line. When glaciers advance, they erode and transform the landscape they pass over. When they retreat, they leave behind a freshly polished, pristine landscape that is markedly different from land that has not been buried under an ice sheet.

The movement of these large masses of ice also leaves distinct marks on the walls of valleys and in the form of deposits of glacial sediment. Much of the work of analyzing the photographs in the study was left to sophisticated software that is designed for the purpose of processing images and generating estimates.

Observing techniques have vastly improved with greater reliance on remote sensing data from satellites and aircraft that capture high-resolution images over large areas. For the last phase, from 2003 to 2010, the researchers relied on laser altimetry and radar altimetry to estimate the ice elevation and map the receding ice sheet.


Their estimations show an average annual ice loss of about 75 gigatons for the first two phases—an 80-year-long period and a 20-year one.
The most recent data showed that an average of 186 gigatons of ice was lost during 2003-10, which is only a seven-year period.
Please tell us how much 33F water is required to lower the North Atlantic ocean one degree.

How crazy are you, WitheredMan?

Your OP on this thread is about a cooling of the Labrador Sea off the coast of Greenland. It is an observed and measured phenomenon. How exactly does it matter whether or not you know precisely how much ice water flowing off Greenland it took to lower the ocean temperatures around Greenland by "one degree"?

The article from Scientific American that I just cited gave this figure, BTW.....

"The most recent data showed that an average of 186 gigatons of ice was lost during 2003-10, which is only a seven-year period."

Those figures are for a period of time that ended in 2010....the melting has accelerated even more since then.

Your question is the kind of meaningless twaddle that crackpot science deniers like you throw out just to try to confuse the issue.

In the real world.....

Ice loss accelerating in Greenland's coastal glaciers
ScienceDaily
Source: Dartmouth College Science News
April 28, 2016
(excerpts)
Dartmouth College scientists have found that surface meltwater draining through and underneath Greenland's tidewater glaciers is accelerating their loss of ice mass, in a study that sheds light on the relationship between meltwater and subglacial discharge. Greenland has the potential to contribute six to seven meters of global sea level rise predominantly through ice mass lost out of large tidewater glaciers. The findings appear in the journal Annals of Glaciology.
So you really do not know the Labrador Sea is part of the earths vast ocean with currents flowing through it. It is not a lake like the Sea of Galilee. It is a very large area with large currents flowing through it.

View attachment 116013

So what, little retard?

What do you imagine that factoid has to do with the observed fact that the ocean waters around Greenland are getting colder?....or with the observed fact that the glaciers around Greenland's coastline are melting and pouring ice water into the ocean at an accelerating rate that currently amounts to several dozen gigatons (billions of tons) of water every year?
So you have no idea how much water at 33F is required to cool the Labrador Sea one degree F wo support your absurd claim.
You poor retard! My quite factual claim is supported by ALL of the scientific research that has been done on Greenland's ice cap.....as reflected in the science articles I quoted.

Your idiotic question about exactly how much ice melt water coming off Greenland it would take to raise the temperature of an indeterminate amount of water by some arbitrary amount is just meaningless nonsense that has no bearing on the already measured decrease in the temperatures of ocean waters around Greenland.

'Yet another anti-science Denier Cult myther busted.'

New details of Greenland ice loss revealed
Data are dramatically increasing knowledge of how the ocean is melting the ice sheet

ScienceDaily
Source: University of California - Irvine
February 9, 2017
Less than a year after the first research flight kicked off NASA's Oceans Melting Greenland campaign, data from the new program are providing a dramatic increase in knowledge of how Greenland's ice sheet is melting from below. Two new research papers in the journal Oceanography, including one by UCI Earth system scientist Mathieu Morlighem, use OMG observations to document how meltwater and ocean currents are interacting along Greenland's west coast and to improve seafloor maps used to predict future melting and sea level rise.

OMG is a five-year campaign to study the glaciers and ocean along Greenland's 27,000-mile coastline. Its goal is to find out where and how fast seawater is melting the glacial ice. Most of the coastline and seafloor around the ice sheet had never been surveyed, so the 2016 flights expanded scientists' knowledge of Greenland significantly. Future years of data collection will reveal the rate of change around the island.

The water circulating close around the Greenland Ice Sheet is like a cold river floating atop a warm, salty ocean. The top 600 feet (200 meters) of colder water is relatively fresh and comes from the Arctic. Below that is saltwater that comes from the south, 6 to 8 degrees Fahrenheit (3 to 4 degrees Celsius) warmer than the fresher water above. The layers don't mix much because freshwater weighs less than saltwater, so it stays afloat.

If a glacier reaches the ocean where the seafloor is shallow, the ice interacts with frigid freshwater and melts slowly. Conversely, if the seafloor in front of a glacier is deep, the ice spills into the warm subsurface layer of saltwater and may melt relatively rapidly. Satellite remote sensing can't see below the surface to discern the depth of the seafloor or study the layers of water. OMG makes these measurements with shipboard and airborne instruments.

Improving maps used to project sea level rise

In the first paper, UCI's Morlighem used the OMG surveys to improve maps of the bedrock under some of the West Coast glaciers. Glaciologists worldwide use these and other maps in modeling the rate of ice loss in Greenland and projecting future losses.

A coastal glacier's response to a warming climate depends heavily not only on the depth of the seafloor in front of it, as explained above, but on the shape of the bedrock below it. Before OMG, virtually the only measurements Morlighem had of these critical landscapes were long, narrow strips of data collected along flight lines of research aircraft, sometimes tens of miles inland (upstream) from a glacier's ocean front. He has been estimating the shape of the bedrock outside of the flight lines with the help of other data such as ice flow speeds, but formerly had no good way to check how accurate his estimates are at the coastline.

Morlighem noted, "OMG [data are] not only improving our knowledge of the ocean floor, they're improving our knowledge of the topography of the land, too." This is because the campaign's seafloor survey revealed features under the ocean, such as troughs cut by glaciers during the last ice age, which must continue upstream under the glacial ice. Therefore, Morlighem said, "By having OMG's measurements close to the ice front, I can tell whether what I thought about the bed topography is correct or not." Morlighem was pleasantly surprised to discover that 90 percent of the glacier depths he had estimated were within 160 feet (50 meters) of the actual depths recorded by the OMG survey.

Tracking meltwater far into the North

In the second paper, Ian Fenty of NASA's Jet Propulsion Laboratory, Pasadena, California, and coauthors, including Morlighem, tracked water up the West Coast to see how it changed as it interacted with hundreds of melting coastal glaciers. They found that in northwest Greenland, cold and fresh water flowing into glacial fjords from the melting surface of the ice sheet is cooling the warmer subsurface water, which circulates clockwise around the island. In one instance, evidence for meltwater-cooled waters was found in fjords 100 miles (160 kilometers) downstream from its source. Fenty noted, "This is the first time we've documented glacier meltwater significantly impacting ocean temperatures so far downstream. That shows meltwater can play an important role in determining how much ocean heat ultimately reaches Greenland's glaciers."

The OMG data have enough detail that researchers are beginning to pinpoint the ice-loss risk for individual glaciers along the coast, according to principal investigator Josh Willis of JPL. "Without OMG, we wouldn't be able to conclude that Upernavik Glacier is vulnerable to ocean warming, whereas Cornell Glacier is less vulnerable," he said.

Story Source:

Materials provided by University of California - Irvine.

Journal References:

* Mathieu Morlighem, Eric Rignot, Josh Willis. Improving Bed Topography Mapping of Greenland Glaciers Using NASA’s Oceans Melting Greenland (OMG) Data. Oceanography, 2016; 29 (4): 62 DOI: 10.5670/oceanog.2016.99
* Ian Fenty, Josh Willis, Ala Khazendar, Steven Dinardo, René Forsberg, Ichiro Fukumori, David Holland, Martin Jakobsson, Delwyn Moller, James Morison, Andreas Münchow, Eric Rignot, Michael Schodlok, Andrew Thompson, Kirsteen Tinto, Matthew Rutherford, Nicole Trenholm. Oceans Melting Greenland: Early Results from NASA’s Ocean-Ice Mission in Greenland. Oceanography, 2016; 29 (4): 72 DOI: 10.5670/oceanog.2016.100
Thermal layers are normal in all parts of the ocean, from the tropics to the poles. They have made great hiding spots for our submarines for decades.
But my question is how many gallons of water at 33F is required to change the temperature of the Labrador Sea one degree F. Someone sitting at the end of a glacier and saying the water is cold here means nothing.
 
Well, I guess it's head-up-the-ass 'alternative-reality' wacko-quacko time in Denierstan again.....but then, when isn't it?

I posted the facts about the accelerating Greenland ice loss being responsible for the cooling of the waters around Greenland, which make a mockery of this deranged and very ignorant thread, in post #28....which was followed by eight posts by reality denying denier cult wackos demonstrating how clueless and brainwashed they are.

In the real world....

1_5_17_Andrea_CC_Greenlandmoulin_720_479_s_c1_c_c.jpg
Meltwater pours into a hole called a moulin on the surface of the Greenland Ice Sheet. - Click image to enlarge. Credit: J. Box/ESA

Greenland Ice Loss Accelerates 110-Year-Old Record Reveals
Scientists have pieced together a history of Greenland’s ice over the last century

Scientific American
By Malavika Vyawahare
December 17, 2015
(excerpts)
Thousands of black-and-white aerial photographs of Greenland taken between 1978 and 1987 are helping scientists reconstruct a 110-year-long record of ice loss in this region.

A new study published in Nature yesterday that used the photographs found that the Greenland ice sheet lost about 9,000 gigatons of ice between 1900 and 2010 and that the rate has accelerated in recent years. The reduction in the ice mass has contributed to global average sea-level rise of 25 millimeters.

The results are consistent with other estimates, but this is the first time scientists have used actual observations from this far back in time rather than relying on model-generated estimates. “We have observation-based estimates that is new and super important,” emphasized Kristian Kjellerup Kjeldsen, the lead author of the study at the Natural History Museum of Denmark.

Reliable records of this scope both in time and geographic area are difficult to obtain because the use of satellite imagery for climate research became popular only in the 1990s. “The effort to use the old photographs to learn how the margins of the ice sheet have changed is wonderful,” said Richard Alley, a glaciologist at Pennsylvania State University. “There have been many efforts over the years to photograph the edge of the ice sheet, for many purposes,” he added. “This new effort is the most comprehensive and consistent that I know of to pull evidence together and produces useful and important results.

The study -- the result of an international team led by climate researchers at the Natural History Museum of Denmark -- divided the studied time period into three phases, largely dictated by the availability of data: 1900 to 1983, 1983 to 2003, and 2003 to 2010.

The 1900 start date was chosen to mark the end of what is called as the Little Ice Age. There is some debate about when the “Little Ice Age” -- the last time when global average temperatures were falling -- ended, but it is well documented that glaciers started receding around that time as a result of the relative warming of the planet. Regional variations notwithstanding, 1900 was a fair guess for when all of the Greenland ice sheet was in retreat, Kjeldsen said.

More than 3,500 images were recorded during aerial surveys by the National Survey and Cadastre of Denmark in the late 1970s and early ’80s, captured with a camera that used film. These were very high-resolution images that were later digitized.

The 1983 time stamp for the start of the second phase was chosen because it was the midpoint of the period when the photographs were taken. The images from this period are not just a window into where the boundaries of glaciers were when the photographs were taken, but a measure of how far they had receded from their maximum expansion at the end of the Little Ice Age. The photographs of the landscape allowed the researchers to visually capture the extent to which the boundaries of the glaciers had receded since the 1900s.

The line that demarcates the farthest reach of a glacier from areas that have not been overrun by a glacier is called the trim line. It can be distinguished by the difference in the vegetative cover on either side of the line. When glaciers advance, they erode and transform the landscape they pass over. When they retreat, they leave behind a freshly polished, pristine landscape that is markedly different from land that has not been buried under an ice sheet.

The movement of these large masses of ice also leaves distinct marks on the walls of valleys and in the form of deposits of glacial sediment. Much of the work of analyzing the photographs in the study was left to sophisticated software that is designed for the purpose of processing images and generating estimates.

Observing techniques have vastly improved with greater reliance on remote sensing data from satellites and aircraft that capture high-resolution images over large areas. For the last phase, from 2003 to 2010, the researchers relied on laser altimetry and radar altimetry to estimate the ice elevation and map the receding ice sheet.


Their estimations show an average annual ice loss of about 75 gigatons for the first two phases—an 80-year-long period and a 20-year one.
The most recent data showed that an average of 186 gigatons of ice was lost during 2003-10, which is only a seven-year period.
Please tell us how much 33F water is required to lower the North Atlantic ocean one degree.

How crazy are you, WitheredMan?

Your OP on this thread is about a cooling of the Labrador Sea off the coast of Greenland. It is an observed and measured phenomenon. How exactly does it matter whether or not you know precisely how much ice water flowing off Greenland it took to lower the ocean temperatures around Greenland by "one degree"?

The article from Scientific American that I just cited gave this figure, BTW.....

"The most recent data showed that an average of 186 gigatons of ice was lost during 2003-10, which is only a seven-year period."

Those figures are for a period of time that ended in 2010....the melting has accelerated even more since then.

Your question is the kind of meaningless twaddle that crackpot science deniers like you throw out just to try to confuse the issue.

In the real world.....

Ice loss accelerating in Greenland's coastal glaciers
ScienceDaily
Source: Dartmouth College Science News
April 28, 2016
(excerpts)
Dartmouth College scientists have found that surface meltwater draining through and underneath Greenland's tidewater glaciers is accelerating their loss of ice mass, in a study that sheds light on the relationship between meltwater and subglacial discharge. Greenland has the potential to contribute six to seven meters of global sea level rise predominantly through ice mass lost out of large tidewater glaciers. The findings appear in the journal Annals of Glaciology.
So you really do not know the Labrador Sea is part of the earths vast ocean with currents flowing through it. It is not a lake like the Sea of Galilee. It is a very large area with large currents flowing through it.

View attachment 116013

So what, little retard?

What do you imagine that factoid has to do with the observed fact that the ocean waters around Greenland are getting colder?....or with the observed fact that the glaciers around Greenland's coastline are melting and pouring ice water into the ocean at an accelerating rate that currently amounts to several dozen gigatons (billions of tons) of water every year?
So you have no idea how much water at 33F is required to cool the Labrador Sea one degree F wo support your absurd claim.
You poor retard! My quite factual claim is supported by ALL of the scientific research that has been done on Greenland's ice cap.....as reflected in the science articles I quoted.

Your idiotic question about exactly how much ice melt water coming off Greenland it would take to raise the temperature of an indeterminate amount of water by some arbitrary amount is just meaningless nonsense that has no bearing on the already measured decrease in the temperatures of ocean waters around Greenland.

'Yet another anti-science Denier Cult myther busted.'

New details of Greenland ice loss revealed
Data are dramatically increasing knowledge of how the ocean is melting the ice sheet

ScienceDaily
Source: University of California - Irvine
February 9, 2017
Less than a year after the first research flight kicked off NASA's Oceans Melting Greenland campaign, data from the new program are providing a dramatic increase in knowledge of how Greenland's ice sheet is melting from below. Two new research papers in the journal Oceanography, including one by UCI Earth system scientist Mathieu Morlighem, use OMG observations to document how meltwater and ocean currents are interacting along Greenland's west coast and to improve seafloor maps used to predict future melting and sea level rise.

OMG is a five-year campaign to study the glaciers and ocean along Greenland's 27,000-mile coastline. Its goal is to find out where and how fast seawater is melting the glacial ice. Most of the coastline and seafloor around the ice sheet had never been surveyed, so the 2016 flights expanded scientists' knowledge of Greenland significantly. Future years of data collection will reveal the rate of change around the island.

The water circulating close around the Greenland Ice Sheet is like a cold river floating atop a warm, salty ocean. The top 600 feet (200 meters) of colder water is relatively fresh and comes from the Arctic. Below that is saltwater that comes from the south, 6 to 8 degrees Fahrenheit (3 to 4 degrees Celsius) warmer than the fresher water above. The layers don't mix much because freshwater weighs less than saltwater, so it stays afloat.

If a glacier reaches the ocean where the seafloor is shallow, the ice interacts with frigid freshwater and melts slowly. Conversely, if the seafloor in front of a glacier is deep, the ice spills into the warm subsurface layer of saltwater and may melt relatively rapidly. Satellite remote sensing can't see below the surface to discern the depth of the seafloor or study the layers of water. OMG makes these measurements with shipboard and airborne instruments.

Improving maps used to project sea level rise

In the first paper, UCI's Morlighem used the OMG surveys to improve maps of the bedrock under some of the West Coast glaciers. Glaciologists worldwide use these and other maps in modeling the rate of ice loss in Greenland and projecting future losses.

A coastal glacier's response to a warming climate depends heavily not only on the depth of the seafloor in front of it, as explained above, but on the shape of the bedrock below it. Before OMG, virtually the only measurements Morlighem had of these critical landscapes were long, narrow strips of data collected along flight lines of research aircraft, sometimes tens of miles inland (upstream) from a glacier's ocean front. He has been estimating the shape of the bedrock outside of the flight lines with the help of other data such as ice flow speeds, but formerly had no good way to check how accurate his estimates are at the coastline.

Morlighem noted, "OMG [data are] not only improving our knowledge of the ocean floor, they're improving our knowledge of the topography of the land, too." This is because the campaign's seafloor survey revealed features under the ocean, such as troughs cut by glaciers during the last ice age, which must continue upstream under the glacial ice. Therefore, Morlighem said, "By having OMG's measurements close to the ice front, I can tell whether what I thought about the bed topography is correct or not." Morlighem was pleasantly surprised to discover that 90 percent of the glacier depths he had estimated were within 160 feet (50 meters) of the actual depths recorded by the OMG survey.

Tracking meltwater far into the North

In the second paper, Ian Fenty of NASA's Jet Propulsion Laboratory, Pasadena, California, and coauthors, including Morlighem, tracked water up the West Coast to see how it changed as it interacted with hundreds of melting coastal glaciers. They found that in northwest Greenland, cold and fresh water flowing into glacial fjords from the melting surface of the ice sheet is cooling the warmer subsurface water, which circulates clockwise around the island. In one instance, evidence for meltwater-cooled waters was found in fjords 100 miles (160 kilometers) downstream from its source. Fenty noted, "This is the first time we've documented glacier meltwater significantly impacting ocean temperatures so far downstream. That shows meltwater can play an important role in determining how much ocean heat ultimately reaches Greenland's glaciers."

The OMG data have enough detail that researchers are beginning to pinpoint the ice-loss risk for individual glaciers along the coast, according to principal investigator Josh Willis of JPL. "Without OMG, we wouldn't be able to conclude that Upernavik Glacier is vulnerable to ocean warming, whereas Cornell Glacier is less vulnerable," he said.

Story Source:

Materials provided by University of California - Irvine.

Journal References:

* Mathieu Morlighem, Eric Rignot, Josh Willis. Improving Bed Topography Mapping of Greenland Glaciers Using NASA’s Oceans Melting Greenland (OMG) Data. Oceanography, 2016; 29 (4): 62 DOI: 10.5670/oceanog.2016.99
* Ian Fenty, Josh Willis, Ala Khazendar, Steven Dinardo, René Forsberg, Ichiro Fukumori, David Holland, Martin Jakobsson, Delwyn Moller, James Morison, Andreas Münchow, Eric Rignot, Michael Schodlok, Andrew Thompson, Kirsteen Tinto, Matthew Rutherford, Nicole Trenholm. Oceans Melting Greenland: Early Results from NASA’s Ocean-Ice Mission in Greenland. Oceanography, 2016; 29 (4): 72 DOI: 10.5670/oceanog.2016.100
Thermal layers are normal in all parts of the ocean, from the tropics to the poles.
An unsupported, possibly false, but in any case, in this context, totally meaningless, factoid that has nothing to do with Greenland's ice loss....and a complete non-response to the scientific information I've posted that has debunked every one of your crackpot denier cult lies.


But my question is how many gallons of water at 33F is required to change the temperature of the Labrador Sea one degree F.
A totally meaningless question that retards like you use to try to change the subject. As I have pointed out several times now.

It makes absolutely no difference to the OBSERVED melting of Greenland's ice or to the OBSERVED lowering of the ocean temperatures around Greenland.


Someone sitting at the end of a glacier and saying the water is cold here means nothing.

So, WitheredMan, you are too stupid to grasp the concept of scientific measurement.....no surprise.

Someone sitting at their computer typing out fraudulent denier cult myths and denying science means nothing.
 
Last edited:
Thermal layers are normal in all parts of the ocean, from the tropics to the poles.

That is not true. They are normal in the tropics but typically do not exist in the polar regions - the water is simply cold from top to bottom.
 
Thermal layers are normal in all parts of the ocean, from the tropics to the poles.

That is not true. They are normal in the tropics but typically do not exist in the polar regions - the water is simply cold from top to bottom.
Try again.
Thermoclines can also be observed in lakes. In colder climates, this leads to a phenomenon called stratification. During the summer, warm water, which is less dense, will sit on top of colder, denser, deeper water with a thermocline separating them. The warm layer is called the epilimnion and the cold layer is called the hypolimnion. Because the warm water is exposed to the sun during the day, a stable system exists and very little mixing of warm water and cold water occurs, particularly in calm weather.

One result of this stability is that as the summer wears on, there is less and less oxygen below the thermocline as the water below the thermocline never circulates to the surface and organisms in the water deplete the available oxygen. As winter approaches, the temperature of the surface water will drop as nighttime cooling dominates heat transfer. A point is reached where the density of the cooling surface water becomes greater than the density of the deep water and overturning begins as the dense surface water moves down under the influence of gravity. This process is aided by wind or any other process (currents for example) that agitates the water. This effect also occurs in Arctic and Antarctic waters, bringing water to the surface which, although low in oxygen, is higher in nutrients than the original surface water. This enriching of surface nutrients may produce blooms of phytoplankton, making these areas productive.
Thermocline - Wikipedia
 
Well, I guess it's head-up-the-ass 'alternative-reality' wacko-quacko time in Denierstan again.....but then, when isn't it?

I posted the facts about the accelerating Greenland ice loss being responsible for the cooling of the waters around Greenland, which make a mockery of this deranged and very ignorant thread, in post #28....which was followed by eight posts by reality denying denier cult wackos demonstrating how clueless and brainwashed they are.

In the real world....

1_5_17_Andrea_CC_Greenlandmoulin_720_479_s_c1_c_c.jpg
Meltwater pours into a hole called a moulin on the surface of the Greenland Ice Sheet. - Click image to enlarge. Credit: J. Box/ESA

Greenland Ice Loss Accelerates 110-Year-Old Record Reveals
Scientists have pieced together a history of Greenland’s ice over the last century

Scientific American
By Malavika Vyawahare
December 17, 2015
(excerpts)
Thousands of black-and-white aerial photographs of Greenland taken between 1978 and 1987 are helping scientists reconstruct a 110-year-long record of ice loss in this region.

A new study published in Nature yesterday that used the photographs found that the Greenland ice sheet lost about 9,000 gigatons of ice between 1900 and 2010 and that the rate has accelerated in recent years. The reduction in the ice mass has contributed to global average sea-level rise of 25 millimeters.

The results are consistent with other estimates, but this is the first time scientists have used actual observations from this far back in time rather than relying on model-generated estimates. “We have observation-based estimates that is new and super important,” emphasized Kristian Kjellerup Kjeldsen, the lead author of the study at the Natural History Museum of Denmark.

Reliable records of this scope both in time and geographic area are difficult to obtain because the use of satellite imagery for climate research became popular only in the 1990s. “The effort to use the old photographs to learn how the margins of the ice sheet have changed is wonderful,” said Richard Alley, a glaciologist at Pennsylvania State University. “There have been many efforts over the years to photograph the edge of the ice sheet, for many purposes,” he added. “This new effort is the most comprehensive and consistent that I know of to pull evidence together and produces useful and important results.

The study -- the result of an international team led by climate researchers at the Natural History Museum of Denmark -- divided the studied time period into three phases, largely dictated by the availability of data: 1900 to 1983, 1983 to 2003, and 2003 to 2010.

The 1900 start date was chosen to mark the end of what is called as the Little Ice Age. There is some debate about when the “Little Ice Age” -- the last time when global average temperatures were falling -- ended, but it is well documented that glaciers started receding around that time as a result of the relative warming of the planet. Regional variations notwithstanding, 1900 was a fair guess for when all of the Greenland ice sheet was in retreat, Kjeldsen said.

More than 3,500 images were recorded during aerial surveys by the National Survey and Cadastre of Denmark in the late 1970s and early ’80s, captured with a camera that used film. These were very high-resolution images that were later digitized.

The 1983 time stamp for the start of the second phase was chosen because it was the midpoint of the period when the photographs were taken. The images from this period are not just a window into where the boundaries of glaciers were when the photographs were taken, but a measure of how far they had receded from their maximum expansion at the end of the Little Ice Age. The photographs of the landscape allowed the researchers to visually capture the extent to which the boundaries of the glaciers had receded since the 1900s.

The line that demarcates the farthest reach of a glacier from areas that have not been overrun by a glacier is called the trim line. It can be distinguished by the difference in the vegetative cover on either side of the line. When glaciers advance, they erode and transform the landscape they pass over. When they retreat, they leave behind a freshly polished, pristine landscape that is markedly different from land that has not been buried under an ice sheet.

The movement of these large masses of ice also leaves distinct marks on the walls of valleys and in the form of deposits of glacial sediment. Much of the work of analyzing the photographs in the study was left to sophisticated software that is designed for the purpose of processing images and generating estimates.

Observing techniques have vastly improved with greater reliance on remote sensing data from satellites and aircraft that capture high-resolution images over large areas. For the last phase, from 2003 to 2010, the researchers relied on laser altimetry and radar altimetry to estimate the ice elevation and map the receding ice sheet.


Their estimations show an average annual ice loss of about 75 gigatons for the first two phases—an 80-year-long period and a 20-year one.
The most recent data showed that an average of 186 gigatons of ice was lost during 2003-10, which is only a seven-year period.
Please tell us how much 33F water is required to lower the North Atlantic ocean one degree.

How crazy are you, WitheredMan?

Your OP on this thread is about a cooling of the Labrador Sea off the coast of Greenland. It is an observed and measured phenomenon. How exactly does it matter whether or not you know precisely how much ice water flowing off Greenland it took to lower the ocean temperatures around Greenland by "one degree"?

The article from Scientific American that I just cited gave this figure, BTW.....

"The most recent data showed that an average of 186 gigatons of ice was lost during 2003-10, which is only a seven-year period."

Those figures are for a period of time that ended in 2010....the melting has accelerated even more since then.

Your question is the kind of meaningless twaddle that crackpot science deniers like you throw out just to try to confuse the issue.

In the real world.....

Ice loss accelerating in Greenland's coastal glaciers
ScienceDaily
Source: Dartmouth College Science News
April 28, 2016
(excerpts)
Dartmouth College scientists have found that surface meltwater draining through and underneath Greenland's tidewater glaciers is accelerating their loss of ice mass, in a study that sheds light on the relationship between meltwater and subglacial discharge. Greenland has the potential to contribute six to seven meters of global sea level rise predominantly through ice mass lost out of large tidewater glaciers. The findings appear in the journal Annals of Glaciology.
So you really do not know the Labrador Sea is part of the earths vast ocean with currents flowing through it. It is not a lake like the Sea of Galilee. It is a very large area with large currents flowing through it.

View attachment 116013

So what, little retard?

What do you imagine that factoid has to do with the observed fact that the ocean waters around Greenland are getting colder?....or with the observed fact that the glaciers around Greenland's coastline are melting and pouring ice water into the ocean at an accelerating rate that currently amounts to several dozen gigatons (billions of tons) of water every year?
So you have no idea how much water at 33F is required to cool the Labrador Sea one degree F wo support your absurd claim.
You poor retard! My quite factual claim is supported by ALL of the scientific research that has been done on Greenland's ice cap.....as reflected in the science articles I quoted.

Your idiotic question about exactly how much ice melt water coming off Greenland it would take to raise the temperature of an indeterminate amount of water by some arbitrary amount is just meaningless nonsense that has no bearing on the already measured decrease in the temperatures of ocean waters around Greenland.

'Yet another anti-science Denier Cult myther busted.'

New details of Greenland ice loss revealed
Data are dramatically increasing knowledge of how the ocean is melting the ice sheet

ScienceDaily
Source: University of California - Irvine
February 9, 2017
Less than a year after the first research flight kicked off NASA's Oceans Melting Greenland campaign, data from the new program are providing a dramatic increase in knowledge of how Greenland's ice sheet is melting from below. Two new research papers in the journal Oceanography, including one by UCI Earth system scientist Mathieu Morlighem, use OMG observations to document how meltwater and ocean currents are interacting along Greenland's west coast and to improve seafloor maps used to predict future melting and sea level rise.

OMG is a five-year campaign to study the glaciers and ocean along Greenland's 27,000-mile coastline. Its goal is to find out where and how fast seawater is melting the glacial ice. Most of the coastline and seafloor around the ice sheet had never been surveyed, so the 2016 flights expanded scientists' knowledge of Greenland significantly. Future years of data collection will reveal the rate of change around the island.

The water circulating close around the Greenland Ice Sheet is like a cold river floating atop a warm, salty ocean. The top 600 feet (200 meters) of colder water is relatively fresh and comes from the Arctic. Below that is saltwater that comes from the south, 6 to 8 degrees Fahrenheit (3 to 4 degrees Celsius) warmer than the fresher water above. The layers don't mix much because freshwater weighs less than saltwater, so it stays afloat.

If a glacier reaches the ocean where the seafloor is shallow, the ice interacts with frigid freshwater and melts slowly. Conversely, if the seafloor in front of a glacier is deep, the ice spills into the warm subsurface layer of saltwater and may melt relatively rapidly. Satellite remote sensing can't see below the surface to discern the depth of the seafloor or study the layers of water. OMG makes these measurements with shipboard and airborne instruments.

Improving maps used to project sea level rise

In the first paper, UCI's Morlighem used the OMG surveys to improve maps of the bedrock under some of the West Coast glaciers. Glaciologists worldwide use these and other maps in modeling the rate of ice loss in Greenland and projecting future losses.

A coastal glacier's response to a warming climate depends heavily not only on the depth of the seafloor in front of it, as explained above, but on the shape of the bedrock below it. Before OMG, virtually the only measurements Morlighem had of these critical landscapes were long, narrow strips of data collected along flight lines of research aircraft, sometimes tens of miles inland (upstream) from a glacier's ocean front. He has been estimating the shape of the bedrock outside of the flight lines with the help of other data such as ice flow speeds, but formerly had no good way to check how accurate his estimates are at the coastline.

Morlighem noted, "OMG [data are] not only improving our knowledge of the ocean floor, they're improving our knowledge of the topography of the land, too." This is because the campaign's seafloor survey revealed features under the ocean, such as troughs cut by glaciers during the last ice age, which must continue upstream under the glacial ice. Therefore, Morlighem said, "By having OMG's measurements close to the ice front, I can tell whether what I thought about the bed topography is correct or not." Morlighem was pleasantly surprised to discover that 90 percent of the glacier depths he had estimated were within 160 feet (50 meters) of the actual depths recorded by the OMG survey.

Tracking meltwater far into the North

In the second paper, Ian Fenty of NASA's Jet Propulsion Laboratory, Pasadena, California, and coauthors, including Morlighem, tracked water up the West Coast to see how it changed as it interacted with hundreds of melting coastal glaciers. They found that in northwest Greenland, cold and fresh water flowing into glacial fjords from the melting surface of the ice sheet is cooling the warmer subsurface water, which circulates clockwise around the island. In one instance, evidence for meltwater-cooled waters was found in fjords 100 miles (160 kilometers) downstream from its source. Fenty noted, "This is the first time we've documented glacier meltwater significantly impacting ocean temperatures so far downstream. That shows meltwater can play an important role in determining how much ocean heat ultimately reaches Greenland's glaciers."

The OMG data have enough detail that researchers are beginning to pinpoint the ice-loss risk for individual glaciers along the coast, according to principal investigator Josh Willis of JPL. "Without OMG, we wouldn't be able to conclude that Upernavik Glacier is vulnerable to ocean warming, whereas Cornell Glacier is less vulnerable," he said.

Story Source:

Materials provided by University of California - Irvine.

Journal References:

* Mathieu Morlighem, Eric Rignot, Josh Willis. Improving Bed Topography Mapping of Greenland Glaciers Using NASA’s Oceans Melting Greenland (OMG) Data. Oceanography, 2016; 29 (4): 62 DOI: 10.5670/oceanog.2016.99
* Ian Fenty, Josh Willis, Ala Khazendar, Steven Dinardo, René Forsberg, Ichiro Fukumori, David Holland, Martin Jakobsson, Delwyn Moller, James Morison, Andreas Münchow, Eric Rignot, Michael Schodlok, Andrew Thompson, Kirsteen Tinto, Matthew Rutherford, Nicole Trenholm. Oceans Melting Greenland: Early Results from NASA’s Ocean-Ice Mission in Greenland. Oceanography, 2016; 29 (4): 72 DOI: 10.5670/oceanog.2016.100
Thermal layers are normal in all parts of the ocean, from the tropics to the poles.
An unsupported, possibly false, but in any case, in this context, totally meaningless, factoid that has nothing to do with Greenland's ice loss....and a complete non-response to the scientific information I've posted that has debunked every one of your crackpot denier cult lies.


But my question is how many gallons of water at 33F is required to change the temperature of the Labrador Sea one degree F.
A totally meaningless question that retards like you use to try to change the subject. As I have pointed out several times now.

It makes absolutely no difference to the OBSERVED melting of Greenland's ice or to the OBSERVED lowering of the ocean temperatures around Greenland.


Someone sitting at the end of a glacier and saying the water is cold here means nothing.

So, WitheredMan, you are too stupid to grasp the concept of scientific measurement.....no surprise.

Someone sitting at their computer typing out fraudulent denier cult myths and denying science means nothing.
From someone claiming melting ice has the North Atlantic colder than normal, that is a compliment.
 

Forum List

Back
Top