Scientists Warn Drastic Cooling in North Atlantic Beyond Worst Fears

Just as the warming Arctic has led to cold storms on the East Coast, there has been a slowdown of the MOC, and that could lead to colder Atlantic coast temperatures even as the rest of the continent rapidly warmed. Interesting to speculate what the results of that colder coast and warmer interior would be for tornado alley.

Barrow, -17F
Alert -33F
Kotelny -2F
and completing the 4 cardinal point tour around the Arctic:
Golomjannyj Is -11F

Arctic Weather Map

Arctic Sea Ice News and Analysis | Sea ice data updated daily with one-day lag

March 6, 2017
Another warm month in the Arctic

High air temperatures observed over the Barents and Kara Seas for much of this past winter moderated in February. Overall, the Arctic remained warmer than average and sea ice extent remained at record low levels.

Arctic sea ice extent for February 2017 averaged 14.28 million square kilometers (5.51 million square miles), the lowest February extent in the 38-year satellite record. This is 40,000 square kilometers (15,400 square miles) below February 2016, the previous lowest extent for the month, and 1.18 million square kilometers (455,600 square miles) below the February 1981 to 2010 long term average.
..............................................................................................................................
Air temperatures at the 925 hPa level (approximately 2,500 feet above sea level) remained 2 to 5 degrees Celsius (4 to 9 degrees Fahrenheit) above average over the Arctic Ocean. The high air temperatures observed over the Barents and Kara Seas for much of this past winter moderated in February. February air temperatures over the Barents Sea ranged between 4 to 5 degrees Celsius (8 to 9 degrees Fahrenheit) above average, compared to 7 degrees Celsius (13 degrees Fahrenheit) above average in January. Recall that these January temperature extremes were associated with a series of strong cyclones entering the Arctic Ocean from the North Atlantic, drawing in warm air. Sea level pressure in February was nevertheless lower than average over much of the Arctic Ocean. Sea level pressure was higher than average over the Bering Sea and just north of Scandinavia.

Antarctic minimum extent

Antarctic sea ice is nearing its annual minimum extent and continues to track at record low levels for this time of year. On February 13, Antarctic sea ice extent dropped to 2.29 million square kilometers (884,000 square miles), setting a record lowest extent in the satellite era. The previous lowest extent occurred on February 27, 1997. By the end of February, extent had dropped even further to 2.13 million square kilometers (822,400 square miles). The record lows are not surprising, given Antarctic sea ice extent’s high variability. Just a few years back, extent in the region set record highs (Figure 4b).
 
Bobby Fischer had an IQ of 187, but he couldn't safely walk across the street on his own.
There is also the separation of intelligence and wisdom. Not too often you will see someone with high ratings in both categories.

But we often see people with low ratings in both categories. We call them "deniers". Look at all of you proud flaming retards here, screaming hysterically that a local cool spot is impossible. You're idiots, and you want the whole planet to know it.

90% of the deniers here are simply very stupid human beings. The other 10% are that high IQ / Low Wisdom crowd.
Good parrot. Want a cracker?
Only one reason you people think science is throwing people in prison for questioning dogma and propaganda lies.
Now what the fuck are you squawking about now? Just when has anyone been thrown into prison in this nation for questioning science? That was the policy of Lysenkoism in the Soviet Union, and the policy you 'Conservatives' want into place when science points out that your politically inspired 'science' is shit.
 
Just as the warming Arctic has led to cold storms on the East Coast, there has been a slowdown of the MOC, and that could lead to colder Atlantic coast temperatures even as the rest of the continent rapidly warmed. Interesting to speculate what the results of that colder coast and warmer interior would be for tornado alley.

Barrow, -17F
Alert -33F
Kotelny -2F
and completing the 4 cardinal point tour around the Arctic:
Golomjannyj Is -11F

Arctic Weather Map

Arctic Sea Ice News and Analysis | Sea ice data updated daily with one-day lag

March 6, 2017
Another warm month in the Arctic

High air temperatures observed over the Barents and Kara Seas for much of this past winter moderated in February. Overall, the Arctic remained warmer than average and sea ice extent remained at record low levels.

Arctic sea ice extent for February 2017 averaged 14.28 million square kilometers (5.51 million square miles), the lowest February extent in the 38-year satellite record. This is 40,000 square kilometers (15,400 square miles) below February 2016, the previous lowest extent for the month, and 1.18 million square kilometers (455,600 square miles) below the February 1981 to 2010 long term average.
..............................................................................................................................
Air temperatures at the 925 hPa level (approximately 2,500 feet above sea level) remained 2 to 5 degrees Celsius (4 to 9 degrees Fahrenheit) above average over the Arctic Ocean. The high air temperatures observed over the Barents and Kara Seas for much of this past winter moderated in February. February air temperatures over the Barents Sea ranged between 4 to 5 degrees Celsius (8 to 9 degrees Fahrenheit) above average, compared to 7 degrees Celsius (13 degrees Fahrenheit) above average in January. Recall that these January temperature extremes were associated with a series of strong cyclones entering the Arctic Ocean from the North Atlantic, drawing in warm air. Sea level pressure in February was nevertheless lower than average over much of the Arctic Ocean. Sea level pressure was higher than average over the Bering Sea and just north of Scandinavia.

Antarctic minimum extent

Antarctic sea ice is nearing its annual minimum extent and continues to track at record low levels for this time of year. On February 13, Antarctic sea ice extent dropped to 2.29 million square kilometers (884,000 square miles), setting a record lowest extent in the satellite era. The previous lowest extent occurred on February 27, 1997. By the end of February, extent had dropped even further to 2.13 million square kilometers (822,400 square miles). The record lows are not surprising, given Antarctic sea ice extent’s high variability. Just a few years back, extent in the region set record highs (Figure 4b).
Great news. The continued end to the ice age is great news for all life on earth.
 
Bobby Fischer had an IQ of 187, but he couldn't safely walk across the street on his own.
There is also the separation of intelligence and wisdom. Not too often you will see someone with high ratings in both categories.

But we often see people with low ratings in both categories. We call them "deniers". Look at all of you proud flaming retards here, screaming hysterically that a local cool spot is impossible. You're idiots, and you want the whole planet to know it.

90% of the deniers here are simply very stupid human beings. The other 10% are that high IQ / Low Wisdom crowd.
Good parrot. Want a cracker?
Only one reason you people think science is throwing people in prison for questioning dogma and propaganda lies.
Now what the fuck are you squawking about now? Just when has anyone been thrown into prison in this nation for questioning science? That was the policy of Lysenkoism in the Soviet Union, and the policy you 'Conservatives' want into place when science points out that your politically inspired 'science' is shit.
Dufus denies the call by the warming mythers to throw people into prison for questioning them.

It is the only way your "science" works. Eliminate science from your agenda.
 
Bobby Fischer had an IQ of 187, but he couldn't safely walk across the street on his own.
There is also the separation of intelligence and wisdom. Not too often you will see someone with high ratings in both categories.

But we often see people with low ratings in both categories. We call them "deniers". Look at all of you proud flaming retards here, screaming hysterically that a local cool spot is impossible. You're idiots, and you want the whole planet to know it.

90% of the deniers here are simply very stupid human beings. The other 10% are that high IQ / Low Wisdom crowd.

Remember: Warming is global warming; cooling is Climate Change
 
Just as the warming Arctic has led to cold storms on the East Coast, there has been a slowdown of the MOC, and that could lead to colder Atlantic coast temperatures even as the rest of the continent rapidly warmed. Interesting to speculate what the results of that colder coast and warmer interior would be for tornado alley.

Barrow, -17F
Alert -33F
Kotelny -2F
and completing the 4 cardinal point tour around the Arctic:
Golomjannyj Is -11F

Arctic Weather Map

Arctic Sea Ice News and Analysis | Sea ice data updated daily with one-day lag

March 6, 2017
Another warm month in the Arctic

High air temperatures observed over the Barents and Kara Seas for much of this past winter moderated in February. Overall, the Arctic remained warmer than average and sea ice extent remained at record low levels.

Arctic sea ice extent for February 2017 averaged 14.28 million square kilometers (5.51 million square miles), the lowest February extent in the 38-year satellite record. This is 40,000 square kilometers (15,400 square miles) below February 2016, the previous lowest extent for the month, and 1.18 million square kilometers (455,600 square miles) below the February 1981 to 2010 long term average.
..............................................................................................................................
Air temperatures at the 925 hPa level (approximately 2,500 feet above sea level) remained 2 to 5 degrees Celsius (4 to 9 degrees Fahrenheit) above average over the Arctic Ocean. The high air temperatures observed over the Barents and Kara Seas for much of this past winter moderated in February. February air temperatures over the Barents Sea ranged between 4 to 5 degrees Celsius (8 to 9 degrees Fahrenheit) above average, compared to 7 degrees Celsius (13 degrees Fahrenheit) above average in January. Recall that these January temperature extremes were associated with a series of strong cyclones entering the Arctic Ocean from the North Atlantic, drawing in warm air. Sea level pressure in February was nevertheless lower than average over much of the Arctic Ocean. Sea level pressure was higher than average over the Bering Sea and just north of Scandinavia.

Antarctic minimum extent

Antarctic sea ice is nearing its annual minimum extent and continues to track at record low levels for this time of year. On February 13, Antarctic sea ice extent dropped to 2.29 million square kilometers (884,000 square miles), setting a record lowest extent in the satellite era. The previous lowest extent occurred on February 27, 1997. By the end of February, extent had dropped even further to 2.13 million square kilometers (822,400 square miles). The record lows are not surprising, given Antarctic sea ice extent’s high variability. Just a few years back, extent in the region set record highs (Figure 4b).


I'm posting real time temperatures, all below 0F and you talk about "high air temperature" Do you have to be high to imagine -11F is evidence of "Global Climate Warming Change"?

Antarctic? Really?
 
Just as the warming Arctic has led to cold storms on the East Coast, there has been a slowdown of the MOC, and that could lead to colder Atlantic coast temperatures even as the rest of the continent rapidly warmed. Interesting to speculate what the results of that colder coast and warmer interior would be for tornado alley.

Barrow, -17F
Alert -33F
Kotelny -2F
and completing the 4 cardinal point tour around the Arctic:
Golomjannyj Is -11F

Arctic Weather Map

Arctic Sea Ice News and Analysis | Sea ice data updated daily with one-day lag

March 6, 2017
Another warm month in the Arctic

High air temperatures observed over the Barents and Kara Seas for much of this past winter moderated in February. Overall, the Arctic remained warmer than average and sea ice extent remained at record low levels.

Arctic sea ice extent for February 2017 averaged 14.28 million square kilometers (5.51 million square miles), the lowest February extent in the 38-year satellite record. This is 40,000 square kilometers (15,400 square miles) below February 2016, the previous lowest extent for the month, and 1.18 million square kilometers (455,600 square miles) below the February 1981 to 2010 long term average.
..............................................................................................................................
Air temperatures at the 925 hPa level (approximately 2,500 feet above sea level) remained 2 to 5 degrees Celsius (4 to 9 degrees Fahrenheit) above average over the Arctic Ocean. The high air temperatures observed over the Barents and Kara Seas for much of this past winter moderated in February. February air temperatures over the Barents Sea ranged between 4 to 5 degrees Celsius (8 to 9 degrees Fahrenheit) above average, compared to 7 degrees Celsius (13 degrees Fahrenheit) above average in January. Recall that these January temperature extremes were associated with a series of strong cyclones entering the Arctic Ocean from the North Atlantic, drawing in warm air. Sea level pressure in February was nevertheless lower than average over much of the Arctic Ocean. Sea level pressure was higher than average over the Bering Sea and just north of Scandinavia.

Antarctic minimum extent

Antarctic sea ice is nearing its annual minimum extent and continues to track at record low levels for this time of year. On February 13, Antarctic sea ice extent dropped to 2.29 million square kilometers (884,000 square miles), setting a record lowest extent in the satellite era. The previous lowest extent occurred on February 27, 1997. By the end of February, extent had dropped even further to 2.13 million square kilometers (822,400 square miles). The record lows are not surprising, given Antarctic sea ice extent’s high variability. Just a few years back, extent in the region set record highs (Figure 4b).


I'm posting real time temperatures, all below 0F and you talk about "high air temperature" Do you have to be high to imagine -11F is evidence of "Global Climate Warming Change"?

Antarctic? Really?
Warm is a relative term when it's a -50F wind-chill outside
 
WAIT...WHAT???

In 2013, drawing on 40 climate change projections, the IPCC judged that this slowdown would occur gradually, over a long period. Its findings suggested that fast cooling of the North Atlantic during this century was unlikely.

But oceanographers from EU emBRACE had also re-examined the 40 projections by focusing on a critical spot in the northwest of the North Atlantic: the Labrador Sea.

The Labrador Sea is host to a convection system ultimately feeding into the ocean-wide MOC. The temperatures of its surface waters plummet in the winter, increasing their density and causing them to sink. This displaces deep waters, which bring their heat with them as they rise to the surface, preventing the formation of ice caps.

The algorithm developed by the Anglo-French researchers was able to detect quick sea surface temperature variations. With it they found that seven of the 40 climate models they were studying predicted a total shutdown of convection, leading to abrupt cooling of the Labrador Sea by 2C to 3C over less than 10 years. This in turn would drastically lower North Atlantic coastal temperatures.

Drastic cooling in North Atlantic beyond worst fears, scientists warn

You flaming moron....the ocean waters around Greenland are getting colder because so much ice water is pouring off Greenland as a result of global warming.

Now what is your deranged supposed point, little retard?


lmao......whatever you say s0n..............:coffee::eusa_dance::eusa_dance::eusa_dance:

Ive seen some whackadoodle posts in here in recent years but this is the best one.......perhaps the nuttiest ever? Definetly up for an award.........though I must admit, some of MATTHEWS shit is really beyond gone.
 
WAIT...WHAT???

In 2013, drawing on 40 climate change projections, the IPCC judged that this slowdown would occur gradually, over a long period. Its findings suggested that fast cooling of the North Atlantic during this century was unlikely.

But oceanographers from EU emBRACE had also re-examined the 40 projections by focusing on a critical spot in the northwest of the North Atlantic: the Labrador Sea.

The Labrador Sea is host to a convection system ultimately feeding into the ocean-wide MOC. The temperatures of its surface waters plummet in the winter, increasing their density and causing them to sink. This displaces deep waters, which bring their heat with them as they rise to the surface, preventing the formation of ice caps.

The algorithm developed by the Anglo-French researchers was able to detect quick sea surface temperature variations. With it they found that seven of the 40 climate models they were studying predicted a total shutdown of convection, leading to abrupt cooling of the Labrador Sea by 2C to 3C over less than 10 years. This in turn would drastically lower North Atlantic coastal temperatures.

Drastic cooling in North Atlantic beyond worst fears, scientists warn

You flaming moron....the ocean waters around Greenland are getting colder because so much ice water is pouring off Greenland as a result of global warming.

Now what is your deranged supposed point, little retard?

Exhibit A: Why no one should even think of taking the Warmers seriously.

"...the ocean waters around Greenland are getting colder because so much ice water is pouring off Greenland as a result of global warming."
So if the planet gets colder, the oceans will get warmer because ice water will no longer be flowing into the ocean.

That's why you don't pee when in the ocean, it causes the ocean water to warm.
 
WAIT...WHAT???

In 2013, drawing on 40 climate change projections, the IPCC judged that this slowdown would occur gradually, over a long period. Its findings suggested that fast cooling of the North Atlantic during this century was unlikely.

But oceanographers from EU emBRACE had also re-examined the 40 projections by focusing on a critical spot in the northwest of the North Atlantic: the Labrador Sea.

The Labrador Sea is host to a convection system ultimately feeding into the ocean-wide MOC. The temperatures of its surface waters plummet in the winter, increasing their density and causing them to sink. This displaces deep waters, which bring their heat with them as they rise to the surface, preventing the formation of ice caps.

The algorithm developed by the Anglo-French researchers was able to detect quick sea surface temperature variations. With it they found that seven of the 40 climate models they were studying predicted a total shutdown of convection, leading to abrupt cooling of the Labrador Sea by 2C to 3C over less than 10 years. This in turn would drastically lower North Atlantic coastal temperatures.

Drastic cooling in North Atlantic beyond worst fears, scientists warn

You flaming moron....the ocean waters around Greenland are getting colder because so much ice water is pouring off Greenland as a result of global warming.

Now what is your deranged supposed point, little retard?

Exhibit A: Why no one should even think of taking the Warmers seriously.

"...the ocean waters around Greenland are getting colder because so much ice water is pouring off Greenland as a result of global warming."

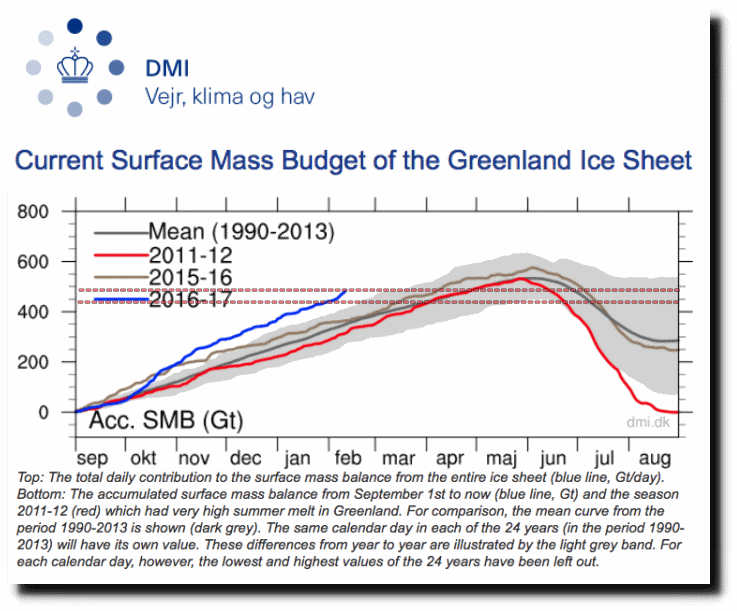
Yeah...this chart shows how much ice water is flooding off Greenland...the ice gain on Greenland is breaking all records...gaining ice at a rate of about 5 billion tons per day.

Screen-Shot-2017-02-11-at-11.02.43-PM-down.gif

Um, because global warming...nothing else fits the facts

Yep...no matter what happens, it is due to CO2 and the global warming....interesting stuff that CO2...adding it to the atmosphere increases the emissivity of the atmosphere. Every other substance known to science that causes an increase in the emissivity of a system, results in the temperature of that system decreasing....except for magical CO2...it increases the emissivity of the system and causes warming at the same time...absolutely amazing stuff....seems that we should be able to pump our attics full of it and realize lower heating bills...or at least, there should be some major projects under way to harness the power of CO2...imagine putting X amount of energy in and getting twice that much power out...
That's why they consider CO2 to be a pollutant. It is magically bad in all circumstances.
 
WAIT...WHAT???

In 2013, drawing on 40 climate change projections, the IPCC judged that this slowdown would occur gradually, over a long period. Its findings suggested that fast cooling of the North Atlantic during this century was unlikely.

But oceanographers from EU emBRACE had also re-examined the 40 projections by focusing on a critical spot in the northwest of the North Atlantic: the Labrador Sea.

The Labrador Sea is host to a convection system ultimately feeding into the ocean-wide MOC. The temperatures of its surface waters plummet in the winter, increasing their density and causing them to sink. This displaces deep waters, which bring their heat with them as they rise to the surface, preventing the formation of ice caps.

The algorithm developed by the Anglo-French researchers was able to detect quick sea surface temperature variations. With it they found that seven of the 40 climate models they were studying predicted a total shutdown of convection, leading to abrupt cooling of the Labrador Sea by 2C to 3C over less than 10 years. This in turn would drastically lower North Atlantic coastal temperatures.

Drastic cooling in North Atlantic beyond worst fears, scientists warn

You flaming moron....the ocean waters around Greenland are getting colder because so much ice water is pouring off Greenland as a result of global warming.

Now what is your deranged supposed point, little retard?

Exhibit A: Why no one should even think of taking the Warmers seriously.

"...the ocean waters around Greenland are getting colder because so much ice water is pouring off Greenland as a result of global warming."

Yeah...this chart shows how much ice water is flooding off Greenland...the ice gain on Greenland is breaking all records...gaining ice at a rate of about 5 billion tons per day.

Screen-Shot-2017-02-11-at-11.02.43-PM-down.gif
The caption on your image states "the lowest and highest values of the 24 years have been left out", which makes your statement "the ice gain on Greenland is breaking all records" false.
 
Well, I guess it's head-up-the-ass 'alternative-reality' wacko-quacko time in Denierstan again.....but then, when isn't it?

I posted the facts about the accelerating Greenland ice loss being responsible for the cooling of the waters around Greenland, which make a mockery of this deranged and very ignorant thread, in post #28....which was followed by eight posts by reality denying denier cult wackos demonstrating how clueless and brainwashed they are.

In the real world....

1_5_17_Andrea_CC_Greenlandmoulin_720_479_s_c1_c_c.jpg
Meltwater pours into a hole called a moulin on the surface of the Greenland Ice Sheet. - Click image to enlarge. Credit: J. Box/ESA

Greenland Ice Loss Accelerates 110-Year-Old Record Reveals
Scientists have pieced together a history of Greenland’s ice over the last century

Scientific American
By Malavika Vyawahare
December 17, 2015
(excerpts)
Thousands of black-and-white aerial photographs of Greenland taken between 1978 and 1987 are helping scientists reconstruct a 110-year-long record of ice loss in this region.

A new study published in Nature yesterday that used the photographs found that the Greenland ice sheet lost about 9,000 gigatons of ice between 1900 and 2010 and that the rate has accelerated in recent years. The reduction in the ice mass has contributed to global average sea-level rise of 25 millimeters.

The results are consistent with other estimates, but this is the first time scientists have used actual observations from this far back in time rather than relying on model-generated estimates. “We have observation-based estimates that is new and super important,” emphasized Kristian Kjellerup Kjeldsen, the lead author of the study at the Natural History Museum of Denmark.

Reliable records of this scope both in time and geographic area are difficult to obtain because the use of satellite imagery for climate research became popular only in the 1990s. “The effort to use the old photographs to learn how the margins of the ice sheet have changed is wonderful,” said Richard Alley, a glaciologist at Pennsylvania State University. “There have been many efforts over the years to photograph the edge of the ice sheet, for many purposes,” he added. “This new effort is the most comprehensive and consistent that I know of to pull evidence together and produces useful and important results.

The study -- the result of an international team led by climate researchers at the Natural History Museum of Denmark -- divided the studied time period into three phases, largely dictated by the availability of data: 1900 to 1983, 1983 to 2003, and 2003 to 2010.

The 1900 start date was chosen to mark the end of what is called as the Little Ice Age. There is some debate about when the “Little Ice Age” -- the last time when global average temperatures were falling -- ended, but it is well documented that glaciers started receding around that time as a result of the relative warming of the planet. Regional variations notwithstanding, 1900 was a fair guess for when all of the Greenland ice sheet was in retreat, Kjeldsen said.

More than 3,500 images were recorded during aerial surveys by the National Survey and Cadastre of Denmark in the late 1970s and early ’80s, captured with a camera that used film. These were very high-resolution images that were later digitized.

The 1983 time stamp for the start of the second phase was chosen because it was the midpoint of the period when the photographs were taken. The images from this period are not just a window into where the boundaries of glaciers were when the photographs were taken, but a measure of how far they had receded from their maximum expansion at the end of the Little Ice Age. The photographs of the landscape allowed the researchers to visually capture the extent to which the boundaries of the glaciers had receded since the 1900s.

The line that demarcates the farthest reach of a glacier from areas that have not been overrun by a glacier is called the trim line. It can be distinguished by the difference in the vegetative cover on either side of the line. When glaciers advance, they erode and transform the landscape they pass over. When they retreat, they leave behind a freshly polished, pristine landscape that is markedly different from land that has not been buried under an ice sheet.

The movement of these large masses of ice also leaves distinct marks on the walls of valleys and in the form of deposits of glacial sediment. Much of the work of analyzing the photographs in the study was left to sophisticated software that is designed for the purpose of processing images and generating estimates.

Observing techniques have vastly improved with greater reliance on remote sensing data from satellites and aircraft that capture high-resolution images over large areas. For the last phase, from 2003 to 2010, the researchers relied on laser altimetry and radar altimetry to estimate the ice elevation and map the receding ice sheet.


Their estimations show an average annual ice loss of about 75 gigatons for the first two phases—an 80-year-long period and a 20-year one.
The most recent data showed that an average of 186 gigatons of ice was lost during 2003-10, which is only a seven-year period.
 
Bobby Fischer had an IQ of 187, but he couldn't safely walk across the street on his own.
There is also the separation of intelligence and wisdom. Not too often you will see someone with high ratings in both categories.

But we often see people with low ratings in both categories. We call them "deniers". Look at all of you proud flaming retards here, screaming hysterically that a local cool spot is impossible. You're idiots, and you want the whole planet to know it.

90% of the deniers here are simply very stupid human beings. The other 10% are that high IQ / Low Wisdom crowd.

Translation?

"The data is showing Im losing so I have to call the OP a retard.":deal:
 
Well, I guess it's head-up-the-ass 'alternative-reality' wacko-quacko time in Denierstan again.....but then, when isn't it?

I posted the facts about the accelerating Greenland ice loss being responsible for the cooling of the waters around Greenland, which make a mockery of this deranged and very ignorant thread, in post #28....which was followed by eight posts by reality denying denier cult wackos demonstrating how clueless and brainwashed they are.

In the real world....

1_5_17_Andrea_CC_Greenlandmoulin_720_479_s_c1_c_c.jpg
Meltwater pours into a hole called a moulin on the surface of the Greenland Ice Sheet. - Click image to enlarge. Credit: J. Box/ESA

Greenland Ice Loss Accelerates 110-Year-Old Record Reveals
Scientists have pieced together a history of Greenland’s ice over the last century

Scientific American
By Malavika Vyawahare
December 17, 2015
(excerpts)
Thousands of black-and-white aerial photographs of Greenland taken between 1978 and 1987 are helping scientists reconstruct a 110-year-long record of ice loss in this region.

A new study published in Nature yesterday that used the photographs found that the Greenland ice sheet lost about 9,000 gigatons of ice between 1900 and 2010 and that the rate has accelerated in recent years. The reduction in the ice mass has contributed to global average sea-level rise of 25 millimeters.

The results are consistent with other estimates, but this is the first time scientists have used actual observations from this far back in time rather than relying on model-generated estimates. “We have observation-based estimates that is new and super important,” emphasized Kristian Kjellerup Kjeldsen, the lead author of the study at the Natural History Museum of Denmark.

Reliable records of this scope both in time and geographic area are difficult to obtain because the use of satellite imagery for climate research became popular only in the 1990s. “The effort to use the old photographs to learn how the margins of the ice sheet have changed is wonderful,” said Richard Alley, a glaciologist at Pennsylvania State University. “There have been many efforts over the years to photograph the edge of the ice sheet, for many purposes,” he added. “This new effort is the most comprehensive and consistent that I know of to pull evidence together and produces useful and important results.

The study -- the result of an international team led by climate researchers at the Natural History Museum of Denmark -- divided the studied time period into three phases, largely dictated by the availability of data: 1900 to 1983, 1983 to 2003, and 2003 to 2010.

The 1900 start date was chosen to mark the end of what is called as the Little Ice Age. There is some debate about when the “Little Ice Age” -- the last time when global average temperatures were falling -- ended, but it is well documented that glaciers started receding around that time as a result of the relative warming of the planet. Regional variations notwithstanding, 1900 was a fair guess for when all of the Greenland ice sheet was in retreat, Kjeldsen said.

More than 3,500 images were recorded during aerial surveys by the National Survey and Cadastre of Denmark in the late 1970s and early ’80s, captured with a camera that used film. These were very high-resolution images that were later digitized.

The 1983 time stamp for the start of the second phase was chosen because it was the midpoint of the period when the photographs were taken. The images from this period are not just a window into where the boundaries of glaciers were when the photographs were taken, but a measure of how far they had receded from their maximum expansion at the end of the Little Ice Age. The photographs of the landscape allowed the researchers to visually capture the extent to which the boundaries of the glaciers had receded since the 1900s.

The line that demarcates the farthest reach of a glacier from areas that have not been overrun by a glacier is called the trim line. It can be distinguished by the difference in the vegetative cover on either side of the line. When glaciers advance, they erode and transform the landscape they pass over. When they retreat, they leave behind a freshly polished, pristine landscape that is markedly different from land that has not been buried under an ice sheet.

The movement of these large masses of ice also leaves distinct marks on the walls of valleys and in the form of deposits of glacial sediment. Much of the work of analyzing the photographs in the study was left to sophisticated software that is designed for the purpose of processing images and generating estimates.

Observing techniques have vastly improved with greater reliance on remote sensing data from satellites and aircraft that capture high-resolution images over large areas. For the last phase, from 2003 to 2010, the researchers relied on laser altimetry and radar altimetry to estimate the ice elevation and map the receding ice sheet.


Their estimations show an average annual ice loss of about 75 gigatons for the first two phases—an 80-year-long period and a 20-year one.
The most recent data showed that an average of 186 gigatons of ice was lost during 2003-10, which is only a seven-year period.
Please tell us how much 33F water is required to lower the North Atlantic ocean one degree.
 
Dufus denies the call by the warming mythers to throw people into prison for questioning them.

If you're not lying outright there for the glory of your cult, it will be easy for you to back that up with evidence.

But you won't, being you just made it up, just like you make up everything. It's what you do. It's all you do.

It is the only way your "science" works. Eliminate science from your agenda.

Weatherman, do you condemn the Republican party for its attempts to jail climate scientists for doing science which is inconvenient to TheParty?

If you condemn it, you'll be the first denier here to do so. I've asked many times. Not a single denier has ever been willing to condemn it. Without exception, every denier on this board enthusiastically endorses such Stalinist tactics. They all excuse it with "But they're criminals and EnemiesOfTheState!", just as the Stalinists said about their victims.
 

Forum List

Back
Top