SSDD
Gold Member
- Nov 6, 2012
- 16,672
- 1,966
- 280
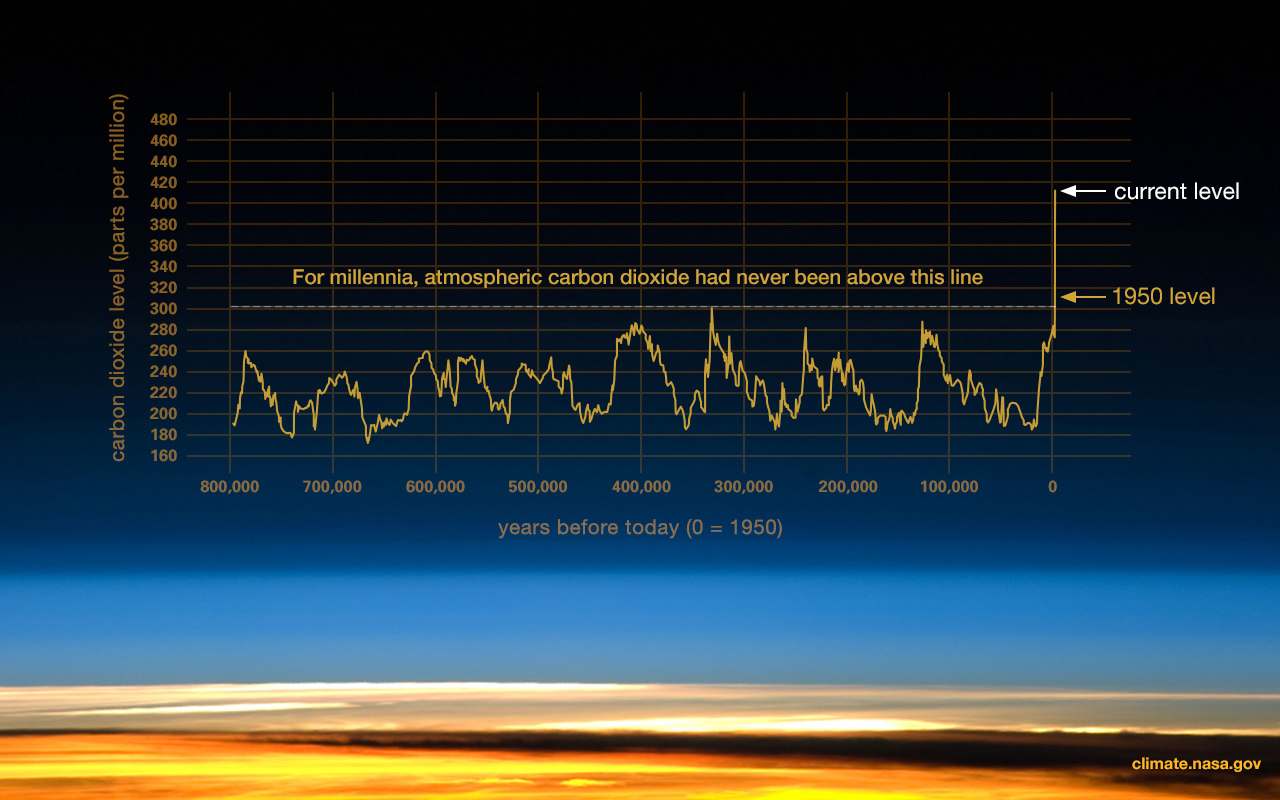
The further back you go, the deeper you get into the ice age that the earth is presently trying to warm out of. Cold oceans hold more CO2 than warm oceans, and cold climate depress the earth's own CO2 making machinery. As the earth warms, its own CO2 making machinery kicks into a higher gear, and warmer oceans outgas more CO2.
If that chart went back to the period prior to the onset of the present ice age, you would see atmospheric CO2 levels at the time that the earth started cooling into the ice age of about 1000ppm...more than twice the present level.
Climate sceince likes to show you just enough to make you think things have always been a certain way...they never show you the real long term trend. The fact is that by historical standards, our 400ppm indicates a CO2 drought in the earth's atmosphere. Rarely has it ever been this low in the entirety of earth's history.