By Program
[TBODY][TR][TD="colspan: 2"]
Social Security, Unemployment, and Labor
Medicare and Health
National Defense
Net Interest
Other[/TD][/TR]
[TR][TD="colspan: 2"]Source: Office of Management and Budget - Table 3.2[/TD][/TR][/TBODY]
[TBODY][TR][TD="colspan: 2"]Spending Overview
[TBODY][TR][TD="colspan: 2"]
FY 2015 Program Spending
37%27%16%6%7 othersSocial Security, Unemployment, and Labor
Medicare and Health
National Defense
Net Interest
Other[/TD][/TR]
[TR][TD="colspan: 2"]Source: Office of Management and Budget - Table 3.2[/TD][/TR][/TBODY]
- Spending on Social Security, unemployment, and labor is estimated to be about 37% of all outlays in 2015. This is greater than average when compared to budgets from other years. (Average proportion = 35%)
- Medicare and general health spending is estimated to be about 27% of all outlays that year. This is one of the highest proportions spent when compared to budgets from other years. (Average proportion = 13%)
- Spending on national defense is estimated to be about 15% of all outlays that year. This is less than average when compared to budgets from other years. (Average proportion = 21%)
- As for spending on net interest, the government estimates it will dedicate about 6% of all its outlays that year to paying down its accumulated debt. This is less than average when compared to budgets from other years. (Average proportion = 8%)
- All other programs (agriculture, energy, commerce and housing credit, community and regional development, etc.) in 2015 are estimated to make up approximately 15% of national spending.
Percentage
Amount
[/TD][/TR][/TBODY] You won't be able to get them in Somalia....did you think about that?
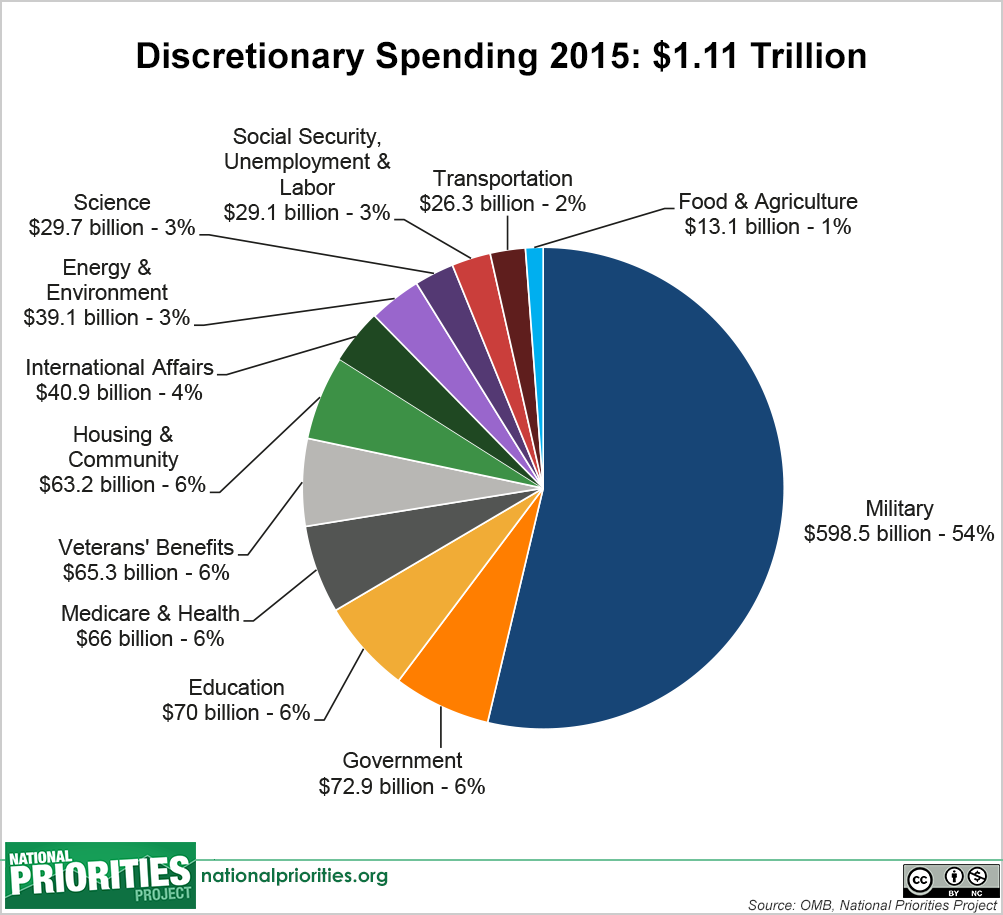

")

