Navigation
Install the app
How to install the app on iOS
Follow along with the video below to see how to install our site as a web app on your home screen.
Note: This feature may not be available in some browsers.
More options
You are using an out of date browser. It may not display this or other websites correctly.
You should upgrade or use an alternative browser.
You should upgrade or use an alternative browser.
States where you are least likely to live paycheck to paycheck
- Thread starter Wyatt earp
- Start date

Wyatt earp
Diamond Member
- Apr 21, 2012
- 69,975
- 16,396
- 2,180
- Thread starter
- #23

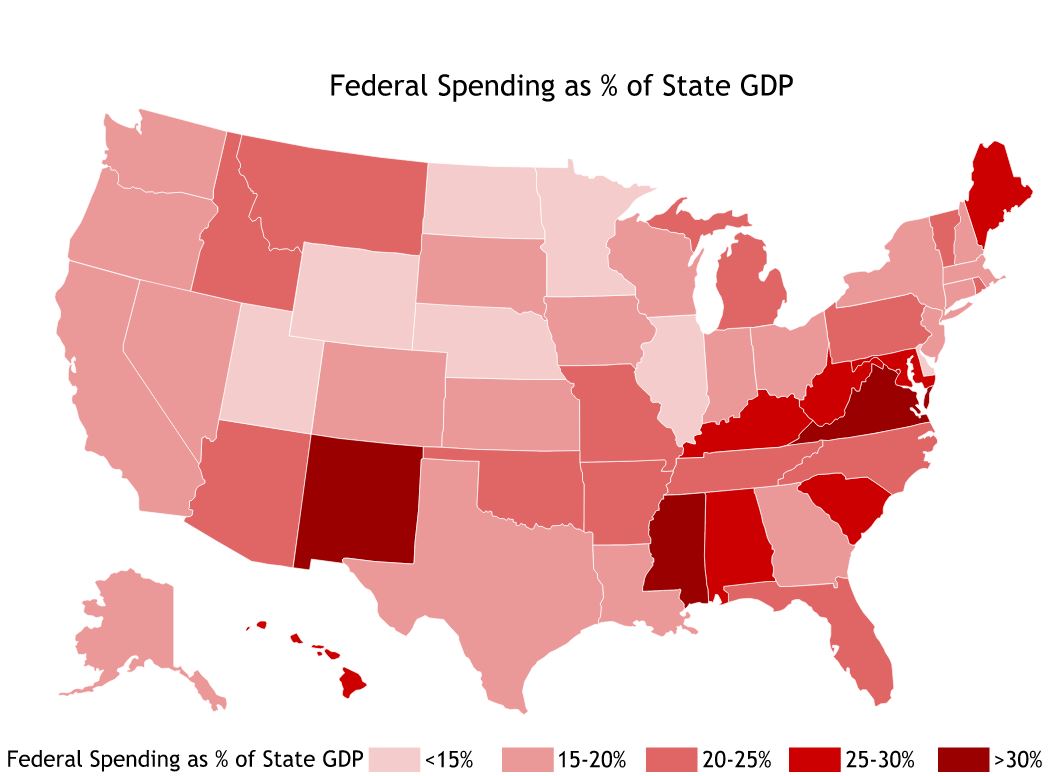
And a state like New Mexico you don't think Los Alamos National Lab has anything to do with it?
of course you do..........
Moonglow
Diamond Member
NW Arkanass is one of the highest cost per capita in the state of Ark, also the fastest growing.
Joplin, Mo is the most affordable.
But, Broken Arrow, Ok by Tulsa if you like that metroplex lifestyle with live street walkers by the river on the east side.(crack also available).
Joplin, Mo is the most affordable.
But, Broken Arrow, Ok by Tulsa if you like that metroplex lifestyle with live street walkers by the river on the east side.(crack also available).
Wyatt earp
Diamond Member
- Apr 21, 2012
- 69,975
- 16,396
- 2,180
- Thread starter
- #26
State Fiscal Rankings
State Fiscal Rankings
Ranking the States by Fiscal Condition 2018 Edition
All States
DC
KEY MATERIALS
- Download the Full Paper

- Download the Research Summary
- Download the 2016 Data

- Download the 2006-2016 Data
- Download the Map
For the fifth and final year, a new study from the Mercatus Center at George Mason University ranks the 50 states according to their financial condition. Each edition has provided a snapshot of each state’s fiscal health by providing information from audited state financial reports in an easily accessible format. In “Ranking the States by Fiscal Condition, 2018 Edition,” Eileen Norcross and Olivia Gonzalez calculate this year’s rankings from each state’s fiscal year 2016 reports and then apply trend analysis to reports for each year from 2006 until 2016.
The study measures how well states can meet short-term and long-term bills by examining their financial statements. Most states are in a stable condition, with the exception of the size of unfunded pension liabilities (a large portion of most state government obligations). Some states also have consistently low levels of cash, which indicate the potential for budget shortfalls during a recession.
A Multidimensional Approach to Fiscal Solvency
The study analyzes state finances according to five dimensions. These dimensions combine to produce an overall ranking of state fiscal solvency.
- Cash solvency. Does a state have enough cash on hand to cover its short-term bills?
- Budget solvency. Can a state cover its fiscal year spending with revenues, or does it have a budget short-
fall? - Long-run solvency. Can a state meet its long-term spending commitments? Will there be enough money to cushion it from economic shocks or other long-term fiscal risks?
- Service-level solvency. How large a percentage of personal income are taxes, revenue, and spending? How much “fiscal slack” does a state have to increase spending if citizens demand more services?
- Trust fund solvency. How much debt does a state have? How large are its unfunded pension and healthcare liabilities?
The top five most fiscally solvent states are Nebraska (#1), South Dakota (#2), Tennessee (#3), Florida (#4), and Oklahoma (#5).
Bottom Five States
The bottom five states in terms of fiscal solvency are Kentucky (#46), Massachusetts (#47), New Jersey (#48), Connecticut (#49), and Illinois (#50).
Moonglow
Diamond Member
I live by Noel, Mo... Sales tax is 6%...Lower on food items...
And a state like New Mexico you don't think Los Alamos National Lab has anything to do with it?
I have no idea, but i'm sure your southern fried logic will be enlightening
~S~
Wyatt earp
Diamond Member
- Apr 21, 2012
- 69,975
- 16,396
- 2,180
- Thread starter
- #29
Wyatt earp
Diamond Member
- Apr 21, 2012
- 69,975
- 16,396
- 2,180
- Thread starter
- #30
And a state like New Mexico you don't think Los Alamos National Lab has anything to do with it?
I have no idea, but i'm sure your southern fried logic will be enlightening
~S~
Of course you dont you sit next to a computer dotting your "I's and crossing your "T's" it is so important to you.
Indeependent
Diamond Member
- Nov 19, 2013
- 73,633
- 28,506
- 2,250
Living in Nassau County has become unsustainable...corruption from both sides of the aisle and school taxes have sky rocketed.Yup the top ones are red states..
States where you are least likely to live paycheck to paycheck
According to the most recent study on the topic, about 78 percent of U.S. workers are living off one check at time to make ends meets, according to a CareerBuilder surveyOpens a New Window. in 2017.
What's more, having a higher salary doesn't necessarily mean your money woes are behind you either. According to the national survey, nearly one in 10 workers making $100,000 or more are also living paycheck to paycheck.
- HOW MUCH YOU NEED TO BE IN THE TOP 5% IN EVERY STATEOpens a New Window.
- HOW MUCH YOU REALLY NEED TO LIVE COMFORTABLY IN ALL 50 STATESOpens a New Window.
- THESE ARE THE BEST STATES FOR JOB SEEKERSOpens a New Window.
unemployment rateOpens a New Window. remaining at 3.8 percent and average hourly earnings rising by 4 cents to $27.70, according to March's jobs report,Opens a New Window.workers are still stretching out their paychecks, especially along the coasts.
But on the flip side, according to a new study released Friday by personal finance website GoBankingRates.com,Opens a New Window. some states make it really easy to carry over leftover cash each month.
well that didn't take long for racism to rear it's ugly head
how predictable y'all are
~S~
And a state like New Mexico you don't think Los Alamos National Lab has anything to do with it?
I have no idea, but i'm sure your southern fried logic will be enlightening
~S~
Of course you dont you sit next to a computer dotting your "I's and crossing your "T's" it is so important to you.
You're the OP playin' with stats pal
care to continue?
~S~
Wyatt earp
Diamond Member
- Apr 21, 2012
- 69,975
- 16,396
- 2,180
- Thread starter
- #34
Democratic policies have made California poorer
Democratic policies have made California poorer
By Travis Allen Oct. 5, 2017 Updated: Oct. 5, 2017 8:52 a.m.
A Los Angeles street corner is crowded with tents and possessions of the homeless. The sprawling Southern California city has one of the nation’s largest homeless populations.
Photo: FREDERIC J. BROWN, AFP/Getty Images
California has an abundance of poverty and a shortage of housing. Crime, energy prices, rent and the general cost of living are increasing. Our tax burden is one of the highest in America. Californians pay 40 percent more than the national average for their energy. All of this is the predictable result of state laws and regulations that the elites can afford but that make the rest of California poorer.
Call it poverty by design.
One party, the Democrats, enjoys unchallenged control of California government and for a generation has been actively ignoring basic economic principles to implement its progressive policies. Our socioeconomic maladies are squarely, inarguably, the responsibility of the party in power. By every measurement, our standard of living comes up short in comparison to other states. California once led the nation in opportunity, housing, affordability, educational excellence and upward mobility. Now we rank at or near the bottom in nearly every category.
Moonglow
Diamond Member
That's a lie about them Kansass farmers..
LeeOnLido
Gold Member
- Jul 1, 2018
- 5,703
- 1,676
- 190
i must be in that evil one percent being my credit score is over 750. if i need cash, i just write a check to myself. for any amount!That's a lie about them Kansass farmers..
For the love of God.....this is one highly scientific poll taken, huh?

From your source:
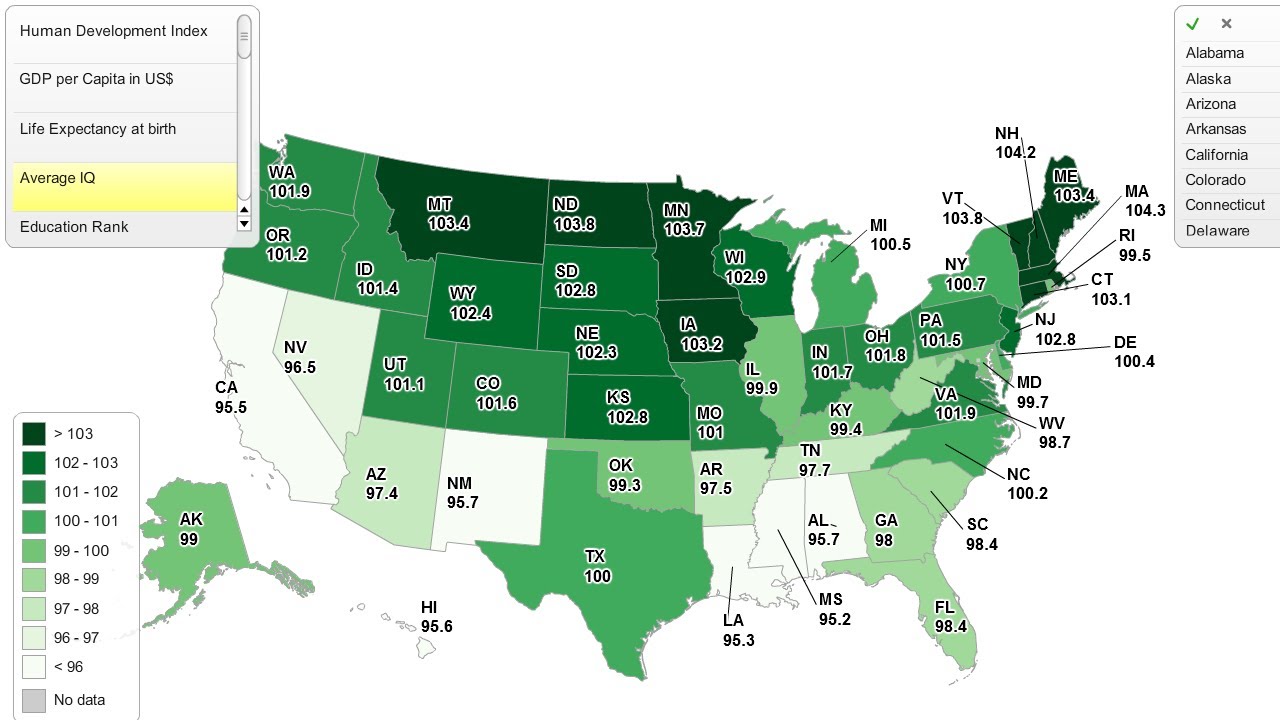
Living in Massachusetts or New Hampshire may mean you’re more intelligent than residents of California and Mississippi.
That's according to a recent study of reading levels and IQs, based on 500,000 Twitter messages posted by people across the U.S.
The study used a computer algorithm to score tweets based on spelling, grammar and word choice, and found a significant difference in state-by-state intelligence.
Similar threads
- Replies
- 9
- Views
- 122
- Replies
- 92
- Views
- 937
- Replies
- 74
- Views
- 955
Latest Discussions
- Replies
- 167
- Views
- 732
- Replies
- 408
- Views
- 2K
Forum List
-
-
-
-
-
Political Satire 8512
-
-
-
-
-
-
-
-
-
-
-
-
-
-
-
-
-
-
-
ObamaCare 781
-
-
-
-
-
-
-
-
-
-
-
Member Usernotes 483
-
-
-
-
-
-
-
-
-
-