Old Rocks
Diamond Member
Here is the present problem for the denialists. The whole world has accepted what the scientists are stating. They have become a mere footnote to history. A sad one at that.
Follow along with the video below to see how to install our site as a web app on your home screen.
Note: This feature may not be available in some browsers.
Here is the present problem for the denialists. The whole world has accepted what the scientists are stating. They have become a mere footnote to history. A sad one at that.
Here is the present problem for the denialists. The whole world has accepted what the scientists are stating. They have become a mere footnote to history. A sad one at that.

 ). That means the science isn't mattering........and please with the solar growth stuff. Its anemic at best and a tiny little sliver of the energy pie and will be for many decades.
The graphs I posted were the result of feeding "GCM, hindcasting, climate models" into Google.
You have all repeatedly claimed that ALL GCMs fail. That I show any that succeed refutes you. And I have shown more total models than you've put up from Spencer. If you think I haven't quite gotten there, I can just go back to Google and get a hundred more graphs.
If you want someone to take Spencer's shite seriously, why don't you attempt to refute the points made in HotWhopper: Roy Spencer's latest deceit and deception without falling back on simply insulting its author. Show us that Spencer did NOT do what she shows us that he did. Show us that it did NOT have the effects on the comparison that she shows us it did. I'll bet money you can't do it and I'll win.

Failure? After Paris? Knowing that almost every single climate scientists on the planet accepts AGW? The only failure we're going to suffer will be the common one - that all will suffer due to the shortsighted greed and ignorance of people exactly like you.

 Republicans
repub clinger politicians can't act like Repub jesus didn't give the planet to them to plunder. Otherwise they'd lose their Base. Plus they'd lose Big Oil/Coal lobbyist $$$I ask every Gw denier if its a problem in china they can't see a foot past their noses and they all agree living like that is no good.I was showing reason to agree with you. Smog is produced primarily by the combustion of fossil fuels.
Go green.
The graphs I posted were the result of feeding "GCM, hindcasting, climate models" into Google.
You have all repeatedly claimed that ALL GCMs fail. That I show any that succeed refutes you. And I have shown more total models than you've put up from Spencer. If you think I haven't quite gotten there, I can just go back to Google and get a hundred more graphs.
If you want someone to take Spencer's shite seriously, why don't you attempt to refute the points made in HotWhopper: Roy Spencer's latest deceit and deception without falling back on simply insulting its author. Show us that Spencer did NOT do what she shows us that he did. Show us that it did NOT have the effects on the comparison that she shows us it did. I'll bet money you can't do it and I'll win.

What the fuck are you talking about?

You have yet to even make an attempt to answer the charge that Spencer shifted the model outputs up and the observations down. This line of yours that models were cherry picked is complete nonsense and clearly shows you don't even understand what CMIP is. Here, taste reality:
Refute her charges. I'll wait.

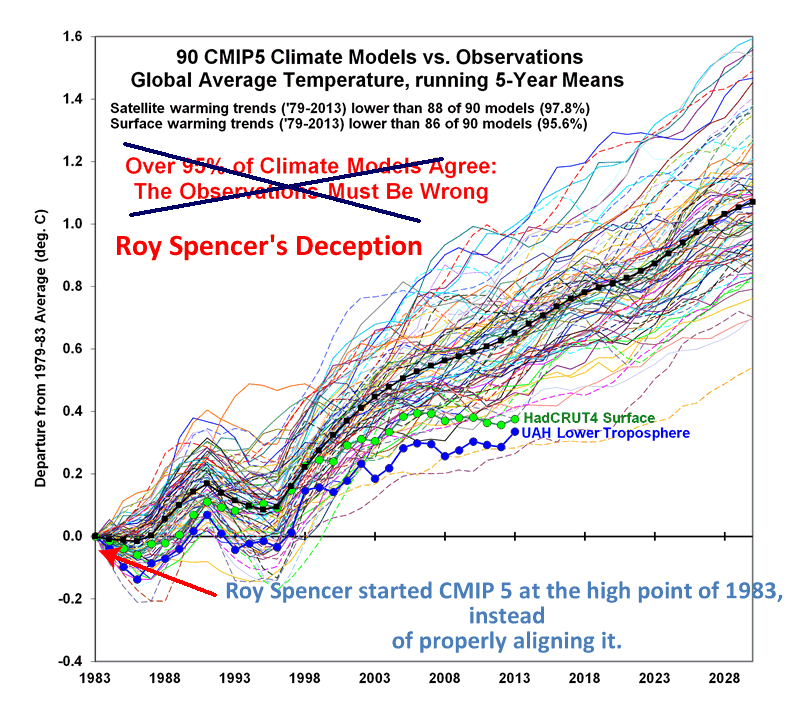
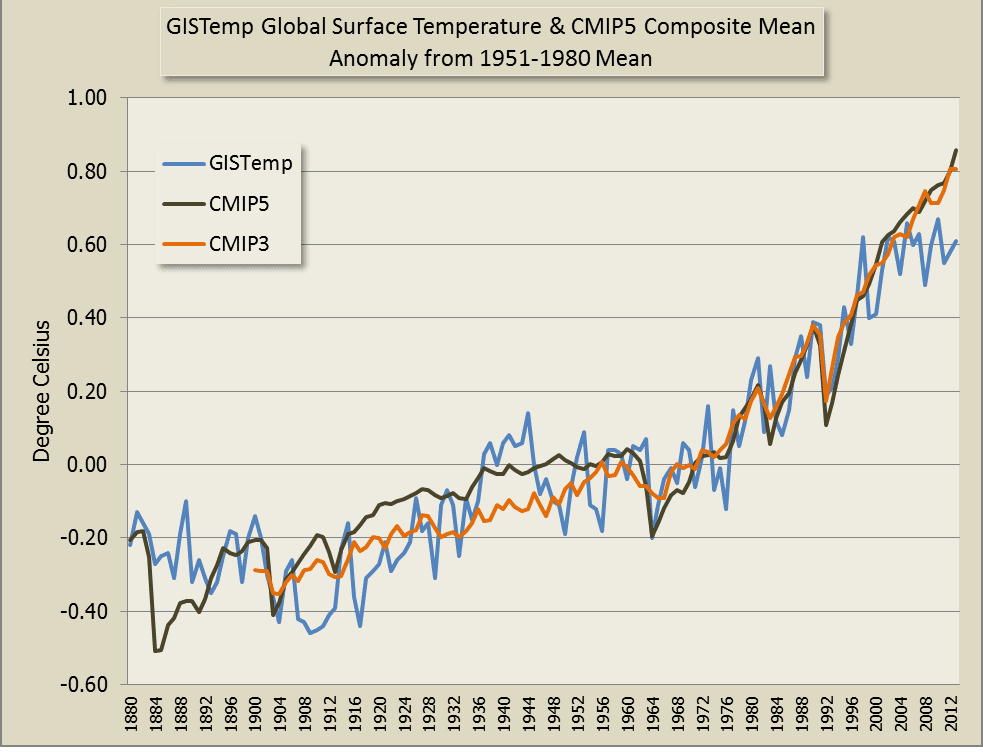


IPCC AR5, using a low RCP, and only seven years into the projection. the models run hot. period. comparing the actual trends makes it even more obvious.