AntonToo
Diamond Member
- Jun 13, 2016
- 31,603
- 9,261
- 1,340
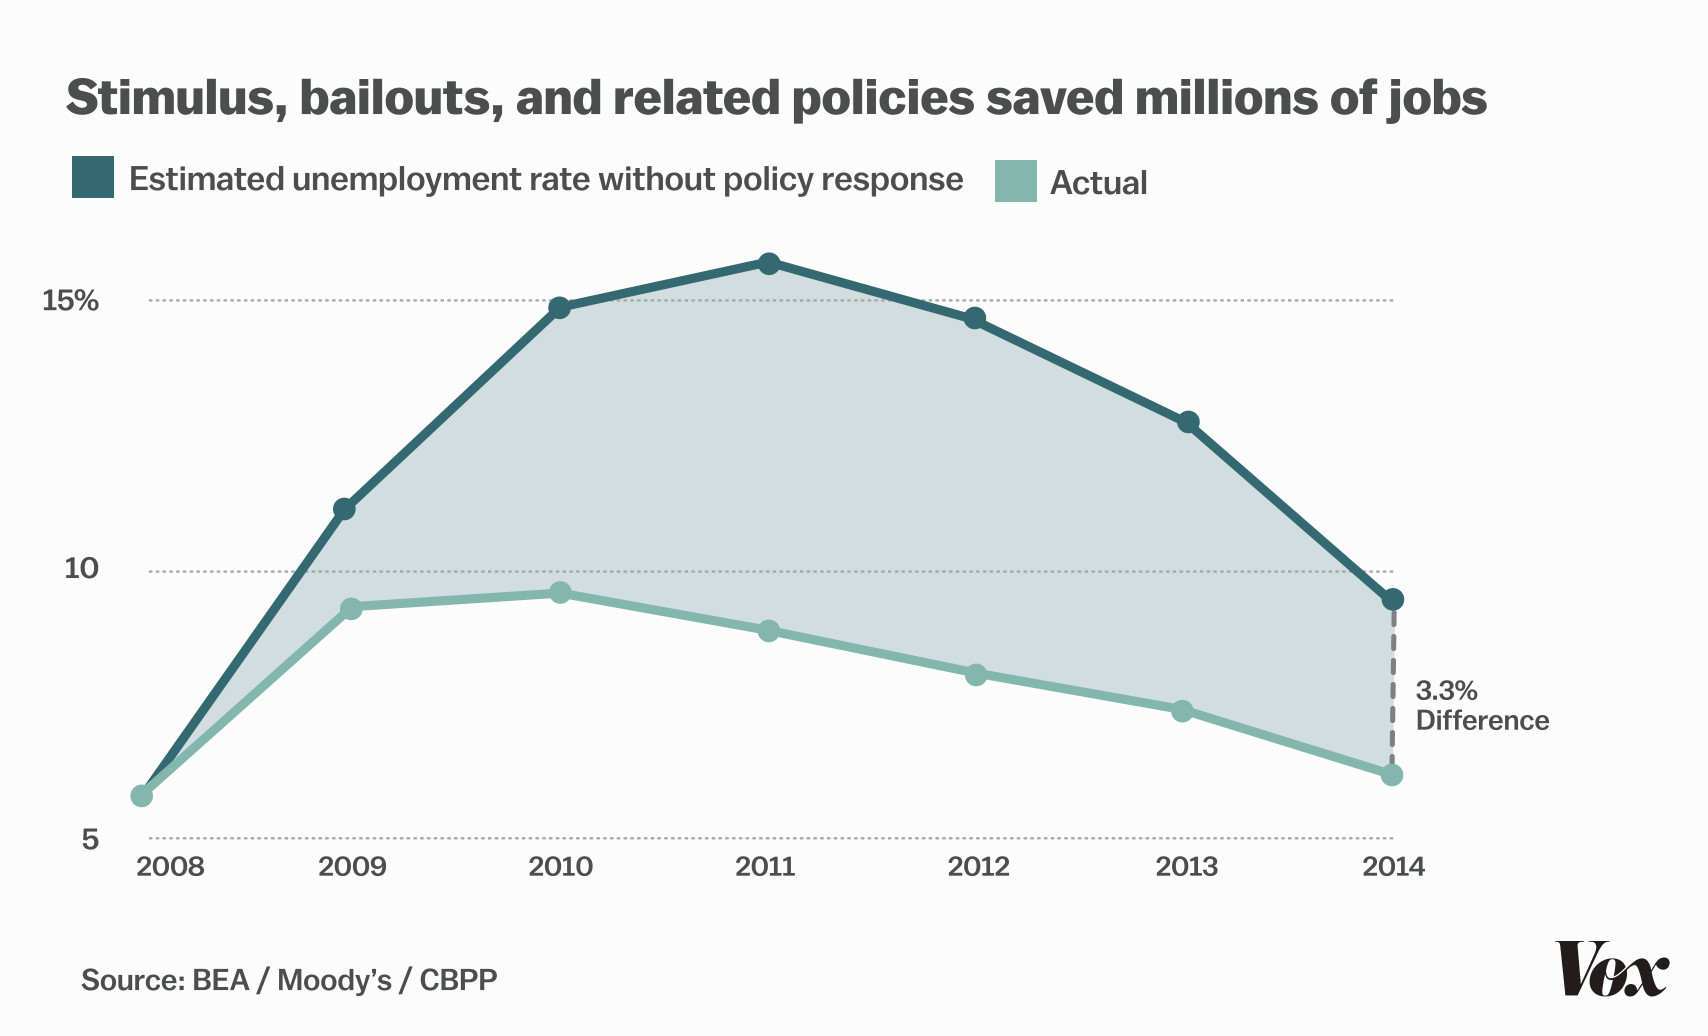
That was the great thing about the entire "Jobs created or saved" from a political standpoint. You could get whatever number you felt like simply by changing the BASELINE! You didn't have to deal with a static number like "Jobs created" that had to have some basis in reality...you could make it up as you went because there is no way on God's green earth you can verify "Jobs Saved"!
I've asked you how many jobs YOU think 800 billion dollar injection into economy causes.
I've yet to hear an answer (because you are clueless)