One other thing Just because a person receives benefits does not mean they have retired.And this reply that you deleted from my last post?Learn to read, I said 10,000 Boomers reach RETIREMENT AGE every day, 300,000 reach RETIREMENT AGE a month and I said according to the AARP study 54% of Boomers that reach retirement AGE retire by age 65.
To YOU that means 10,000 Boomers retire a day and 300,000 retire every month because YOU don't do percentages. But YOU are an illiterate
Yeah, each year you have a million Boomers retire of the over 3 million Boomers who reach retirement in each year. And you know that very well also, so stop deflecting from FOX's obvious lie in the OP!!!!!
So that means that about 100,000 leave the ranks of the unemployed every month to take the place of the retiring Boomers without creating a single NEW job!!!!!
You have said 10,000 a month you have said 100,000 a month you have said 160,000 a month and you have said 300,000 a month baby boomers are retiring.
But have never shown a supporting source.
You have said 10,000 a month retiring baby boomers retiring in other threads and no I'm not chasing those down These two replies show that you lie
All Beneficiaries, December 2010
About 59.2 million people received a payment from Social Security. Most (51.3 million) received OASDI benefits only, about 5.2 million received SSI only, and 2.7 million received payments from both programs.
Fast Facts & Figures About Social Security, 2011
All Beneficiaries, December 2008
About 55.8 million people received a payment from Social Security. Most (48.3 million) received OASDI benefits only, about 4.9 million received SSI only, and 2.6 million received payments from both programs.
Fast Facts & Figures About Social Security, 2009
There was a total addition of 3.4 million in 2 years, which equals 30769 a week, which is no where near 100k nor is it any where near the 500k we added in the not in cat last month
Navigation
Install the app
How to install the app on iOS
Follow along with the video below to see how to install our site as a web app on your home screen.
Note: This feature may not be available in some browsers.
More options
You are using an out of date browser. It may not display this or other websites correctly.
You should upgrade or use an alternative browser.
You should upgrade or use an alternative browser.
April Jobs report looks dismal, March numbers to be revised????
- Thread starter JRK
- Start date
edthecynic
Censored for Cynicism
- Oct 20, 2008
- 43,044
- 6,883
- 1,830
Your math is questionable, but even that is right in the ballpark of the numbers I was using. 30,769 per week is almost 140k per month very close to the 160k approximation from the AARP since there are a number of retirees who do not collect SS.And this reply that you deleted from my last post?Learn to read, I said 10,000 Boomers reach RETIREMENT AGE every day, 300,000 reach RETIREMENT AGE a month and I said according to the AARP study 54% of Boomers that reach retirement AGE retire by age 65.
To YOU that means 10,000 Boomers retire a day and 300,000 retire every month because YOU don't do percentages. But YOU are an illiterate
Yeah, each year you have a million Boomers retire of the over 3 million Boomers who reach retirement in each year. And you know that very well also, so stop deflecting from FOX's obvious lie in the OP!!!!!
So that means that about 100,000 leave the ranks of the unemployed every month to take the place of the retiring Boomers without creating a single NEW job!!!!!
You have said 10,000 a month you have said 100,000 a month you have said 160,000 a month and you have said 300,000 a month baby boomers are retiring.
But have never shown a supporting source.
You have said 10,000 a month retiring baby boomers retiring in other threads and no I'm not chasing those down These two replies show that you lie
All Beneficiaries, December 2010
About 59.2 million people received a payment from Social Security. Most (51.3 million) received OASDI benefits only, about 5.2 million received SSI only, and 2.7 million received payments from both programs.
Fast Facts & Figures About Social Security, 2011
All Beneficiaries, December 2008
About 55.8 million people received a payment from Social Security. Most (48.3 million) received OASDI benefits only, about 4.9 million received SSI only, and 2.6 million received payments from both programs.
Fast Facts & Figures About Social Security, 2009
There was a total addition of 3.4 million in 2 years, which equals 30769 a week, which is no where near 100k nor is it any where near the 500k we added in the not in cat last month
- Thread starter
- #343
One other thing Just because a person receives benefits does not mean they have retired.And this reply that you deleted from my last post?
You have said 10,000 a month you have said 100,000 a month you have said 160,000 a month and you have said 300,000 a month baby boomers are retiring.
But have never shown a supporting source.
You have said 10,000 a month retiring baby boomers retiring in other threads and no I'm not chasing those down These two replies show that you lie
All Beneficiaries, December 2010
About 59.2 million people received a payment from Social Security. Most (51.3 million) received OASDI benefits only, about 5.2 million received SSI only, and 2.7 million received payments from both programs.
Fast Facts & Figures About Social Security, 2011
All Beneficiaries, December 2008
About 55.8 million people received a payment from Social Security. Most (48.3 million) received OASDI benefits only, about 4.9 million received SSI only, and 2.6 million received payments from both programs.
Fast Facts & Figures About Social Security, 2009
There was a total addition of 3.4 million in 2 years, which equals 30769 a week, which is no where near 100k nor is it any where near the 500k we added in the not in cat last month
I realize that but did he not say there is 300,000 a month retiring baby boomers?
There is only about 50% of the total on the program over 65
Aged 65 or older 39,605 (million total out 61 million)
Monthly Statistical Snapshot, March 2012
That means there is about 15,000 a week you could call baby boomers
or 70k a month
He has been all over the place, but no where near 10k a day, yet any-way
My issue is and has been the not-in work force # is sky rocketing
150k a month is no where near the 500k we added last month
He's said so much shit I don't know anymore.One other thing Just because a person receives benefits does not mean they have retired.All Beneficiaries, December 2010
About 59.2 million people received a payment from Social Security. Most (51.3 million) received OASDI benefits only, about 5.2 million received SSI only, and 2.7 million received payments from both programs.
Fast Facts & Figures About Social Security, 2011
All Beneficiaries, December 2008
About 55.8 million people received a payment from Social Security. Most (48.3 million) received OASDI benefits only, about 4.9 million received SSI only, and 2.6 million received payments from both programs.
Fast Facts & Figures About Social Security, 2009
There was a total addition of 3.4 million in 2 years, which equals 30769 a week, which is no where near 100k nor is it any where near the 500k we added in the not in cat last month
I realize that but did he not say there is 300,000 a month retiring baby boomers?
There is only about 50% of the total on the program over 65
Aged 65 or older 39,605 (million total out 61 million)
Monthly Statistical Snapshot, March 2012
That means there is about 15,000 a week you could call baby boomers
or 70k a month
He has been all over the place, but no where near 10k a day, yet any-way
My issue is and has been the not-in work force # is sky rocketing
150k a month is no where near the 500k we added last month
Annie
Diamond Member
- Nov 22, 2003
- 50,848
- 4,827
- 1,790
The numbers are clear, the comments are cogent and accurate, and you are wrong.
Nothing you say changes that. You may have the last word, so we can all chuckle at you.
Dumb ass
Annie is saying 10,000 a day is retiring eds saying 100,000 a month. I know you aren't that bright but there are only 30 to 31 days in each month excluding Feb.
Go back to school and take a few math courses
What I, (Annie) meant to state was that 10k people in 2011 daily hit 65 years of age. If Ed says that 100k are retiring monthly that means some 65 year olds aren't retiring at 65. Some retired earlier, some much earlier, they started collecting SSI at 62 if they chose the reduced rate. Others may work a few more, then retire at full SSI.
The big deal with the boomers though, the peak years are those whom were born in the 50's, those in the 40's and 60's are much smaller in numbers. That big 'cohort' they are screwed.
itfitzme
VIP Member
He's said so much shit I don't know anymore.One other thing Just because a person receives benefits does not mean they have retired.
I realize that but did he not say there is 300,000 a month retiring baby boomers?
There is only about 50% of the total on the program over 65
Aged 65 or older 39,605 (million total out 61 million)
Monthly Statistical Snapshot, March 2012
That means there is about 15,000 a week you could call baby boomers
or 70k a month
He has been all over the place, but no where near 10k a day, yet any-way
My issue is and has been the not-in work force # is sky rocketing
150k a month is no where near the 500k we added last month
I gave up trying to follwo the convo along time ago. And it really doesn't matter because we cannot take an average estimate from one survey and subtract it from a monthly statistic of another survey. Doing so is complete bs. As such, the question of what the average is is meaningless. Whatever it is, it can't be used anyways.
I look for answerable questions.
"My issue is and has been the not-in work force # is sky rocketing" is an answerable question.
The simple answer is that it always goes up because population is always growing.
At the very least, we have to normalize for population growth.
I'm rather amused by Ed's contention that it's older workers retiring that is REALLY behind the rather startling numbers of people we're seeing leaving the work force these days.
Couldn't be that the economy is grinding along at about a 2% growth rate and there just aren't jobs to be had STILL after 3 1/2 years of Obama handling the economy...
Couldn't be that we need to be adding 250,000 new jobs a month to keep up with increases in the population and we're not even CLOSE to doing that and haven't for years now...
You keep coming up with those excuses for why it's not Barry's fault though, Ed...it's only about six months to the election. Who cares if the man you support has ZERO plans to fix our problems if he does somehow get re-elected...what's important is getting him another four years...right?
Annie
Diamond Member
- Nov 22, 2003
- 50,848
- 4,827
- 1,790
I'm rather amused by Ed's contention that it's older workers retiring that is REALLY behind the rather startling numbers of people we're seeing leaving the work force these days.
Couldn't be that the economy is grinding along at about a 2% growth rate and there just aren't jobs to be had STILL after 3 1/2 years of Obama handling the economy...
Couldn't be that we need to be adding 250,000 new jobs a month to keep up with increases in the population and we're not even CLOSE to doing that and haven't for years now...
You keep coming up with those excuses for why it's not Barry's fault though, Ed...it's only about six months to the election. Who cares if the man you support has ZERO plans to fix our problems if he does somehow get re-elected...what's important is getting him another four years...right?
Actually that is what most financial writers are saying. One would assume they are keeping tabs on retirements, but the gist is that there are more folks just dropping out of the work force, after exhausting Unemployment benefits. Expect huge numbers in IL in next report, as the 'state unemployment rate' dropped below the federal threshold for extended benefits last week.
edthecynic
Censored for Cynicism
- Oct 20, 2008
- 43,044
- 6,883
- 1,830
Bullshit!I'm rather amused by Ed's contention that it's older workers retiring that is REALLY behind the rather startling numbers of people we're seeing leaving the work force these days.
Couldn't be that the economy is grinding along at about a 2% growth rate and there just aren't jobs to be had STILL after 3 1/2 years of Obama handling the economy...
Couldn't be that we need to be adding 250,000 new jobs a month to keep up with increases in the population and we're not even CLOSE to doing that and haven't for years now...
You keep coming up with those excuses for why it's not Barry's fault though, Ed...it's only about six months to the election. Who cares if the man you support has ZERO plans to fix our problems if he does somehow get re-elected...what's important is getting him another four years...right?
As CON$ have been claiming for the last decade as the rationalization for privatizing SS that, "The number of retirees in this generation is growing much faster than the people are entering the work force to replace them."
Read more here: Money Matters | When doing the Social Security math, the numbers just don’t add up - KansasCity.com
The Social Security benefits math illustrates the price of failing to address the long anticipated retirement of the baby boom generation. The eldest of those 77 million Americans born between 1946 and 1964 became eligible for Social Security four years ago. The number of retirees in this generation is growing much faster than the people are entering the work force to replace them.
Still waiting on those ACTUAL retirement number ed you keep saying the same old shit. You give nothing to support what you say. A link showing the percentage and you telling me to do the math is not giving the numbers of baby boomers that have retired.
Last edited:
itfitzme
VIP Member
So here is NILFNSA normalized for CPOP. I've shown just 2005 and on.

It has three significant variations. The seasonal variation is obvious. It stands out clearly. At a lower frequency, the long term trends are apparent. From 2005 through to recessionary effect, the long term trend was flat. Once the recession kicked in, the long term trend was upward. The third variation is much higher frequency. It can be seen riding on top of the seasonal variation. It is just month to month noise. Some months, for no good reason, are higher or lower then other months.
It would be nice to separate these out then just eyeball them. The BSL does provide seasonal adjustment. I don't do it simply because I haven't created a tool for it. I can see it anyways and don't have the need for a number, so I don't have a reason.
It would be nice to take out the seasonal and random variation so that just the long term trend is apparent. The problem with trying to take out the random variation towards the end of the series is that there is no guarantee that the change is due to some randomness or is a change in the long term trend. The long term trend can only be determined after a long time. That the shits but it is also fairly obvious.
So if we look at that little upward tick in April, the compare it to the noise riding on the seasonal variation, it looks like it may very well be that it is just more noise.
The only thing we can really say is that the long term trend since the recession began has not demonstrated any serious change. Even if it does change considerably, we won't really be able to guarantee it has changed until at least an entire year has passed. Even then it is questionable.
So back to the question as to why the NILFNSA has "sky rocketed". Well, I don't have a measure for "sky rocketed". I would say that, since the beginning of the recession, it has "sky rocketed". I wouldn't classify the minor variability as "sky rocketing". Perhaps you consider the April uptick as "skyrocketing". If so, I've got to as, what about the same upticks that have occurred during the period of 2005 to the recession? How about the seasonal change, from like December to July? Are these changes "skyrocketing"? And if so, then what meaning does "skyrocketing" have if every seasonal and random variation is "skyrocketing", that is if it doesn't identify anything in particular?
Regardless of what this means, the question of why the NILFNSA to CPOP ratio increases can be numerous. It all depends on who they are.
One is simply that more people are entering the workforce then are getting jobs.
Jobs can be added at a rate faster then people graduate from school (or turn 16). I would imagine, in this job climate, that 16 year olds aren't going to find a lot of jobs. Unskilled labor over the age of 25 is thrilled to get that McDonald's job. I remember when news papers were delivered by paperboys. By 1985, they were delivered by adults.
The BLS has a shit load of finer detail on the NILF. The next step would be to look at the finer details and find out what the BLS CPS has to offer in terms of what category is the largest contributor to the NILFNSA trend.
Now it gets complicated because of the shit load of categories. There are a total of 645 individual categories for unadjusted not in labor force data. There is marital status, race, gender, age groups, job search categories (WAJN, Not looking, etc.), education enrollment, veteran status, health status, family responsibilities status, disability status, etc. If we add the flows categories, inflows and outflows, the number is 741. (To be clear, the 645 includes some "flows" as in "not in labor force flows". So the flows isn't 741 - 645. I just didn't notice the "not in labor force flows" when I did the first query on "not in labor force". It's would have been faster to redo the query then explain it, but I already committed to the explanation before I recognized this.) ;-)
So, the question becomes, what NILF categories to look at first and how long it will take to do all of them. Then the question becomes one of understanding what categories actually overlap. They are not all mutually exclusive.
Here are a couple of CPS categories that might answer the question;
ID series_id series_description
32751 LNU05024937 (Unadj) Not in Labor Force, 50-54 yrs.
32514 LNU05000094 (Unadj) Not in Labor Force, 55-59 yrs.
32516 LNU05000096 (Unadj) Not in Labor Force, 60-64 yrs.
32753 LNU05024938 (Unadj) Not in Labor Force, 65-69 yrs.
32759 LNU05024941 (Unadj) Not in Labor Force, 70-74 yrs.
If those are increasing, more then anything else, then it seems like we are getting towards the concept of baby boomers retiring being the answer. If they aren't, it kind of kills the idea.
This is the only way to answer the question. There is no other way. Any other way is simply wrong.
Another easier way might be to simply email someone at the BLS and ask them to answer the question. Why not? It's our tax dollar.
itfitzme
VIP Member
So here are the NILF by 16 to 59 and by 60 and over per total NILF and total CPOP. I've kept the scales the same, in terms of range, so that they curves can be eyeballed.


Just for a check, notice that the spread between the two per CPOP curves gets wider toward the end. This is consistent with the ratios to NILF total.
So, what does it tell us, in terms of which is driving the NILF total per capita to get larger and which is a larger contributor to the NILF.
Well, looks like, for the most part, neither is a large driver but, as a percentage of the total NILF, over 60 is getting slightly smaller.
Does this mean that growth in the 60 and older crowd isn't a major contributor to NILF? Not really. After all, 16 to 59 would be much larger then 60 and over, all other things being equal. Own would hope that the two would be obviously different. Really, nothing is jumping out.
All in all, though, they are both increasing as a percentage of the total CPOP. I would expect, lacking any other reason not to, that NILF would be flat with respect to CPOP. Both are increasing, and I wonder why? Does any particular age show more entry into the NILF then others?
What is interesting is that the over 59 crowd does not display the same seasonality that the under 60 crowd does. The under 60 crowd is affected by the seasonality of the work force. (This isn't apparent in the per NILF because the NILF is seasonal.)
This aside, I suppose the only thing to do is every category.
edthecynic
Censored for Cynicism
- Oct 20, 2008
- 43,044
- 6,883
- 1,830
So here are the NILF by 16 to 59 and by 60 and over per total NILF and total CPOP. I've kept the scales the same, in terms of range, so that they curves can be eyeballed.
Just for a check, notice that the spread between the two per CPOP curves gets wider toward the end. This is consistent with the ratios to NILF total.
So, what does it tell us, in terms of which is driving the NILF total per capita to get larger and which is a larger contributor to the NILF.
Well, looks like, for the most part, neither is a large driver but, as a percentage of the total NILF, over 60 is getting slightly smaller.
Does this mean that growth in the 60 and older crowd isn't a major contributor to NILF? Not really. After all, 16 to 59 would be much larger then 60 and over, all other things being equal. Own would hope that the two would be obviously different. Really, nothing is jumping out.
All in all, though, they are both increasing as a percentage of the total CPOP. I would expect, lacking any other reason not to, that NILF would be flat with respect to CPOP. Both are increasing, and I wonder why? Does any particular age show more entry into the NILF then others?
What is interesting is that the over 59 crowd does not display the same seasonality that the under 60 crowd does. The under 60 crowd is affected by the seasonality of the work force. (This isn't apparent in the per NILF because the NILF is seasonal.)
This aside, I suppose the only thing to do is every category.
Last edited:
Trajan
conscientia mille testes
And you don't want to discuss my prediction because you know it's true. CON$ made that very point, that Boomers would be retiring in greater numbers than the workforce would grow, when they were pushing the privatization of SS during the Bush Regime. In fact CON$ are STILL making that very same claim today!
Money Matters | When doing the Social Security math, the numbers just don’t add up - KansasCity.com
The Social Security benefits math illustrates the price of failing to address the long anticipated retirement of the baby boom generation. The eldest of those 77 million Americans born between 1946 and 1964 became eligible for Social Security four years ago. The number of retirees in this generation is growing much faster than the people are entering the work force to replace them.
so when someone says hey, I am retiring, and the co. hires a replacement this is not counted as a created job?
I will go ahead and answer it for you; the answer is most certainly YES, a person who was unemployed, is now employed, right? Ergo how could there be some shadow count or indicator that just swaps 60% of retirees with previously unemployed without it being accounted for...*shrugs* there fore your theory on retirees making up a huge proportion of the shrinking LFPR seems/appears to have run out of road.
No, I don't want to discuss it becasue we are not discussing that, you are off on an unrelated tangent.
I want to discuss what we started on, and have been discussing. These sidelines seem to take up the time you could have spent answering my simple question above. Unless you admit straight away you were wrong?Then we can move on.Workers who replace retirees on the job is completely different from retirees causing the LFPR to shrink, and you know it which is why you can't afford to admit that retirees are leaving the workforce faster than new workers entering the workforce because you would then have to admit you are wrong, a mortal sin for CON$!
you are doing it again Ed.
I will not let you drag this away from the topic- unless you admit you cannot sppt. your supposition.... Oh and I have no doubt that there are lots of folks who are retiring, I have never said different, but not to the extent you have vociferously driven;
(like the exchange below)
here, one more time:
Ed;
I was guesstimating that conservatively about 2 out of 3 of the jobs retiring Boomers leave will be filled by replacements and these replacement workers are not filling NEW jobs, the point being that NEW jobs is incomplete as a measurement of the employment situation in the decades of Boomers retiring.
Trajan;
so when someone says hey, I am retiring, and the co. hires a replacement this is not counted as a created job?
I will go ahead and answer it for you; the answer is most certainly YES, a person who was unemployed, is now employed, right? Ergo how could there be some shadow count or indicator that just swaps 60% of retirees with previously unemployed without it being accounted for...*shrugs* there fore your theory on retirees making up a huge proportion of the shrinking LFPR seems/appears to have run out of road.
CON$ have always acknowledged this fact that retirees are leaving the workforce faster than new workers entering the workforce when they rationalize privatizing SS. This fact that retirees are leaving the workforce faster than new workers entering the workforce also causes the LFPR to shrink, but suddenly CON$ conveniently forget what they know regarding SS and then say that the LFPR is declining not because retirees are leaving the workforce faster than new workers entering the workforce but because discouraged workers are giving up trying to find a job even though the number of discouraged workers is actually declining. Facts mean nothing to CON$.
you are getting personal Ed, this CON$ nonsesne has got to go, I noticed you started using it again as your theory became more unwound or unsupportable. I am asking you to stop, please, at least when you respond to me or, I will take it as the uncivil tail twisting it is and respond in kind.
Oh and just as a friendly proviso,you do realize that it is most certainly in the AARP's interest to flog high retiree numbers....
also some reading if you wish to indulge-
introdcution;
http://aging.senate.gov/crs/pension34.pdf

")
Attachments
edthecynic
Censored for Cynicism
- Oct 20, 2008
- 43,044
- 6,883
- 1,830
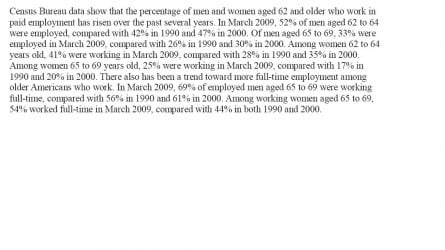
You do realize it is in your interest to marginalize any data that contradicts the CON$ claim that everyone who leaves the workforce is discouraged and has quit looking for work. Your own attachment actually supports the AARP study and then some. AARP said that 54% were retired by age 65 and your attachment has 67% of men and 75% of women no longer working by age 65!!!! So if it was in AARP's interest to "flog high retiree numbers," something you merely pontificate but have not proven BTW, then why are AARP's study numbers lower than the census bureau numbers you cite in your attachment????? Is it more in the interest of the census bureau to flog high retirement numbers than AARP???????so when someone says hey, I am retiring, and the co. hires a replacement this is not counted as a created job?
I will go ahead and answer it for you; the answer is most certainly YES, a person who was unemployed, is now employed, right? Ergo how could there be some shadow count or indicator that just swaps 60% of retirees with previously unemployed without it being accounted for...*shrugs* there fore your theory on retirees making up a huge proportion of the shrinking LFPR seems/appears to have run out of road.
No, I don't want to discuss it becasue we are not discussing that, you are off on an unrelated tangent.
I want to discuss what we started on, and have been discussing. These sidelines seem to take up the time you could have spent answering my simple question above. Unless you admit straight away you were wrong?Then we can move on.
you are doing it again Ed.
I will not let you drag this away from the topic- unless you admit you cannot sppt. your supposition.... Oh and I have no doubt that there are lots of folks who are retiring, I have never said different, but not to the extent you have vociferously driven;
(like the exchange below)
here, one more time:
Ed;
I was guesstimating that conservatively about 2 out of 3 of the jobs retiring Boomers leave will be filled by replacements and these replacement workers are not filling NEW jobs, the point being that NEW jobs is incomplete as a measurement of the employment situation in the decades of Boomers retiring.
Trajan;
so when someone says hey, I am retiring, and the co. hires a replacement this is not counted as a created job?
I will go ahead and answer it for you; the answer is most certainly YES, a person who was unemployed, is now employed, right? Ergo how could there be some shadow count or indicator that just swaps 60% of retirees with previously unemployed without it being accounted for...*shrugs* there fore your theory on retirees making up a huge proportion of the shrinking LFPR seems/appears to have run out of road.
CON$ have always acknowledged this fact that retirees are leaving the workforce faster than new workers entering the workforce when they rationalize privatizing SS. This fact that retirees are leaving the workforce faster than new workers entering the workforce also causes the LFPR to shrink, but suddenly CON$ conveniently forget what they know regarding SS and then say that the LFPR is declining not because retirees are leaving the workforce faster than new workers entering the workforce but because discouraged workers are giving up trying to find a job even though the number of discouraged workers is actually declining. Facts mean nothing to CON$.
you are getting personal Ed, this CON$ nonsesne has got to go, I noticed you started using it again as your theory became more unwound or unsupportable. I am asking you to stop, please, at least when you respond to me or, I will take it as the uncivil tail twisting it is and respond in kind.
Oh and just as a friendly proviso,you do realize that it is most certainly in the AARP's interest to flog high retiree numbers....
also some reading if you wish to indulge-
introdcution;
http://aging.senate.gov/crs/pension34.pdf
And I love how you demand proof from me but you just accept without question the CON$erviNutzi assertion that the LFPR is declining because of an increased number of workers who are discouraged even though I posted links that showed that the number of discouraged workers is declining!!! Retirees are increasing and discouraged workers are declining so by CON$erviNutzi "logic" the LFPR must be going down because of discouraged workers leaving the workforce not retirees leaving the workforce. That you have no problem with! You only seem to have a problem with the number of retirees leaving the workforce, not the number of discouraged workers leaving the workforce.
Brilliant.
Bullshit!I'm rather amused by Ed's contention that it's older workers retiring that is REALLY behind the rather startling numbers of people we're seeing leaving the work force these days.
Couldn't be that the economy is grinding along at about a 2% growth rate and there just aren't jobs to be had STILL after 3 1/2 years of Obama handling the economy...
Couldn't be that we need to be adding 250,000 new jobs a month to keep up with increases in the population and we're not even CLOSE to doing that and haven't for years now...
You keep coming up with those excuses for why it's not Barry's fault though, Ed...it's only about six months to the election. Who cares if the man you support has ZERO plans to fix our problems if he does somehow get re-elected...what's important is getting him another four years...right?
As CON$ have been claiming for the last decade as the rationalization for privatizing SS that, "The number of retirees in this generation is growing much faster than the people are entering the work force to replace them."
Read more here: Money Matters | When doing the Social Security math, the numbers just don’t add up - KansasCity.com
The Social Security benefits math illustrates the price of failing to address the long anticipated retirement of the baby boom generation. The eldest of those 77 million Americans born between 1946 and 1964 became eligible for Social Security four years ago. The number of retirees in this generation is growing much faster than the people are entering the work force to replace them.
And this number suddenly spiked in 2008? Come on, Ed...you know better than that! Yes, more people are retiring but you can't honestly look at the numbers and tell me that you attribute the abrupt growth of people giving up on looking for work to retirees. People give up looking for work when they don't see help wanted ads in the paper or go to a job listing and find lines of hundreds of people competing for a few scant positions. The length of this recession is literally grinding people's resolve down. They've lost jobs...used up their unemployment benefits...burnt through their savings...and now they're desperately searching for ANYTHING in the way of work and the pickings are still abysmal. It's been over 4 years now...things should be getting better. At some point, Barry's policies or lack there of have to take their share of the blame. He made a conscious decision to go after ObamaCare first and then worry about the economy and jobs. Even if the resulting health care reform HAD been a well crafted piece of legislation I would find fault with that decision. That he put jobs on a back burner to give us the legislative fiasco known as ObamaCare simply makes that decision even more of a mistake.
edthecynic
Censored for Cynicism
- Oct 20, 2008
- 43,044
- 6,883
- 1,830
Well you can't attribute it to discouraged workers because their numbers are declining as I posted earlier in this thread.Bullshit!I'm rather amused by Ed's contention that it's older workers retiring that is REALLY behind the rather startling numbers of people we're seeing leaving the work force these days.
Couldn't be that the economy is grinding along at about a 2% growth rate and there just aren't jobs to be had STILL after 3 1/2 years of Obama handling the economy...
Couldn't be that we need to be adding 250,000 new jobs a month to keep up with increases in the population and we're not even CLOSE to doing that and haven't for years now...
You keep coming up with those excuses for why it's not Barry's fault though, Ed...it's only about six months to the election. Who cares if the man you support has ZERO plans to fix our problems if he does somehow get re-elected...what's important is getting him another four years...right?
As CON$ have been claiming for the last decade as the rationalization for privatizing SS that, "The number of retirees in this generation is growing much faster than the people are entering the work force to replace them."
Read more here: Money Matters | When doing the Social Security math, the numbers just don’t add up - KansasCity.com
The Social Security benefits math illustrates the price of failing to address the long anticipated retirement of the baby boom generation. The eldest of those 77 million Americans born between 1946 and 1964 became eligible for Social Security four years ago. The number of retirees in this generation is growing much faster than the people are entering the work force to replace them.
And this number suddenly spiked in 2008? Come on, Ed...you know better than that! Yes, more people are retiring but you can't honestly look at the numbers and tell me that you attribute the abrupt growth of people giving up on looking for work to retirees. People give up looking for work when they don't see help wanted ads in the paper or go to a job listing and find lines of hundreds of people competing for a few scant positions. The length of this recession is literally grinding people's resolve down. They've lost jobs...used up their unemployment benefits...burnt through their savings...and now they're desperately searching for ANYTHING in the way of work and the pickings are still abysmal. It's been over 4 years now...things should be getting better. At some point, Barry's policies or lack there of have to take their share of the blame. He made a conscious decision to go after ObamaCare first and then worry about the economy and jobs. Even if the resulting health care reform HAD been a well crafted piece of legislation I would find fault with that decision. That he put jobs on a back burner to give us the legislative fiasco known as ObamaCare simply makes that decision even more of a mistake.
KissMy
Free Breast Exam
CNN: Boomerang kids: 85% of college grads move home
"Stubbornly high unemployment... has made finding a job nearly impossible"
"Stubbornly high unemployment... has made finding a job nearly impossible"
There are 243 million working age Americans.
There are 142 million employed Americans.
Only 101 million of the employed Americans are working more than 35 hours per week. This means that only 41.6% of all working age Americans have a full-time job.
According to the government drones at the BLS, 88 million Americans have “chosen” to not be in the labor force – the highest level in U.S. history.
The percentage of Americans in the workforce at 63.8% is the lowest since 1980 and down from a peak of 67.1% in 2000. The difference between these two percentages is 8 million Americans.
The BLS reports there are only 12.7 million unemployed Americans in the country, down from 15.3 million in 2009.
The BLS reports the unemployment rate has dropped from 10% in late 2009 to 8.3% today. Over this time frame the working age population grew by 5.7 million, while the number of employed Americans grew by 3.6 million. Only a government drone could interpret this data and report a dramatic decline in the unemployment rate.
http://www.theburningplatform.com/?tag=food-stamps
Last edited:
- Thread starter
- #360
He's said so much shit I don't know anymore.I realize that but did he not say there is 300,000 a month retiring baby boomers?
There is only about 50% of the total on the program over 65
Aged 65 or older 39,605 (million total out 61 million)
Monthly Statistical Snapshot, March 2012
That means there is about 15,000 a week you could call baby boomers
or 70k a month
He has been all over the place, but no where near 10k a day, yet any-way
My issue is and has been the not-in work force # is sky rocketing
150k a month is no where near the 500k we added last month
I gave up trying to follwo the convo along time ago. And it really doesn't matter because we cannot take an average estimate from one survey and subtract it from a monthly statistic of another survey. Doing so is complete bs. As such, the question of what the average is is meaningless. Whatever it is, it can't be used anyways.
I look for answerable questions.
"My issue is and has been the not-in work force # is sky rocketing" is an answerable question.
The simple answer is that it always goes up because population is always growing.
At the very least, we have to normalize for population growth.
Civilian labor force (last 12 months seasonally adjusted)
153,420 153,887 154,395 154,871 154,707 154,365
This number has not grown 500,000, so your about the population in theory should be growing the same
Table A-1. Employment status of the civilian population by sex and age
The not -in has grown by over 2 million same look
The labor force number is the number we use to calculate the UE% rate
Similar threads
- Replies
- 69
- Views
- 2K
- Replies
- 6
- Views
- 149
Latest Discussions
- Replies
- 56
- Views
- 100
Forum List
-
-
-
-
-
Political Satire 8505
-
-
-
-
-
-
-
-
-
-
-
-
-
-
-
-
-
-
-
ObamaCare 781
-
-
-
-
-
-
-
-
-
-
-
Member Usernotes 482
-
-
-
-
-
-
-
-
-
-