Green energy, solar and wind are collapsing....it can't happen fast enough.

Oh yeah? Then why did China "spend $546 billion in 2022 on investments that included solar and wind energy, electric vehicles and batteries.

That is nearly four times the amount of U.S. investments, which totaled $141 billion. The European Union was second to China with $180 billion in clean energy investments."
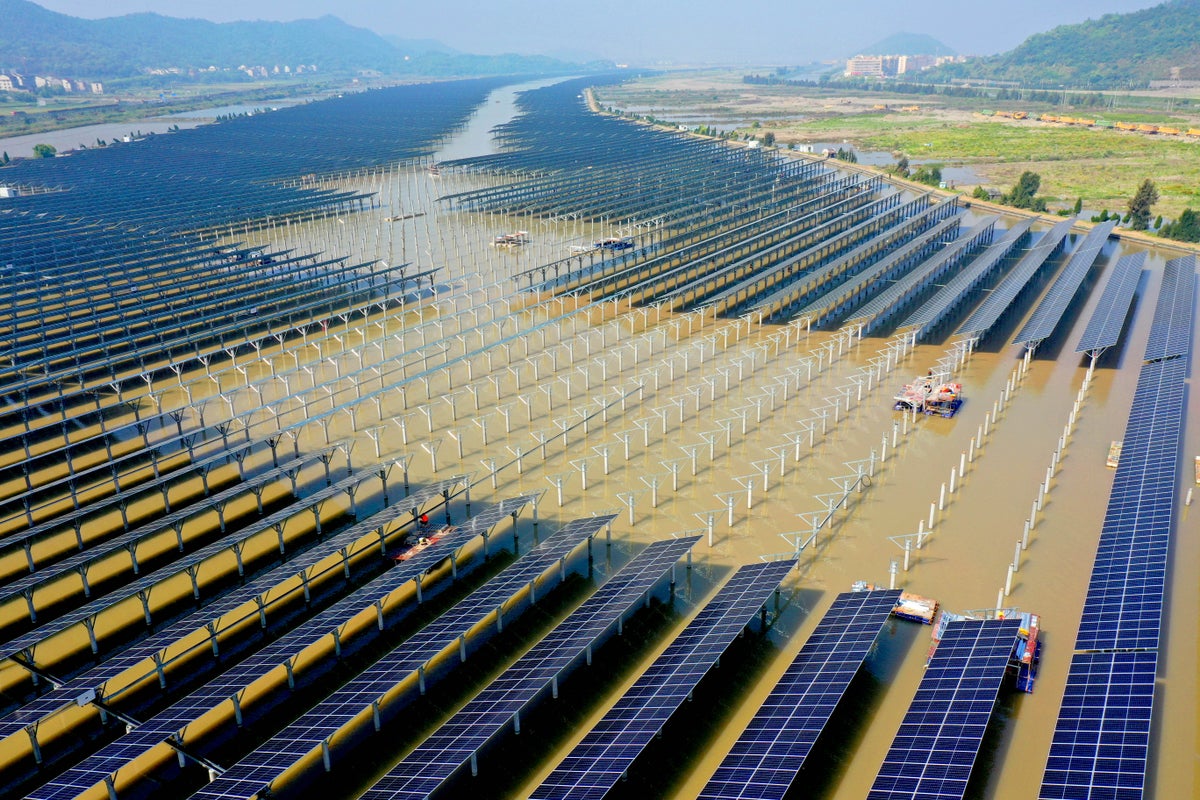
China's EV's are overwhelmingly coal powered, right?
 
China's EV's are overwhelmingly coal powered, right?

1699502818635.png
 
You are first.

Meanwhile there is NO climate Crisis anyway.

LINK

You’ve just lived through Earth’s hottest 12 months on record​

The planet is closer than ever to a 1.5 degree-Celsius warming threshold that could trigger irreversible ecological damage, analysis finds​

imrs.php

By Scott Dance
November 9, 2023 at 6:00 a.m. EST

The Earth just endured its hottest 12 months in the modern era, and probably the hottest in 125,000 years, according to an analysis published Thursday.
That means nearly 3 in 4 people experienced more than a month’s worth of heat so extreme, it would have been unusual in the past, but became at least three times more likely because of human-caused climate change, scientists at Climate Central found.


I do not own a car, and I live in a small apartment. You must make major sacrifices. I want the government to force you to make those sacrifices.

Oh man you have swallowed the bullshit deeply since it was average summer in my area with no record Highs at all.

It was warmer in all the previous warm peaks before this modern warming.

1699590978735.png


Without any demonstrated CO2 involvement.

===

This one shows the long cooling run, that started accelerating over 3,000 years ago.

1699591163067.png


CO2 isn't involved at all.
 

You’ve just lived through Earth’s hottest 12 months on record​

The planet is closer than ever to a 1.5 degree-Celsius warming threshold that could trigger irreversible ecological damage, analysis finds​

imrs.php

By Scott Dance
November 9, 2023 at 6:00 a.m. EST

The Earth just endured its hottest 12 months in the modern era, and probably the hottest in 125,000 years, according to an analysis published Thursday.
That means nearly 3 in 4 people experienced more than a month’s worth of heat so extreme, it would have been unusual in the past, but became at least three times more likely because of human-caused climate change, scientists at Climate Central found.


I do not own a car, and I live in a small apartment. You must make major sacrifices. I want the government to force you to make those sacrifices.


I do not own a car, and I live in a small apartment. You must make major sacrifices. I want the government to force you to make those sacrifices.​


Well, you are a twat.
 
View attachment 856060

Without any demonstrated CO2 involvement.

===
Hey everybody. Look at the right side of this graph just above me. See where the CO2 scale, from 0 to 400 ppm, has been squeezed into 4 minor divisions? Can you guess why the author did that? Why he didn't have the scale cover the full height of his grid like his temperature did on the other side and on every other graph you've ever seen? It was because he didn't want you to see what it was doing. He wanted to FORCE it into a straight line. There are lots of other graphs of temperature and CO2 for this same period and they don't do that and CO2 does not come out as a flat line.

They call that DISHONESTY.


God are you stupid.

BWAHAHAHAHAHAHAHA!!!


Here is a more detailed chart showing the minimal CO2 changes while temperature changed a lot over time.


1699640711149.png


LINK

Antarctica chart in the link showing similar CO2 values.

God you are stupid and ignorant since the GISP2 ice core data covers the small CO2 changes in those 10,000 years which has been well known for years.

Meanwhile the second chart is completely ignored showing that today's temperature is clearly cooler than it was at the Minoan peak.
 
Last edited:
BWAHAHAHAHAHAHAHA!!!


Here is a more detailed chart showing the minimal CO2 changes while temperature changed a lot over time.


View attachment 856328

LINK

Antarctica chart in the link showing similar CO2 values.

God you are stupid and ignorant since the GISP2 ice core data covers the small CO2 changes in those 10,000 years which has been well known for years.

Meanwhile the second chart is completely ignored showing that today's temperature is clearly cooler than it was at the Minoan peak.
The temperatures in the GISP2 cores are LOCAL temperatures and KNOWN to not accurately follow global trends. CO2 levels did NOT take that ruler straight line over the course of the last 10,000 years. Here are better CO2 data covering that same period.

1699641895886.png

 
The temperatures in the GISP2 cores are LOCAL temperatures and KNOWN to not accurately follow global trends. CO2 levels did NOT take that ruler straight line over the course of the last 10,000 years. Here are better CO2 data covering that same period.

View attachment 856331
Polar regions are the regions most affected by climate changes and therefore the best gauge of climate changes. When the planet warms, the polar regions warm the most. When the planet cools the polar regions cool the most. Why don't you know this?
 

You’ve just lived through Earth’s hottest 12 months on record​

The planet is closer than ever to a 1.5 degree-Celsius warming threshold that could trigger irreversible ecological damage, analysis finds​

imrs.php

By Scott Dance
November 9, 2023 at 6:00 a.m. EST

The Earth just endured its hottest 12 months in the modern era, and probably the hottest in 125,000 years, according to an analysis published Thursday.
That means nearly 3 in 4 people experienced more than a month’s worth of heat so extreme, it would have been unusual in the past, but became at least three times more likely because of human-caused climate change, scientists at Climate Central found.


I do not own a car, and I live in a small apartment. You must make major sacrifices. I want the government to force you to make those sacrifices.
Ad you really think that switching to EV's, particularly in areas that generate little solar or wind power, is going to change anything? Or are you really advocating a lockdown?
 
Ad you really think that switching to EV's, particularly in areas that generate little solar or wind power, is going to change anything? Or are you really advocating a lockdown?
I am advocating that we migrate away from the use of fossil fuels.
 

Forum List

Back
Top