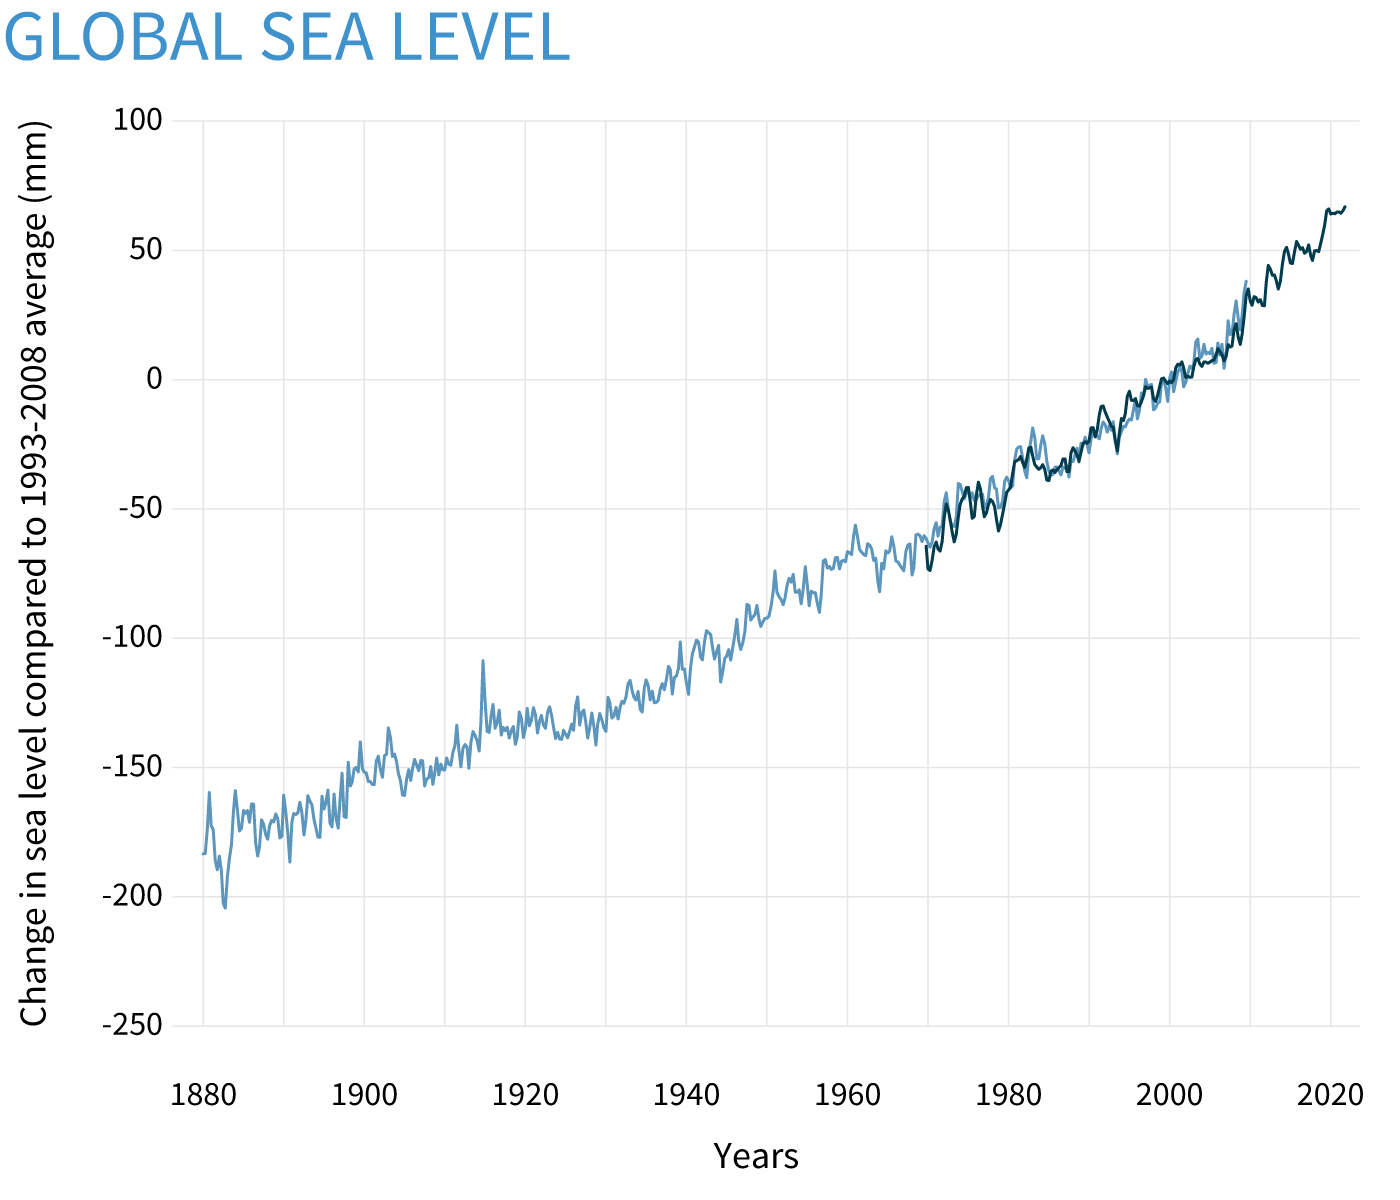
How does the University of Colorado Sea Level Research Laboratory determine global sea level?

Instead of my puncturing? ... that's a little odd but go ahead ... I'm surprised my pooring piss grammering missed you attention, to be honest ...
You note in Greek it is spelled with a kappa which is commonly (but not always) replaced with a "c" when transliterating to English. .
 
The melting of the Arctic is not lowering sea level.

We are seeing land threatened and lost to sea level rise. Dade County, Florida, Venice, Italy, the Maldives, Alaska, Amsterdam, Bangkok and Tokyo are all having to deal with rising seas.

It astounds me how many deniers seem to have missed that really fundamental lesson from Mom, Dad and the rest of the universe that problems are best dealt with early; that procrastination is not a virtue.

You really are trying to make something out of nothing, aren't you?

I didn't say sea levels weren't rising. I understand the difference between satellite data and real human experience.

The point I'm making is that if humans don't experience something, then they're not going to accept science that doesn't seem to be happening.

You can talk about Dade County in Florida, but you didn't provide data as to how different things are from 50 years ago. If you do that, then people might understand.
 
Science is telling you that your cities WILL be underwater. Is that not enough for you to think about doing something?

Science is saying this, and yet the reality isn't... so....


This is saying a 260mm, or 26 cm rise in the level of the seas since 1882.

Do people see that much of a change in coastal areas? And if not, another 26 cm in the next 150 years they might not worry too much.
 
Science is saying this, and yet the reality isn't... so....


This is saying a 260mm, or 26 cm rise in the level of the seas since 1882.

Do people see that much of a change in coastal areas? And if not, another 26 cm in the next 150 years they might not worry too much.
Even on the little thumbnail of that graph, I can see the curvature. Do you understand what that is? That's acceleration.

1724379779272.png

If the rate had not accelerated since that 1900-1930 rate, the total 2015 anomaly on this graph would be 69mm, not 176

If the rate simply stays at 4.4mm/yr, sea level rise anomaly by the year 2100 on this graph will be 550mm. But it's not. If it keeps accelerating as it has since 1900, by 2100 it will be just below 8mm/yr and the sea level anomaly on this graph will be 718mm. Now that assumes no massive ice collapses that could raise sea levels by feet essentially overnight.
 
Even on the little thumbnail of that graph, I can see the curvature. Do you understand what that is? That's acceleration.

View attachment 999831
If the rate had not accelerated since that 1900-1930 rate, the total 2015 anomaly on this graph would be 69mm, not 176

If the rate simply stays at 4.4mm/yr, sea level rise anomaly by the year 2100 on this graph will be 550mm. But it's not. If it keeps accelerating as it has since 1900, by 2100 it will be just below 8mm/yr and the sea level anomaly on this graph will be 718mm. Now that assumes no massive ice collapses that could raise sea levels by feet essentially overnight.

Again, I get it. Again, when science doesn't seem to conform with reality, people will ignore.

That's the way it goes. Politicians don't care, the people don't care. You have to communicate in a way that makes sense. Not by telling people scary stories that look like lies because the reality is something different.
I'm not telling scary stories. I'm telling you what the best science tells us will actually happen if we do not act.
 
Even on the little thumbnail of that graph, I can see the curvature. Do you understand what that is? That's acceleration.

View attachment 999831
If the rate had not accelerated since that 1900-1930 rate, the total 2015 anomaly on this graph would be 69mm, not 176

If the rate simply stays at 4.4mm/yr, sea level rise anomaly by the year 2100 on this graph will be 550mm. But it's not. If it keeps accelerating as it has since 1900, by 2100 it will be just below 8mm/yr and the sea level anomaly on this graph will be 718mm. Now that assumes no massive ice collapses that could raise sea levels by feet essentially overnight.


We are STILL WAITING for ONE SINGLE PHOTO documenting "ocean rise" since all photos show NO OCEAN RISE.
 

Forum List

Back
Top