gslack
Senior Member
- Mar 26, 2010
- 4,527
- 356
- 48

7-21-1979

7-21-1985

7-21-1991

7-21-1998

7-21-2007

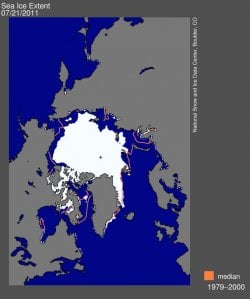
7-19-2011
Anyways on yesterdays map it shows that the area north of Alaska more or less is about 2-3 weeks from melting totally. A narrow path away through the northwest passage could open up within the next week or so and the same is occurring with the northeast.
Hey why is the last picture representing this year a close up and the rest are not? Seriously look at it. Its a different distance than the others why is that? Because if it were to scale you could see its nearly the same ice coverage as a few of the previous years. Dude you are completely fooled by anything they claim aren't you... LOL you don't even check or question anything they say you just post it and think it makes you smart.. LOL
Tool, the ice coverage is up then down then up and down again and your pics show that. The last one being a close up really tells the tale here. Why didn't they keep them all the same range as far as close up or far away? Because to do that would allow for a half way discerning person yo see what they claim and what actually is happening is not the same... What a mindless drone..

 They question through science and use the science to show weakness within the offical thinking of global warming, but you just rage and call people tools.
 You can park as many fucking oil rigs as you wish within the northern pole of this planet. I could care less.