ScienceRocks
Democrat all the way!
- Banned
- #1,321
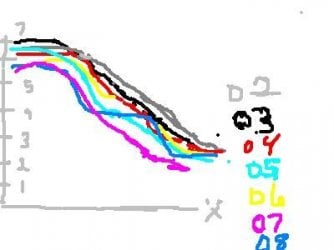
07,23,2011,6908281
-57,344 km^2
07,23,2007,6972031
We're ahead of 2007 by 63,750 km^2 right
We need to have at least 50,156 km^2 tomorrow or we fall below 2007.
690,8281-6858125(7-24)=50,156 km^2
-57,344 km^2
07,23,2007,6972031
We're ahead of 2007 by 63,750 km^2 right
We need to have at least 50,156 km^2 tomorrow or we fall below 2007.
690,8281-6858125(7-24)=50,156 km^2
")