As one can see from the graph, we started, in 1979, with a winter area of 15 million kilometers, and a summer area of 5.5 million kilometers. This years winter high was 13 million kilometers, and the last four years lows have been from 3 to 3.5 million kilometers. That is about a 50% reduction for the summer low.
http://arctic.atmos.uiuc.edu/cryosphere/IMAGES/seaice.area.arctic.png
For the volume, the reduction is even more significant.
Polar Science Center » Arctic Sea Ice Volume Anomaly, version 2
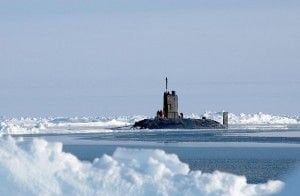
I wonder what the sea ice coverage was in the 1960's when submarines surfaced in open water at the North Pole?