CO2 Has Almost No Effect on Global Temperature, Says Leading Climate Scientist

It has, global temperatures have reached records for several years, sea temperature is rising, sea level rising and increased intensity and frequency of weather extremes. Read MSM in the news every other day.
OMG.... You believe the lying MSM. What are you 12 years old? What was the storm intensity and average in 1900? It was two to three times more often than today.

Source: 1900- Galveston
 
How is an increase from 300ppm to 414 not 33% in 50 years. Explain it to me and why it has increased by this phenomenal amount.

Because you haven't made the case that it is a concern which is why I don't take it seriously and you still continue to promote your same error again since you say 50 years is from 300 to 414 when you were told several times that it is about 111 years' time even gave you the link to support it.

300 ppm in 1909
414 ppm in early 2020

Stop repeating obvious errors!

I haven't disputed that CO2 has increased from 280 ppm to the end year 2020 418.57 ppm level thus your weak strawman has failed.

That link I gave you shows the significant rise 1880 which I haven't disputed thus you have nothing.

It is clear you have no cause for concern.
 
An increase of 30 % in just 50 years has not happened before ever because man has been burning fossil fuels. Fact, not modeling. BTW this from the WPo.

Ha ha ha it has been COOLING for around 7 years now, man you are this unaware of what is going on and you repeated the same error again.

It was last at 300 ppm in 1910 and now 414 ppm in 2020 which is 110 years' time more than double of your stupid 50 years you idiotically repeat.
 
Ha ha ha it has been COOLING for around 7 years now, man you are this unaware of what is going on and you repeated the same error again.

It was last at 300 ppm in 1910 and now 414 ppm in 2020 which is 110 years' time more than double of your stupid 50 years you idiotically repeat.
It is very inconvenient that the rise started PRIOR to the industrial change in earnest around 1930. It was also hotter than it is today. This kid is losing on all fronts..
 
Ha ha ha it has been COOLING for around 7 years now, man you are this unaware of what is going on and you repeated the same error again.

It was last at 300 ppm in 1910 and now 414 ppm in 2020 which is 110 years' time more than double of your stupid 50 years you idiotically repeat.

Earth's human population in 1923 = less than 2 billion ...
Earth's human population in 2023 = greater than 8 billion ...

Global warming is a good thing ...
 
It has, global temperatures have reached records for several years, sea temperature is rising, sea level rising and increased intensity and frequency of weather extremes. Read MSM in the news every other day.

I prefer hard evidence over MSM error filled propaganda.

Climate/weather related deaths plummeted over 100 years' time:

global-climate-deaths-per-mil-mine-square.png

===

Storminess has not gone up, and there’s been no increase in hurricane strength or frequency … no “emergency” there. First, the strength.

maue-ace-2019-1.png


And here is the global hurricane frequency, both for all hurricanes and for the strongest hurricanes.

global-hurricane-frequency-maue-202205.png


The 12 months from April 2021 to May 2022 have seen close to the fewest major hurricanes in more than 40 years.

And there is much longer evidence to back that up. Here are the records of all hurricanes (left) and major hurricanes (right) that came ashore in the US in the last 150 years … NO increase. SOURCE: Nature magazine.

hurricane-strikes.png


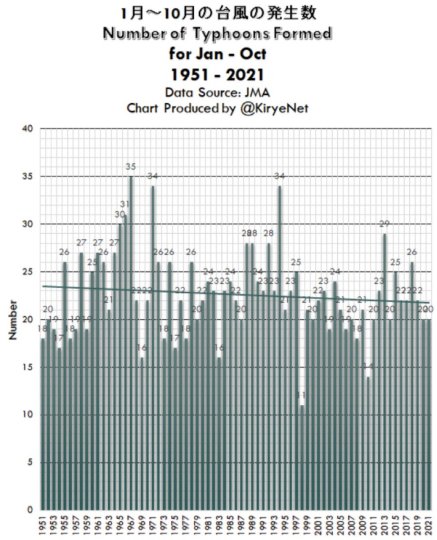
And here are the numbers of Pacific typhoons (hurricanes) from the Japanese Meteorological Agency.

pacific-cyclones.jpg


Here are landfalling typhoons (hurricanes) in China. Like the majority of the world areas, we’re seeing fewer landfalls in China.

china-landfalling-typhoons.png


And here are a century and a half of records of the number of landfalling hurricanes in Florida.

florida-landfalling-hurricanes.png


Finally, here are the declining numbers of both strong and average cyclones in Australian waters, from the Australian Bureau of Meteorology (BOM)

australian-severe-non-cyclones.png


===

Strong tornadoes in the US are decreasing.

strong-to-violent-tornadoes.png


LINK

========

COOLING for about 7 years now

to


LINK

=====

Pause for last 100 months:

image-11.png


The graph shows the least-squares linear-regression trend on the monthly global mean lower-troposphere anomalies. The least-squares method was recommended by Professor Jones of the University of East Anglia as a reasonable method of showing the trend on stochastic temperature data.

Recall that the Pause graph does not constitute a prediction: it simply reports the longest period, working back from the present, during which the temperature trend is not positive.

LINK

and now this latest report:

2022 Global Wide Hurricane Season Ends with Weakest Storm Levels of the Last 42 Years​


and this too,

image-26.png


LINK

Lot more charts in the link destroying the stupid CO2 is the cause of climate crisis bullshit!

You need to catch up to reality.
 
Last edited:
Fixing the ozone layer by banning aquanet and big hair a generation ago is probably why temperatures have crept up.
 
OMG.... You believe the lying MSM. What are you 12 years old? What was the storm intensity and average in 1900? It was two to three times more often than today.

Source: 1900- Galveston
Yeah the same MSM that said Trump is a crook and lost the 2020 election by 7000000 votes. You're going to believe what anything that doesn't make you face reality..
 
MSM doesn't lie it just reports stories you don't like to hear. You right wing are like that.

You are ignoring post 729 which means you are anti science and no counterpoint to offer.

I am Free Thinking INDEPENDENT was a long time Democrat NEVER a Republican thus your bigotry blew up in your face.

Who is paying you to be this stupid and ignorant?
 
I prefer hard evidence over MSM error filled propaganda.

Climate/weather related deaths plummeted over 100 years' time:

global-climate-deaths-per-mil-mine-square.png

===

Storminess has not gone up, and there’s been no increase in hurricane strength or frequency … no “emergency” there. First, the strength.

maue-ace-2019-1.png


And here is the global hurricane frequency, both for all hurricanes and for the strongest hurricanes.

global-hurricane-frequency-maue-202205.png


The 12 months from April 2021 to May 2022 have seen close to the fewest major hurricanes in more than 40 years.

And there is much longer evidence to back that up. Here are the records of all hurricanes (left) and major hurricanes (right) that came ashore in the US in the last 150 years … NO increase. SOURCE: Nature magazine.

hurricane-strikes.png


And here are the numbers of Pacific typhoons (hurricanes) from the Japanese Meteorological Agency.

pacific-cyclones.jpg


Here are landfalling typhoons (hurricanes) in China. Like the majority of the world areas, we’re seeing fewer landfalls in China.

china-landfalling-typhoons.png


And here are a century and a half of records of the number of landfalling hurricanes in Florida.

florida-landfalling-hurricanes.png


Finally, here are the declining numbers of both strong and average cyclones in Australian waters, from the Australian Bureau of Meteorology (BOM)

australian-severe-non-cyclones.png


===

Strong tornadoes in the US are decreasing.

strong-to-violent-tornadoes.png


LINK

========

COOLING for about 7 years now

to


LINK

=====

Pause for last 100 months:

image-11.png


The graph shows the least-squares linear-regression trend on the monthly global mean lower-troposphere anomalies. The least-squares method was recommended by Professor Jones of the University of East Anglia as a reasonable method of showing the trend on stochastic temperature data.

Recall that the Pause graph does not constitute a prediction: it simply reports the longest period, working back from the present, during which the temperature trend is not positive.

LINK

and now this latest report:

2022 Global Wide Hurricane Season Ends with Weakest Storm Levels of the Last 42 Years​


and this too,

image-26.png


LINK

Lot more charts in the link destroying the stupid CO2 is the cause of climate crisis bullshit!

You need to catch up to reality.
Quoting WUW yeah some reality their way "Watts's blog has been criticized for inaccuracy. The Guardian columnist George Monbiot described WUWT as "highly partisan and untrustworthy".[28] Leo Hickman, at The Guardian's Environment Blog, also criticized Watts's blog, stating that Watts "risks polluting his legitimate scepticism about the scientific processes and methodologies underpinning climate science with his accompanying politicised commentary."[29]" wiki
 
You are ignoring post 729 which means you are anti science and no counterpoint to offer.

I am Free Thinking INDEPENDENT was a long time Democrat NEVER a Republican thus your bigotry blew up in your face.

Who is paying you to be this stupid
Another I think for myself type and go to WUW for Watts to tell you what to think. 😂
 

Forum List

Back
Top