More record temps

Chris still posting numbers and colorful pics I see.. LOL Hallowed is the Goracle...
He's proud that he has not stopped despite recent requests for sanity in his threads.

When faced with the facts, the right has only insults.

That's when you know they have lost the argument.

No you lose arguments all the time. You being a partisan hack piece of shit has nothing to do with that.
 
Record Events for Wed Jul 6, 2011 through Tue Jul 12, 2011

High Temperatures: 445
Low Temperatures: 93

HAMweather Climate Center - Record High Temperatures for The Past Week - Continental US View

Dude you just pull up some weather reports and call it proof of climate change. Lets review; weather is what is happening now and in the recent past locally and climate is what has happened over the last several thousand years globally. Got it?:lol:


Weather is in the here and now, but climate is weather over the longer term avg'ed. Weather can be 46f and raining as your dealing with a low pressure area, but climate is the collection of data showing what constitutes what is the overall avg for a place on earth.

What is a place on earth---Lets say Portland Oregon, where I live. The climate of Portland is rainy from Oct-April and drier and warm from May-Sept. That one point with many years of data you can get a picture of the climate. That is climate...Your right in a broad sense about the earth's overall climate of course.

You can have a avg for January here of 46f over the past 30 years. That means some years when you avg the high's up it can be above that and of course below that, but you get a monthly avg of 46f. You can do this for daily or weekly, which within Portland you start out near 42-43f, but then go up to near 48-49f by the last week of the month. You can do this for rainfall to.

You can scale that up to western Oregon or the state of your choice. Eastern Oregon is going to have a hugely different climate then western , because of the rain shallow effect. So the coast range and cascades can get 60-70 inches a year; Portland 36 inches per year; Eastern Oregon 8-12 inches.

So you got time scale
, which can be for what is normal for a day, week, month or even a year over different scales of time. It DOESN"T needs to be thousands of years. Of course you can do that....

Next is the scale you wish to find the climate for. From your back yard over 3-4 years you can start to get a idea(of course this last part is time frame), but you can also get it for your state, nation or of course as you say globally.

Overall global climate changes can happen at scales of thousands of years, as you say, but can happen within dozens of decades like the younger dyes of 8,500 years ago or maybe the warm and cold cycles that we enjoy as a planet like the little ice age or mid evil warm period.
 
Last edited:
Record Events for Wed Jul 6, 2011 through Tue Jul 12, 2011

High Temperatures: 445
Low Temperatures: 93

HAMweather Climate Center - Record High Temperatures for The Past Week - Continental US View

Dude you just pull up some weather reports and call it proof of climate change. Lets review; weather is what is happening now and in the recent past locally and climate is what has happened over the last several thousand years globally. Got it?:lol:


Weather is in the here and now, but climate is weather over the longer term avg'ed. Weather can be 46f and raining as your dealing with a low pressure area, but climate is the collection of data showing what constitutes what is the overall avg for a place on earth.

What is a place on earth---Lets say Portland Oregon, where I live. The climate of Portland is rainy from Oct-April and drier and warm from May-Sept. That one point with many years of data you can get a picture of the climate. That is climate...Your right in a broad sense about the earth's overall climate of course.

You can have a avg for January here of 46f over the past 30 years. That means some years when you avg the high's up it can be above that and of course below that, but you get a monthly avg of 46f. You can do this for daily or weekly, which within Portland you start out near 42-43f, but then go up to near 48-49f by the last week of the month. You can do this for rainfall to.

You can scale that up to western Oregon or the state of your choice. Eastern Oregon is going to have a hugely different climate then western because of the rain shallow effect. So the coast range and cascades can get 60-70 inches a year; Portland 36 inches per year; Eastern Oregon 8-12 inches.

So you got time scale, which can be for what is normal for a day, week, month or even a year over different scales of time. It DOESN"T needs to be thousands of years. Of course you can do that....

Next is the scale you wish to find the climate for. From your back yard over 3-4 years you can start to get a idea(of course this last part is time frame), but you can also get it for your state, nation or of course as you say globally.

Overall global climate changes can happen at scales of thousands of years as you say, but can happen within dozens of decades like the younger dyes of 8,500 years ago or maybe the warm and cold cycles that we enjoy as a planet like the little ice age or mid evil warm period.

Thanks for the clarification on that mathew, but it was really unnecessary. You just took all that time and space to say basically the same thing I said. But then again I see you tried to twist it a bit to help chris. Point still remains he IS posting weather information and calling it evidence of climate change, and that is the bottom line.

I think your weather vs climate lesson would be best utilized on the guy who is posting weather reports and calling it climate change don't you?
 
(CNN) -- Searing temperatures kept a firm grip on more than a handful southern states Thursday as forecasters warned of new areas of excessive heat for the weekend.

The number of states under heat advisories has diminished to seven. At its peak, the heat wave spread from the Plains to the Northeast, covering more than 20 states.

The National Weather Service is forecasting new hot spots in sections of Kansas, Missouri, Oklahoma and Arkansas.

"Warm and moist air in concert with clear skies will allow temperatures to rise about 100 degrees and will allow heat indices to rise above 105 degrees through at least Monday," the weather service said.

Nowhere has the heat been more persistent than Oklahoma.

In Norman, the capital, Chris McBee said he was able to fry an egg on the dashboard of his car, using just the heat of the car's interior, which was 181 degrees.

"I tried it; I didn't think it would work," said McBee. "It's been this hot before. ... I (fried an egg) last year where I just did it on the concrete."

Heat will bake Southern, Midwest states right through the weekend - CNN.com
 
This month was the second warmest June at Grandfather Mountain, falling just short of last year’s record breaking heat.
The average high temperature of 72.6 degrees was 6.1 degrees warmer than normal for June, and the average low temperature of 56.3 degrees was 3.3 degrees above normal for this time of year.Daily high temperature records were broken five times during the month of June and tied one time.

Second-hottest June on record at Grandfather Mountain | The Asheville Citizen-Times | citizen-times.com
 
When one finds a consistent pattern of record breaking heat events and that trend continues over decades, that is a significant bit of data.

Denial of such obvious facts is simply ignorant.

Those data points and trends do not tell us their cause, or their cure, either.

But denying the statsitically obvious is something that only faith based thinkers can take much comfort in.
Chris is posting events from this summer. If you want to establish a trend with just one data point, go for it, but don't expect a standing ovation.
 
Chris still posting numbers and colorful pics I see.. LOL Hallowed is the Goracle...
He's proud that he has not stopped despite recent requests for sanity in his threads.

When faced with the facts, the right has only insults.

That's when you know they have lost the argument.
Constant denial of disagreeing scientific evidence, proof of contamination in your data sets and methods plus the outright rampant fraud and abuse of the 'peer review' process do not count as effective debate methods.

What have you got but bullshit numbers, corollary confused as causation and high assumption based on a religious faith that man is powerful enough to affect the planet's climate when it is clear that this is completely unprovable. Basic 8th grade earth science of atmospheric composition debunks your entire theory.

And yet, you claim that incidental weather events, which you state do not DISPROVE your theory, but can be used to PROVE your faith????

You're a fucking loon, you know it and so do the rest of us. So I guess the question is, how much do you get paid per post to shill? Or is it by word, or hour or are you salary? Not to mention, who pays you?
 
(CNN) -- Searing temperatures kept a firm grip on more than a handful southern states Thursday as forecasters warned of new areas of excessive heat for the weekend.

The number of states under heat advisories has diminished to seven. At its peak, the heat wave spread from the Plains to the Northeast, covering more than 20 states.

The National Weather Service is forecasting new hot spots in sections of Kansas, Missouri, Oklahoma and Arkansas.

"Warm and moist air in concert with clear skies will allow temperatures to rise about 100 degrees and will allow heat indices to rise above 105 degrees through at least Monday," the weather service said.

Nowhere has the heat been more persistent than Oklahoma.

In Norman, the capital, Chris McBee said he was able to fry an egg on the dashboard of his car, using just the heat of the car's interior, which was 181 degrees.

"I tried it; I didn't think it would work," said McBee. "It's been this hot before. ... I (fried an egg) last year where I just did it on the concrete."

Heat will bake Southern, Midwest states right through the weekend - CNN.com

Oh my CNN!.. LOL well then it must be gospel. All hail the goracle.:lol:
 
When one finds a consistent pattern of record breaking heat events and that trend continues over decades, that is a significant bit of data.

Denial of such obvious facts is simply ignorant.

Those data points and trends do not tell us their cause, or their cure, either.

But denying the statsitically obvious is something that only faith based thinkers can take much comfort in.

All of the record heat comes with the sun at its lowest level of activity in 80 years.

Why?
 
NOAA, National Environmental Satellite, Data,

Note: The data presented in this report are preliminary. Ranks and anomalies may change as more complete data are received and processed. Effective May 2, 2011, the GHCN-M version 3 dataset of monthly mean temperature replaced the GHCN-M version 2 monthly mean temperature dataset. Beginning with the April 2011 Global monthly State of the Climate Report, GHCN-M version 3 is used for NCDC climate monitoring activities, including calculation of global land surface temperature anomalies and trends.

The combined global land and ocean average surface temperature for June 2011 was the seventh warmest on record at 16.54°C (60.94°F), which is 0.58°C (1.04°F) above the 20th century average of 15.5°C (59.9°F).

June 2011 was the 316th consecutive month with a global temperature above the 20th century average. The last month with below-average temperature was February 1985.

The June worldwide average land surface temperature was 0.89°C (1.60°F) above the 20th century average of 13.3°C (55.9°F)—the fourth warmest on record.

The global average ocean surface temperature was the 10th warmest June on record, at 0.47°C (0.85°F) above average. Neither El Niño nor La Niña conditions were present during June 2011. According to NOAA's Climate Prediction Center, these ENSO-neutral conditions are expected to continue into the Northern Hemisphere fall 2011.

The first half of 2011 (January–June) was the 11th warmest on record for the combined global land and ocean surface temperature. Separately, the worldwide average ocean temperature was also the 11th warmest January–June and the worldwide average land temperature was the 12th warmest such period.


June Global Hemisphere plot
Land and Ocean tied with 1999 as 12th warmest on record.
 
Last edited:
When one finds a consistent pattern of record breaking heat events and that trend continues over decades, that is a significant bit of data.

Denial of such obvious facts is simply ignorant.

Those data points and trends do not tell us their cause, or their cure, either.

But denying the statsitically obvious is something that only faith based thinkers can take much comfort in.

All of the record heat comes with the sun at its lowest level of activity in 80 years.

Why?

Quick review: The sun's position in our solar system and galaxy relative to other galaxies and their position in the universe, the relative activity of the sun and other nearby radiation emitting stars which may effect our solar system, and various other elements known or as of yet unknown, the amount of cloud cover we receive in various areas of the planet (like over a desert or ocean) can and will effect our own climate far more than a trace gas making up 0.0387% of our atmosphere.

The fact is you are not even touching the tip of the proverbial iceberg when it comes to climate by pointing at CO2 like a hunting dog. Their are so many more things out there that effect our climate you are missing the forest view because the trees are in your way.

You can try and pretend you understand the big picture by posting one small part out of a 100 thousand parts until the planet does cool and we go into an ice age, but it will not make you any more correct or knowledgeable of it.

Now when you start looking at the big picture and stop looking at climate with your blinders on I may treat you algorians a little better, but until then you will get my scorn.

You did not answer the question.

All of the record heat comes with the sun at its lowest level of activity in 80 years.

Why?
 
All of the record heat comes with the sun at its lowest level of activity in 80 years.

Why?

Quick review: The sun's position in our solar system and galaxy relative to other galaxies and their position in the universe, the relative activity of the sun and other nearby radiation emitting stars which may effect our solar system, and various other elements known or as of yet unknown, the amount of cloud cover we receive in various areas of the planet (like over a desert or ocean) can and will effect our own climate far more than a trace gas making up 0.0387% of our atmosphere.

The fact is you are not even touching the tip of the proverbial iceberg when it comes to climate by pointing at CO2 like a hunting dog. Their are so many more things out there that effect our climate you are missing the forest view because the trees are in your way.

You can try and pretend you understand the big picture by posting one small part out of a 100 thousand parts until the planet does cool and we go into an ice age, but it will not make you any more correct or knowledgeable of it.

Now when you start looking at the big picture and stop looking at climate with your blinders on I may treat you algorians a little better, but until then you will get my scorn.

You did not answer the question.

All of the record heat comes with the sun at its lowest level of activity in 80 years.

Why?

If this keeps up it could go from 80 to 150 or more years. :eek:

2r6zabp.jpg
 
I dont think we can be sure about the energy coming from the sun. there are a lot of different wavelengths and our ability to measure them varies. especially before satellites
 
I dont think we can be sure about the energy coming from the sun. there are a lot of different wavelengths and our ability to measure them varies. especially before satellites


We know, because the Holocene climate optimum(Yes part of the warming was caused because of orbit and incline of the earth, but still) , roman warm period, mid evil warm period, little ice age and dalton events where within max's or mins of a solar cycle. From 1860-1950 60 percent of the .4 or so warming up to that time was because of the sun cycle.
 
Remember last winter when people were freezing their asses off in NYC and DC, and when you pointed that out to the GW crowd, they shrugged and said "that's weather, not climate"? :D

Last summer was the coldest I have experienced in 15 years in southern california, I didn't go to the beach a single time, and people were calling it "the year without a summer". This year it has been too cold to do anything up to about the beginning of july. We had a few normal days, now it's back to cold. Is that "climate"?

Oh wait....wait.......I've got it: when it's unusually cold, that's "weather", when it's unusually hot, that's "climate". :lmao:
 
Remember last winter when people were freezing their asses off in NYC and DC, and when you pointed that out to the GW crowd, they shrugged and said "that's weather, not climate"? :D

Last summer was the coldest I have experienced in 15 years in southern California, I didn't go to the beach a single time, and people were calling it "the year without a summer". This year it has been too cold to do anything up to about the beginning of july. We had a few normal days, now it's back to cold. Is that "climate"?

Oh wait....wait.......I've got it: when it's unusually cold, that's "weather", when it's unusually hot, that's "climate". :lmao:


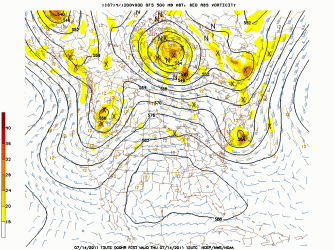
Caused by a death ridge over the midwest at 500 millibars. On each side of a ridge there is normally a "trough" a trough is a dip within the jet stream with the cooler air to the north of the jet stream...So imagine the midwest is within a intense ridge with record hot and dry weather, but the west coast is within the cold and rainy crap. One of the coldest for Portland in the past 70 years so far. :( Lets think about the ridge as divergence at the surface, which pretty much means the air is moving inwards at the upper levels 200-300 millibars, but moving outwards as it moves to 500 to 1013 millibars. What this does is increase the pressure of the column of air and that rises the pressure. This also does the opposite of the air within a area of low pressure. Air within the northern side of the jet stream normally favors low pressure area's and is cooler as said above. Low pressure moves inward and warm moist air raises into the Atmosphere and cools towards its dew point--->this is what we call condensation once it cools to that. Clouds and rainy weather. The air raising from the surface to the 25-40 thousand feet is why a low pressure is called a low pressure, and is why it lowers the pressure as the column of air is now pressing down less pressure onto the surface.

A low pressure of 992 millibars is causing 9,920 bars of pressure on the surface, but a high could cause 1020 millibars or 10,200 bars onto that surface. :tongue: In yes that is a difference of air pressure pressing onto the surface.
Not really so much climate when you think about the day to day, but imagine for a second that the above avg area's are above normal, but cover a larger area of the earth and of course your going to get below normal area's at the same time---the earth is not uniform my friends...It really is how you avg it out is how you get a idea of what changes a change climate may of had. Europe and the east coast last winter was very cold, but the arctic was 10-15c warmer then normal at the same time. Much of northern russia to was warmer if I remember...

Lets look at this in another way...

You have 10,526,000 sq miles of .5c above normal
You have 6,546,456 sq miles at -.5c above normal
Yes this is very simple, but lets say for a second that those two made up the surface area of the earth...You would have a above normal global avg!:eek:

Portland can be colder, but a larger percentage of the United states has been above normal so far this summer season---In I agree it is one of the coldest summers I've seen.

Here is a 500 millibar level map!
 

Attachments

  • $jjjk.gif
    $jjjk.gif
    72.1 KB · Views: 32
Last edited:

Forum List

Back
Top