Onward marches the Great Pause Global temperature update

NCDC%20MaturityDiagramSince20080517.gif


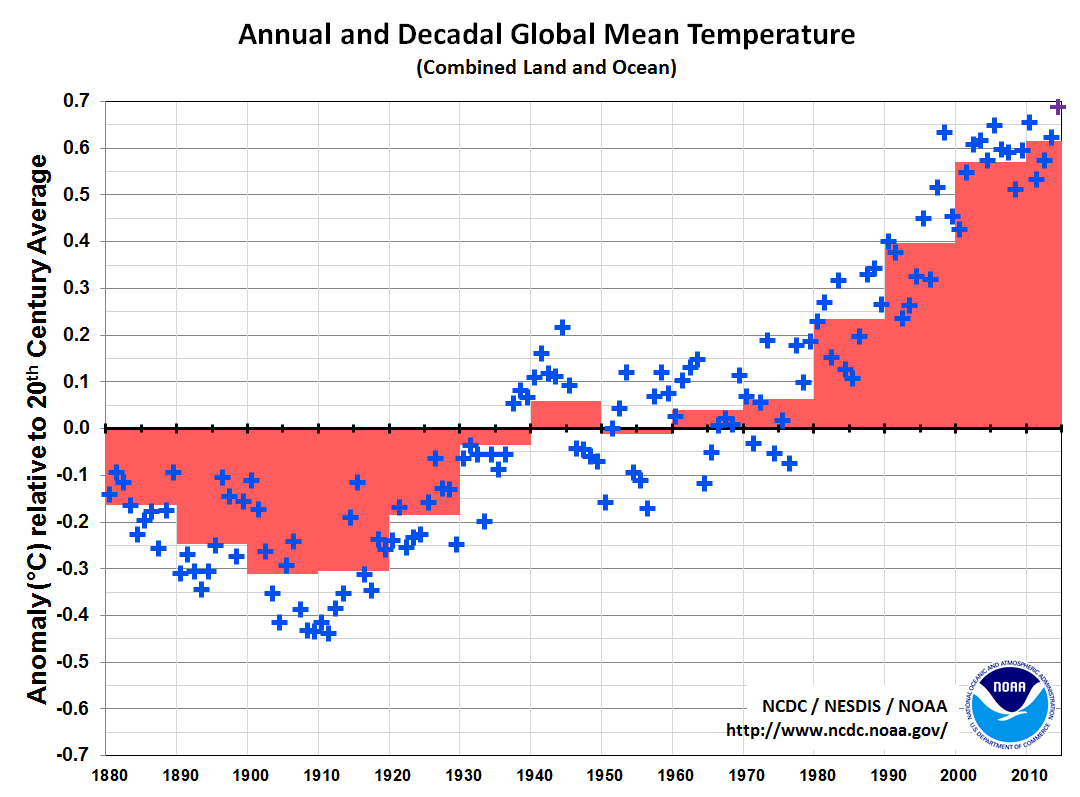
this is a maturity graph of NCDC data from 2008 til the present. this is not actual temperatures, this is the CHANGES to temperature data. Cooling the past, warming the recent. Notice the huge adjustments centered on 1940. Remember.... these are adjustments made in only the last 10 years! The 'corrections' made in the ten years previous to 2008 were even larger but few people were meticulously saving the data back then.

DAleo_Station_Dropout.jpg


hmmmmm.....no way dropping 2/3 of the stations could affect the temps and trends, right?


Right around the year 2000 homogenization adjustments really started to take off. Urban Heat Island Effect adjustments are very close to net zero. Etc, etc.

Unlike Old Rocks I dont like to endlessly repeat myself so I will stop here.
 
Cant wait till they are asked in public...before skeptics with actual power to explain and justify all these "adjustments" that cool temperatures from a hundred years ago and more in an effort to make the present appear warmer...
 
So the "Excess Heat" both stays in the atmosphere AND heats the Antarctic Ocean at a depth of 800m.

This new learning amazes me
Have you ever noticed that the magical heat is ALWAYS somewhere that it can not easily be refuted because our ability to see it empirically is nonexistent.?
 
RSS data is upper atmosphere. It is NOT the global temperature. The global temperature has done this:

decadal-avgs.png


giss-250-60-60-vs-h3-gl.png
RSS data is 0-150 feet above ground and depending on what channel you use upwards of 60,000 feet. The OP clearly used ground level data.

Funny you would use the highly adjusted data sets... and ignore the data near ground... not surprising however....

From Wikipedia on RSS

Remote Sensing Systems (RSS) is a private research company founded in 1974 by Frank Wentz. It processes microwave data from a variety of NASA satellites. Most of their research is supported by the Earth Science Enterprise program. The company is based in Santa Rosa, California.

They are a widely cited source of data, on the satellite temperature record. Their data is one source of evidence for global warming. Research by Carl Mears, Matthias Schabel, and Wentz, all of RSS, highlighted errors in the early satellite temperature records complied by John Christy and Roy Spencer at UAH. The UAH data had previously showed no significant temperature trend, bringing the derived satellite data into closer agreement with surface temperature trends, radiosonde data and computer models.[1] The UAH data is now closer to the RSS data but differences remain, for example the Lower Troposphere global average trend since 1979, RSS currently have +0.133K/decade while UAH have 0.140K/decade, while the mid troposphere difference is even more marked at 0.079K/decade and 0.052K/decade respectively.[2][3] However, in a recent online YouTube video, Dr. Carl Mears, a senior scientist with the team behind the satellite data, explained how he believes his data set needed correction.[4]

I would have to say that the surface data seems that it’s more accurate, because a number of groups analyze the surface data, including some who set out to prove the other ones wrong, and they all get more or less the same answer.

References
  1. Andrew Revkin (November 18, 2003). "New View of Data Supports Human Link to Global Warming". New York Times. Retrieved November 6, 2009.
  2. "RSS / MSU and AMSU Data / Description". Retrieved 26 February 2011.
  3. "MONTHLY MEANS OF LOWER TROPOSPHERE LT5.4". UAH. Retrieved 26 February 2011.
  4. Ronson, J. Ted Cruz Gets His Comeuppance for Cherry-Picked Climate Change Data:A better understanding of the scientific method might have saved him the embarrassment. Inverse. March 3, 2016. Accessed March 4, 2016
Effects of orbital decay on satellite-derived lower-tropospheric temperature trends : Abstract : Nature Wentz, Frank J., and Matthias C. Schabel. "Effects of orbital decay on satellite-derived lower-tropospheric temperature trends." Nature 394.6694 (1998): 661-664. Precise climate monitoring using complementary satellite data sets : Abstract : Nature Wentz, Frank J., and Matthias C. Schabel. "Precise climate monitoring using complementary satellite data sets." Nature 403.6768 (2000): 414-416.
**********************************************************************************
So
1) Show us where it is stated that the data you presented come from the surface.
2) Explain why the people producing those data say they have a positive trend.

The data set used, as noted by the authors, identifies the channel from which the data came. IN this case it is the channel used for the surface..

Carl Et Al... LOL Adjustment to meet agenda...
 
It's your post, your source, your link, your claim: your responsibility
 
hmmmmm.....no way dropping 2/3 of the stations could affect the temps and trends, right?

So, more of your unsupported paranoid conspiracy nonsense.

Given that all the data says how you've been totally wrong for many years, I suppose you don't have a choice. Emotionally, you're not willing to admit how you let yourself get hoodwinked, so making these conspiracy theories is the only other option open to you.
 
Can't wait for the Congressional hearings when AGW meets actual science and has to account for: altered data, flawed models, intimidation of skeptics, and not one single repeatable lab experiment demonstrating the W in agw
 
And who do you think will be representing what YOU believe to be actual science Frank.
 
It's your post, your source, your link, your claim: your responsibility
I've been posting it frequently dipstick.

Are you claiming that the Arctic climate is now 32F warmer than normal?
Hey Frankie boi, what's with the new avatar? Finally come out of the closet? Shall we now call you Comrade Frankie boi?

Like Lafayette before him, Uncle Vlad saved the Republic from the forces of evil.
 
And who do you think will be representing what YOU believe to be actual science Frank.

Pee Wee Hermann could ask, "on what basis are you adjusting 50 year old data?" and leave the AGWists without a ready answer
 
hmmmmm.....no way dropping 2/3 of the stations could affect the temps and trends, right?

So, more of your unsupported paranoid conspiracy nonsense.

Given that all the data says how you've been totally wrong for many years, I suppose you don't have a choice. Emotionally, you're not willing to admit how you let yourself get hoodwinked, so making these conspiracy theories is the only other option open to you.

I see only one side posting their data...where's yours?


Sent from my iPhone using USMessageBoard.com
 
It's your post, your source, your link, your claim: your responsibility
I've been posting it frequently dipstick.

Are you claiming that the Arctic climate is now 32F warmer than normal?

My claim is that NOAA and Hadley and JAXA can all tell the temperature in the Arctic and that it has recently been exceptionally warm there. We are in midwinter and the current temperature is near 32F.

Instead of telling us how you've posted statements of satellite malfunctions, show us one.
 
I just did a Google search on the following phrase and got the following results. Note the dates Frank.

SATELLITE MALFUNCTION, ARCTIC TEMPERATURE

About 342,000 results (0.80 seconds)


Search Results
Sensor on F-17 experiencing difficulties, sea ice time series ...
nsidc.org/arcticseaicenews/.../sensor-on-f-17-experiencing-difficulties-sea-ice-time-ser...
Apr 12, 2016 - ... notice, due to issues with the satellite data used to produce these images. ... F-17satellite that provides passive microwave brightness temperatures is ... NSIDC scientists provide ArcticSea Ice News & Analysis, with partial ...
Satellite measurements of warming in the troposphere
Global Warming and Climate Change skepticism examinedsatellite-measurements-warming-troposphere.htm
Satellite measurements match model results apart from in the tropics. ... The microwave sensors on thesatellites do not directly measure temperature ..... Clearly RSS has some additional problems, as UAH and the surface temperature data sets .... bar chart, what stands out is the huge reduction in Arctic temperature trends.
How accurate are satellite measured temperatures of the troposphere?
www.accuweather.com/en/weather-blogs/climatechange/some-of-the.../54879902
Jan 19, 2016 - Africa; Antarctica; Arctic; Asia; Central America; Europe; Middle East; North America; Oceania; South America ... The two main sources for this satellite measured temperature data is ...Satellite drift can also cause problems.
More satellite problems with Arctic Sea Ice measurement | Watts Up ...
https://wattsupwiththat.com/.../more-satellite-problems-with-arctic-sea-ice-measureme...
Apr 11, 2016 - More satellite problems with Arctic Sea Ice measurement ... Headlines: What ClimateAlarmists Write Versus What the Rest of Us See.
Scientists scrambling to track Arctic sea ice after key satellite sensor dies
mashable.com/2016/05/03/arctic-ice-satellite-outage/
May 3, 2016 - A Defense Department satellite malfunction has temporarily halted Arctic ... The satellitetroubles come at a crucial time for the Arctic climate.
Satellite temperature measurements - Wikipedia
https://en.wikipedia.org/wiki/Satellite_temperature_measurements
The temperature of the atmosphere at various altitudes as well as sea and land surface ... Since 1978 microwave sounding units (MSUs) on National Oceanic and Atmospheric Administration polar orbitingsatellites have measured the .... The problems with the length of the MSU record is shown by the adjacent table, which ...
[PDF]ARCTIC SURFACE TEMPERATURE: A COMPARISON AMONG ...
https://ams.confex.com/ams/pdfpapers/20107.pdf
by Y Chen - ‎Related articles
temperature from satellites under polar conditions owing to problems such as cloud detection, view angle effects, atmospheric temperature inversions, and large ...
Satellite Problems With Arctic Sea Ice Measurement | The Great White ...
greatwhitecon.info/2016/04/satellite-problems-with-arctic-sea-ice-measurement/
Apr 11, 2016 - Satellite Problems With Arctic Sea Ice Measurement ..... F16 satellite brightnesstemperatures from our data providers and then implementing ...
Measuring global temperatures: Satellites or thermometers? - cfact
https://www.cfact.org/2016/.../measuring-global-temperatures-satellites-or-thermomet...
Jan 26, 2016 - The official global temperature numbers are in, and NOAA and NASA have ... involve an entirely new set of problems, with rather sparse sampling by a mixture .... They don't live in polar regions either, please make your point.
Clouds and Sea Ice: What Satellites Show About Arctic Climate Change
https://www.nasa.gov/.../clouds-and-sea-ice-what-satellites-show-about-arctic-climate-...
Jun 3, 2016 - Clouds and Sea Ice: What Satellites Show About Arctic Climate Change ...... can cause
 
I see only one side posting their data...where's yours?

It's been posted many times before, and declared by deniers to be a conspiracy theory every single time. That's how it works with deniers and data that contradicts them, which is all the data, which is why they keep declaring how everything is part of a socialist conspiracy plot.

But since you asked, here's a comparison of raw vs. adjusted data. Given that they're basically identical, it's insane to pretend that warming is due to data corrections.

GHCN_RawvAdj.jpg


And if you're interested in a beginner's guide to the science of getting a global temperature average, several bloggers have some good tutorial kind of things.

https://archive.is/ATAIL

Tales from the Thermometer « Open Mind

Best Estimates « Open Mind

<data:blog.pageTitle/>

moyhu: The necessity of TOBS

http://rankexploits.com/musings/2014/how-not-to-calculate-temperature/

http://rankexploits.com/musings/2014/how-not-to-calculate-temperatures-part-2/

http://rankexploits.com/musings/2014/how-not-to-calculate-temperatures-part-3/
 
Last edited:
It's your post, your source, your link, your claim: your responsibility
I've been posting it frequently dipstick.

Are you claiming that the Arctic climate is now 32F warmer than normal?

My claim is that NOAA and Hadley and JAXA can all tell the temperature in the Arctic and that it has recently been exceptionally warm there. We are in midwinter and the current temperature is near 32F.

Instead of telling us how you've posted statements of satellite malfunctions, show us one.

Arctic Weather Map

Here's another public service from the Mexican Climate poster, doing the work the weather "Scientists" refuse to do for themselves.

Here's today's Arctic temperatures

Eureka Airport -27F
Thule Air Base -18F
SHIP2051 1F
Batsfjord Airport 32F (Heatwave)
 

Forum List

Back
Top