Wild Bill Kelsoe
Diamond Member
- Jan 21, 2021
- 8,218
- 7,431
- 1,938
Which is why it was stupid to shutdown Keystone XL.Because much of the world got oil from Russia and oil is a global commodity.
How can you not know this?
Follow along with the video below to see how to install our site as a web app on your home screen.
Note: This feature may not be available in some browsers.
Which is why it was stupid to shutdown Keystone XL.Because much of the world got oil from Russia and oil is a global commodity.
How can you not know this?
Don't know if you realize it, but you are simply pushing Russian Federation propaganda.They won’t get weaker in part because of our infatuation with climate change and our dependency on oil and natural gas, which Russia supplies. Germany, for example, tries to embrace climate change all the while enriching Russia by buying their natural gas and oil. There won’t be a long game, only a short game, and Russia will win.
Which is why it was stupid to shutdown Keystone XL.
/-----/ When you can't refute the message, attack the messenger. Saul Alinsky would be proud of you. Your clown can't even keep the countries straight.Stop pretending you care this happened. You just look for any reason to whine about Biden.
------------------------------------------------------------------------------------------
How representative of Republicans, Conservatives, and MAGAHats is poster Flash?
I think there is an argument that he is quite representative. Perhaps, it is a matter of degree, but he does
seem a tad racists, bigoted, homophobic.
At least he seems that way to my avatar. IMHO
Now, is his rhetoric and thinking a fitting avatar for MAGAHats?
I can see an argument by someone that he is perfect for that role.
But I'll let the forum judge poster Flash's suitability as a spokesman of Conservative thinking.
At this point he certainly seems as the favored definer and articulator of what Conservatives want in our legitimate political discourse.
The Yooks are ready to do the fighting. We need to support them with beans and bullets.You want to send your kids to fight in Ukraine? No thanks.
Construction was shut down. But, whatever, XL isn't pumping the 830,000 bbl that it could be.It is not shut down. An additional part they wanted to add to an existing pipeline was stopped, but since it was never up and running one cannot say it was shut down.
Who gives a shit? Putin has already threatened nuclear war.
Yes it does, you must have skipped that day. Hope they dont pay you to make graphs.A graph does not need to start at zero, if you took stats 101 you would know this. I do this for a living.
Yes it does, you must have skipped that day. Hope they dont pay you to make graphs.

 stats.stackexchange.com
A tad? Really??
So what are you? A Moon Bat, Queer, Negro or Illegal?
A graph with no zero is very deceptive, and that is usually intentionally. Should All Graphs Start at 0? – MeasuringU
Something like this...the yellow dot is Feb of 2021. Is production up or down since then?
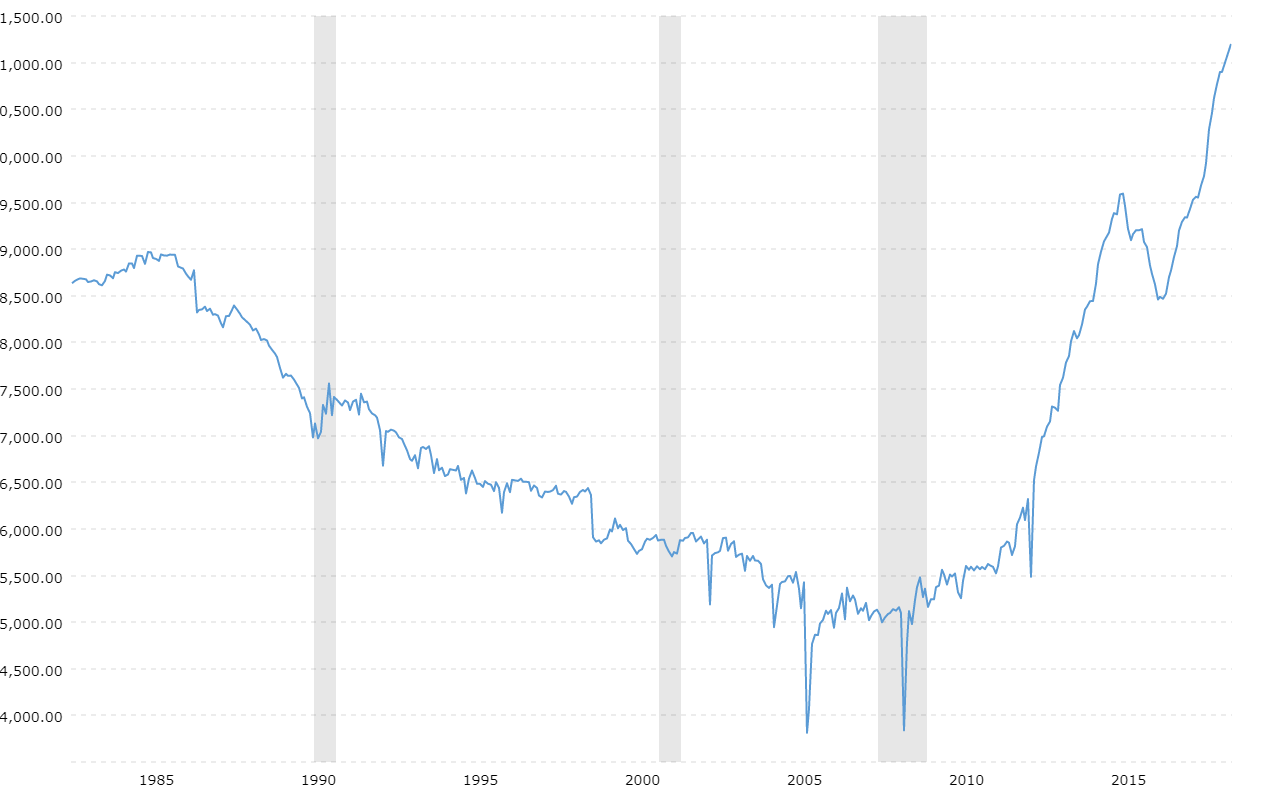
U.S. Crude Oil Production - Historical Chart
Interactive historical chart showing the monthly level of U.S. crude oil production back to 1983 from the US Energy Information Adminstration (EIA). Values shown are in thousands of barrels produced per day.www.macrotrends.net
View attachment 609574
Thinking for yourself is not your forte’. You need to be spoon fed information by an opinionated ”journalist”. What are you challenging? Biden didn’t remove sanctions on Nord Stream? Russia will not profit from Nord Stream? Germany is not dependent on Russia for energy? The US doesn’t import about 10% of oil from Russia? Start googling.
If Russia wins they will continue to be a bully ...
A graph with no zero is very deceptive, and that is usually intentionally. Should All Graphs Start at 0? – MeasuringU
To show or not show 0
Is it deceptive or even dishonest to not show the zero on a graph? The famous book, “How to Lie with Statistics” has for generations (it was originally published in 1954) helped people detect deception with statistics and graphics. The book by Darrell Huff is full of great advice for understanding how to make sense of the constant barrage of data and graphs we see every day.
One thing it mentions is to be wary of graphs that don’t start the y-axis at 0. Something you’ll quickly find echoed from other online sources.
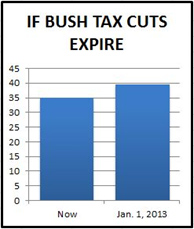
What’s interesting about both graphics above is that they display roughly similar increases. The tax graph is an increase in tax rates of 13% [(39.5-35)/35 = .129] and the carbon dioxide displays an increase of roughly 16% from 1900 to 2000 [(335-290)/290 = .1552].
The website from which I pulled the graphic states that a better graph would have shown something like the following:
Go enlist then if you want to fight.He doesn't have the balls to send troops to Ukraine. Boots on the ground is how you win wars. Bush/Cheney understood that.
The XL would have moved an additional 830,000 bbl a day. Instead, Biden doubled Russian imports.
Which is why it was stupid to shutdown Keystone XL.
