Scientists are floored by what’s happening in the Arctic right now

Of course, sea ice is not just frozen sea water, it freezes only when diluted by snow falling on it. This fresh-water input dilutes the surface layer, which allows that small layer to freeze, then snow is piled on top, building 'sea-ice'. The warming climate (more evaporation) means more water vapor in the air is eventually falling as snow in the Arctic, where, even on a winter's day (night, actually, they have a very long night up there...) that is very 'warm', it is still cold enough to snow.
And still, the ice is retreating, regardless of the fools who can't believe it.
Remember your history? Many good men lost their lives trying to crack the North-West Passage, now tankers cruise through without the need of ice-proof hulls.
northeastern+passage.jpg

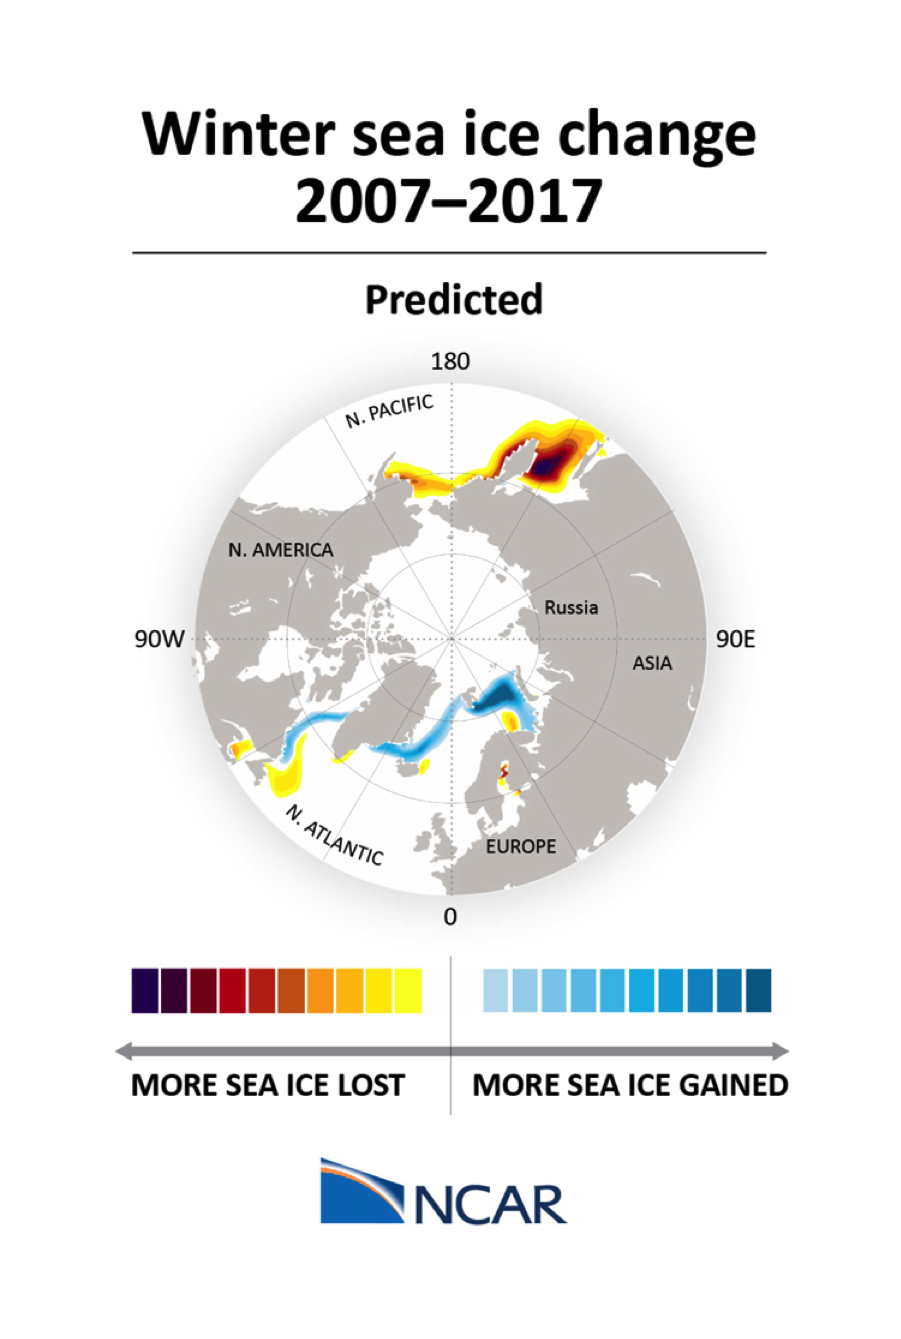
Another factor in this ice question is the runaway melting of the perma-frost in Siberia. This delivers huge inputs of fresh water to the Arctic Ocean, and it flushes the ice out as Summer progresses.
This is almost certainly one of the factors causing the variations in ocean circulation alluded to by Elektra, above
Excuse me, Mr. Teacher, I have not alluded to a thing. I have directly followed the links given by the OP, quoted by all the Global Warming Alarmists, and pointed out that the

Science is stating the Ice is growing and will continue to grow.

According to the OP, according to the references and the science that this thread is based on.
 
You LIAR. I went through this entire thread. You have not posted any links to anywhere in any post of yours in this thread.
I already replied once to Crick, but Crick needs to get hit in the head twice by this, my link came from the OP, mattpew's!

After that I post
It's not supposed to be melting. It's supposed to be freezing. The problem is that it isn't freezing as fast as it ought to be because it's not COLD enough.

N_stddev_timeseries.png
Hey, crack, your picture is in my link, how come, you post a pic from my link and then like a complete moron claim that I am a liar, when my link is from the OP, and at that you are using a pic from my link, which was in the link/story/pic crack uses.

Scientists are floored by what’s happening in the Arctic right now
Arctic Sea Ice News and Analysis | Sea ice data updated daily with one-day lag

I posted a picture I obtained from www.nsidc.org. It is not your picture. You cannot use links provided by others (as in Matthew's OP) to back a claim that YOU have posted such links.
 
Yet another perfect example of how the Right lies.

Your link dishonestly uses two DIFFERENT standards when comparing 2015 to 1997. For 1997 they use the 30 year average standard of 1961 to 1990 to get their average temperature, but the dishonest lying scum you sourced use the 100 year 20th century average standard for the 2015 average temperature, even though the same 100 year 20th century average standard for 1997 had already been published BEFORE the time your source published their lies.

From your dishonest link:

In that 1997 report, they say clearly that the Global Average Temperature (GAT) was 62.45°F, based on a 30-year average (1961-1990) of the combined land and sea surface temperatures.

During 2015, the average temperature across global land and ocean surfaces was 1.62°F (0.90°C) above the 20th century average.

It was blogger Wattsupwiththat who first noticed and explained the funky math. He explains that the recent report compares 2015 to the 20th century average - but, doesn't mention what that average temperature was.

However, it does give a 20th Century average in its November 2015 State of the Climate Report: - 13.9 degrees Celsius (57 degrees Fahrenheit):

Global Analysis - Annual 2015 | National Centers for Environmental Information (NCEI)

The annual temperature anomalies for 1997 and 1998 were 0.51°C (0.92°F) and 0.63°C (1.13°F), respectively, above the 20th century average
 
Last edited:
fudging data has already been pointed out in this forum, do a search and I'm sure you'll find that piece on both the NOAA and NASA.
Yeah, posted by the same idiots who now claim NOOA butchered the math. :cuckoo:
 
Yet another perfect example of how the Right lies.

Your link dishonestly uses two DIFFERENT standards when comparing 2015 to 1997. For 1997 they use the 30 year average standard of 1961 to 1990 to get their average temperature, but the dishonest lying scum you sourced use the 100 year 20th century average standard for the 2015 average temperature, even though the same 100 year 20th century average standard had already been published BEFORE the time your source published their lies.

From your dishonest link:

In that 1997 report, they say clearly that the Global Average Temperature (GAT) was 62.45°F, based on a 30-year average (1961-1990) of the combined land and sea surface temperatures.

During 2015, the average temperature across global land and ocean surfaces was 1.62°F (0.90°C) above the 20th century average.

Global Analysis - Annual 2015 | National Centers for Environmental Information (NCEI)

The annual temperature anomalies for 1997 and 1998 were 0.51°C (0.92°F) and 0.63°C (1.13°F), respectively, above the 20th century average

Yawn....you're a bother and duped

How is HE duped? From the facts presented here, it is YOU that have been duped.
 
Last edited:
I am not posting here to debate with maMOOT
No surprise there, as you never debate with anyone. You just make incorrect claims and then have a meltdown when the flaws in your claims get pointed out.

In this case, your incorrect claim was that NASA predicted more Arctic sea ice. Let's go over why that was wrong.

Predicting decadal trends in Arctic winter sea ice cover

Figure 4. The map shows areas of the Arctic where sea ice models predicted ice gain and loss for 2007 to 2017

There's more yellow than blue there. Hence, that's a prediction of a net loss.

Observations show an increase in the rate of winter sea ice loss in the North Atlantic sector of the Arctic up until the late 1990s followed by a slowdown in more recent years. The observed trend over the period 2005 to 2015 is actually positive (a tendency for more ice).

The key phrase there being "North Atlantic". The North Atlantic is just one portion of the Arctic. Ice loss in other portions is bigger, hence the net effect is a decrease.

So, the problem there was your blunder of assuming the North Atlantic represented the entire Arctic.

Oh, you're welcome.


seems to be a chronic problem with them

maybe common core is to blame

--LOL
Another SUCKER taken in by the same easily exposed lie.


you are being a little to hard on yourself ed

--LOL
 
If you have nothing to actually add to this discussion - and it certainly appears that you do not - then why don't you do all of us a huge favor and just fuck off.
How can scientists be floored if there's consensus? BTW, how cold does it have to be to make ice? What station are you using to even know if it is or isn't? Don't tell me to get the fk out of anywhere you prick
 
Everybody take a deep breath, remember that your cushions can be used as flotation devices in an emergency and - get back on topic please.
 
The original predictions from 1981 were for the Northwest Passage to open somewhere near the end of this century. And, maybe, by the end of the century see a time when the Arctic sea ice was gone for a time in September. The Northwest Passage opened for the first time in 2007. And now we see the three record years in a row for high temperatures, and the ice may have peaked already for this year.
 
Scientists are floored by what’s happening in the Arctic right now

Source: Washington Post
New data from NASA and the National Oceanic and Atmospheric Administration suggest that January of 2016 was, for the globe, a truly extraordinary month. Coming off the hottest year ever recorded (2015), January saw the greatest departure from average of any month on record, according to data provided by NASA.

But as you can see in the NASA figure above, the record breaking heat wasn’t uniformly distributed — it was particularly pronounced at the top of the world, showing temperature anomalies above 4 degrees Celsius (7.2 degrees Fahrenheit) higher than the 1951 to 1980 average in this region.

Indeed, NASA provides a “zonal mean” version of the temperature map above, which shows how the temperature departures from average change based on one’s latitude location on the Earth. As you can see, things get especially warm, relative to what the Earth is used to, as you enter the very high latitudes:


Read more: Scientists are floored by what’s happening in the Arctic right now

But hey, it aint happening as it is all made up and so we should go pray to jesus christ!!! Read our 2,000 year old book and sing how god makes sure this never happens. lol

Interesting that so many scientists "are FLOORED by this".. A lot of information is LOST when you consolidate all that Global data into ONE yearly average. And at 1st glance it might sound REALLY REALLY menacing that the Arctic as a zone is so much higher than the rest of the globe.

But in truth -- I'm CERTAIN this is more propaganda from NASA/NOAA. And they are selecting some "anomalies" for some months in SOME localities and the GENERAL Arctic trend is NOWHERE near this hysteria.

They've lost their marbles....

70-90N%20MonthlyAnomaly%20Since1957.gif


They are referring to some SINGLE months where peak anomalies are TRULY not even much greater than what was seen in the 1950s..

Where's the BEEF?
 
Scientists are floored by what’s happening in the Arctic right now

Source: Washington Post
New data from NASA and the National Oceanic and Atmospheric Administration suggest that January of 2016 was, for the globe, a truly extraordinary month. Coming off the hottest year ever recorded (2015), January saw the greatest departure from average of any month on record, according to data provided by NASA.

But as you can see in the NASA figure above, the record breaking heat wasn’t uniformly distributed — it was particularly pronounced at the top of the world, showing temperature anomalies above 4 degrees Celsius (7.2 degrees Fahrenheit) higher than the 1951 to 1980 average in this region.

Indeed, NASA provides a “zonal mean” version of the temperature map above, which shows how the temperature departures from average change based on one’s latitude location on the Earth. As you can see, things get especially warm, relative to what the Earth is used to, as you enter the very high latitudes:


Read more: Scientists are floored by what’s happening in the Arctic right now

But hey, it aint happening as it is all made up and so we should go pray to jesus christ!!! Read our 2,000 year old book and sing how god makes sure this never happens. lol
Great news. Call me when palm trees and crocodiles return to Alaska.
 
Scientists are floored by what’s happening in the Arctic right now

Source: Washington Post
New data from NASA and the National Oceanic and Atmospheric Administration suggest that January of 2016 was, for the globe, a truly extraordinary month. Coming off the hottest year ever recorded (2015), January saw the greatest departure from average of any month on record, according to data provided by NASA.

But as you can see in the NASA figure above, the record breaking heat wasn’t uniformly distributed — it was particularly pronounced at the top of the world, showing temperature anomalies above 4 degrees Celsius (7.2 degrees Fahrenheit) higher than the 1951 to 1980 average in this region.

Indeed, NASA provides a “zonal mean” version of the temperature map above, which shows how the temperature departures from average change based on one’s latitude location on the Earth. As you can see, things get especially warm, relative to what the Earth is used to, as you enter the very high latitudes:


Read more: Scientists are floored by what’s happening in the Arctic right now

But hey, it aint happening as it is all made up and so we should go pray to jesus christ!!! Read our 2,000 year old book and sing how god makes sure this never happens. lol

Interesting that so many scientists "are FLOORED by this".. A lot of information is LOST when you consolidate all that Global data into ONE yearly average. And at 1st glance it might sound REALLY REALLY menacing that the Arctic as a zone is so much higher than the rest of the globe.

But in truth -- I'm CERTAIN this is more propaganda from NASA/NOAA. And they are selecting some "anomalies" for some months in SOME localities and the GENERAL Arctic trend is NOWHERE near this hysteria.

They've lost their marbles....

70-90N%20MonthlyAnomaly%20Since1957.gif


They are referring to some SINGLE months where peak anomalies are TRULY not even much greater than what was seen in the 1950s..

Where's the BEEF?
The beef is in the effect on the ice of that 2 degree increase on the average. As seen in my prior post.
 

From your dishonest link:

In that 1997 report, they say clearly that the Global Average Temperature (GAT) was 62.45°F, based on a 30-year average (1961-1990) of the combined land and sea surface temperatures.

During 2015, the average temperature across global land and ocean surfaces was 1.62°F (0.90°C) above the 20th century average.

It was blogger Wattsupwiththat who first noticed and explained the funky math. He explains that the recent report compares 2015 to the 20th century average - but, doesn't mention what that average temperature was.

However, it does give a 20th Century average in its November 2015 State of the Climate Report: - 13.9 degrees Celsius (57 degrees Fahrenheit):

Global Analysis - Annual 2015 | National Centers for Environmental Information (NCEI)

The annual temperature anomalies for 1997 and 1998 were 0.51°C (0.92°F) and 0.63°C (1.13°F), respectively, above the 20th century average


Would be GREAT if you knew WHEN the baseline average mattered. In your 1st claim --- GAT= 62.45degF -- there IS no baseline involved because ----------------------- It's NOT an ANOMALY, it's an actual temperature average.

And your LAST statement of anomalies for 1997 and 1998 don't state what baseline was being subtracted to GET an anomaly. I think you're a bit confused as to when it matters..
 
Scientists are floored by what’s happening in the Arctic right now

Source: Washington Post
New data from NASA and the National Oceanic and Atmospheric Administration suggest that January of 2016 was, for the globe, a truly extraordinary month. Coming off the hottest year ever recorded (2015), January saw the greatest departure from average of any month on record, according to data provided by NASA.

But as you can see in the NASA figure above, the record breaking heat wasn’t uniformly distributed — it was particularly pronounced at the top of the world, showing temperature anomalies above 4 degrees Celsius (7.2 degrees Fahrenheit) higher than the 1951 to 1980 average in this region.

Indeed, NASA provides a “zonal mean” version of the temperature map above, which shows how the temperature departures from average change based on one’s latitude location on the Earth. As you can see, things get especially warm, relative to what the Earth is used to, as you enter the very high latitudes:


Read more: Scientists are floored by what’s happening in the Arctic right now

But hey, it aint happening as it is all made up and so we should go pray to jesus christ!!! Read our 2,000 year old book and sing how god makes sure this never happens. lol

Interesting that so many scientists "are FLOORED by this".. A lot of information is LOST when you consolidate all that Global data into ONE yearly average. And at 1st glance it might sound REALLY REALLY menacing that the Arctic as a zone is so much higher than the rest of the globe.

But in truth -- I'm CERTAIN this is more propaganda from NASA/NOAA. And they are selecting some "anomalies" for some months in SOME localities and the GENERAL Arctic trend is NOWHERE near this hysteria.

They've lost their marbles....

70-90N%20MonthlyAnomaly%20Since1957.gif


They are referring to some SINGLE months where peak anomalies are TRULY not even much greater than what was seen in the 1950s..

Where's the BEEF?
The beef is in the effect on the ice of that 2 degree increase on the average. As seen in my prior post.

Then WHERETF is the 8degF that NASA/NOAA are lying about in the OP? and why are we here discussing PROPAGANDA?
 
Right where they said it was:

Figure2b.png


Lying? Propaganda? You've really bought into the Exxon pitch, haven't you?
 
Last edited:
Right where they said it was:

Figure2b.png


Lying? Propaganda? You've really bought into the Exxon pitch, haven't you?
Do you have a link to that Exxon pitch? Seems you're the only one discussing it.
 
Yet another perfect example of how the Right lies.

Your link dishonestly uses two DIFFERENT standards when comparing 2015 to 1997. For 1997 they use the 30 year average standard of 1961 to 1990 to get their average temperature, but the dishonest lying scum you sourced use the 100 year 20th century average standard for the 2015 average temperature, even though the same 100 year 20th century average standard for 1997 had already been published BEFORE the time your source published their lies.

From your dishonest link:

In that 1997 report, they say clearly that the Global Average Temperature (GAT) was 62.45°F, based on a 30-year average (1961-1990) of the combined land and sea surface temperatures.

During 2015, the average temperature across global land and ocean surfaces was 1.62°F (0.90°C) above the 20th century average.

It was blogger Wattsupwiththat who first noticed and explained the funky math. He explains that the recent report compares 2015 to the 20th century average - but, doesn't mention what that average temperature was.

However, it does give a 20th Century average in its November 2015 State of the Climate Report: - 13.9 degrees Celsius (57 degrees Fahrenheit):

Global Analysis - Annual 2015 | National Centers for Environmental Information (NCEI)

The annual temperature anomalies for 1997 and 1998 were 0.51°C (0.92°F) and 0.63°C (1.13°F), respectively, above the 20th century average

WE know . Only your links are accurate and only your science is acceptable.. Laughable crap...

Yet another sea ice calculation shows normal (as the 30 year base period) range of ice coverage and well within the +/- 2 standard devations.
ssmi_ice_ext.png

Nansen data (CSV file with both extent and area) download here

It's rather funny that all the US NOAA calculations are way low and most every other global index has us in normal ranges. Why do you suppose that is? Someone is fudging their data. Who do you suppose it is, those who are in agreement or NOAA? Given the history of who has been caught messing with the data....
 

Forum List

Back
Top