skookerasbil
Platinum Member
Funny how the climate crusading nutters absolutely flip out if anything is put out there that doesn't conform with the established AGW narrative.
gay
gay
Follow along with the video below to see how to install our site as a web app on your home screen.
Note: This feature may not be available in some browsers.
Funny how the climate crusading nutters absolutely flip out if anything is put out there that doesn't conform with the established AGW narrative.
gay
All this time with you and you STILL DON"T KNOW the freaking difference between TSI and SunSpot Number??? We're done also... You're not paying attention.. Is it because you can't ---- or you won't ???
You tried that one before. Why don't you show us this huuuge disconnnect - this complete lack of correlation - between sunspots and TSI.
Primarily needs to be in the correct units. And you're not gonna see an appreciable diff on a 30 yr scale.. You should know that. If the TSI increased 1.2W/m2 over 300 yrs, how much did it change on your 30 yr graph?
And here's the punchline --- which will go right thru your ears without further consideration.
NO ONE should be expecting a forcing function to have the SAME SHAPE OR TIMING as the observed temp.. Only brainless models of a complex thermal system would expect that.
When a forcing function takes a step to a higher value (like TSI did) and REMAINS at that increased value --- it doesn't mean the temperature is done climbing..
A thermal system with storage in it involves a system transfer with integrals. What is the response of an integral to a step function? It's a RAMP.. like the temperature change we saw in the 80s and 90s.
Why? Because as you said before there is still an imbalance in the amount of energy coming in and that going out.. EVEN IF ITS A CONSTANT AMOUNT --- the total amount of heat WILL ACCUMULATE linearly and thus drive the temperature higher. Most likely with a considerable time constant or delay. (this is all documented in the lit)
The shape of the forcing function never DID have to match the shape of the temperature curve.. You've just been misled by Climate Scientists who never took Linear Systems, Non-Linear Systems, Stochastic Systems, and are just NOW discovering energy storage, temporal delays, and Fourier combinations of periodic functions causing ramps and complex shapes.
Just because you see a pause in the warming doesn't mean that the forcing function paused at the same time. And similiarly, just because you see a pause in a forcing function, doesn't mean that the temperature is about to stall.
Raising the dial on the range does not ALONE control the temperature of the water in the pot. The temperature is determined by the imbalance between energy in and out over time. The water can continue to heat if the dial stays put and the energy in EXCEEDS the energy out.
It could even look like a hockey stick if you wanted it to be one...
Without moving the dial again.
Think more --- rely on the internet less.....
First off, there is no step function. You can look at all the potential inputs and there are no step functions. Solar cycles aren't a step function.
Yeah, but the forcing function actually has to go up and stay up, not oscillate about a mean. If it oscillates about a mean, then the forced function will oscillate without maintaining a steady upward trend.
If the input is sin(wt), the output will be sin(wt+theta). If the input is a square wave, the output will be a series of natural exponential increases and decreases in a sort of saw tooth form.
What does happen, in natural systems, is that is the input is a step function, the output is a natural exponential function that asymtotes. If the input is a square wave or sinusoidal input, the output is sinusoidal.
The only way to get a constant ramping output is to have a constant ramping input. Why? Because the output goes up an e^(-1/x) and ends up being asymptotic to some limiting value. This is typical of natural systems because natural systems have a rate of change that is proportional to the level. With the thermostat suddenly turned up, the temperature will increase rapidly at first, then increase slowly as the temperature begins to reach a new steady state value where the losses are equal to the inputs.
And, statistically, it will still show correlation given the correct lag. Sin correlates with cos, with a phase shift. What doesn't correlate with a sine is a constant slope.
A Fourier series creates a periodic function like a saw tooth or a square wave. And, it has to be an infinite series. There are no infinite series of periodic functions in the earth climate.
And, the resultant shape of the Fourier series is correlated with the periodic function that it produces because Fourier series is correlation.
You want to talk about the mathematics of convolution now?
You've just been misled by Climate Scientists who never took Linear Systems, Non-Linear Systems, Stochastic Systems, and are just NOW discovering energy storage, temporal delays, and Fourier combinations of periodic functions causing ramps and complex shapes.
Competent scientists understand that curve-fitting isn't science. Since you're completely incompetent, you rely entirely on curve-fitting.
"Fourier combinations of periodic functions" can be fit to _any_ finite curve. Literally. That's very basic stuff, but poor Flac doesn't get it, or why such curve fitting is so meaningless. He's happy to be sitting in the corner mathturbating, and doesn't understand why no one wants to watch him doing it.
You just exposed a massive amount of ignoorance. Everything I said in that previous post wasmocking curve filters who expect tthe stimulus to completely match the rsponse of a complex system. Go ahead ill give u another whack at an intelligient comment.
All this time with you and you STILL DON"T KNOW the freaking difference between TSI and SunSpot Number??? We're done also... You're not paying attention.. Is it because you can't ---- or you won't ???
You tried that one before. Why don't you show us this huuuge disconnnect - this complete lack of correlation - between sunspots and TSI.
Primarily needs to be in the correct units. And you're not gonna see an appreciable diff on a 30 yr scale.. You should know that. If the TSI increased 1.2W/m2 over 300 yrs, how much did it change on your 30 yr graph?
And here's the punchline --- which will go right thru your ears without further consideration.
NO ONE should be expecting a forcing function to have the SAME SHAPE OR TIMING as the observed temp.. Only brainless models of a complex thermal system would expect that.
When a forcing function takes a step to a higher value (like TSI did) and REMAINS at that increased value --- it doesn't mean the temperature is done climbing..
A thermal system with storage in it involves a system transfer with integrals. What is the response of an integral to a step function? It's a RAMP.. like the temperature change we saw in the 80s and 90s.
Why? Because as you said before there is still an imbalance in the amount of energy coming in and that going out.. EVEN IF ITS A CONSTANT AMOUNT --- the total amount of heat WILL ACCUMULATE linearly and thus drive the temperature higher. Most likely with a considerable time constant or delay. (this is all documented in the lit)
The shape of the forcing function never DID have to match the shape of the temperature curve.. You've just been misled by Climate Scientists who never took Linear Systems, Non-Linear Systems, Stochastic Systems, and are just NOW discovering energy storage, temporal delays, and Fourier combinations of periodic functions causing ramps and complex shapes.
Just because you see a pause in the warming doesn't mean that the forcing function paused at the same time. And similiarly, just because you see a pause in a forcing function, doesn't mean that the temperature is about to stall.
Raising the dial on the range does not ALONE control the temperature of the water in the pot. The temperature is determined by the imbalance between energy in and out over time. The water can continue to heat if the dial stays put and the energy in EXCEEDS the energy out.
It could even look like a hockey stick if you wanted it to be one...
Without moving the dial again.
Think more --- rely on the internet less.....
You tried that one before. Why don't you show us this huuuge disconnnect - this complete lack of correlation - between sunspots and TSI.
Primarily needs to be in the correct units. And you're not gonna see an appreciable diff on a 30 yr scale.. You should know that. If the TSI increased 1.2W/m2 over 300 yrs, how much did it change on your 30 yr graph?
And here's the punchline --- which will go right thru your ears without further consideration.
NO ONE should be expecting a forcing function to have the SAME SHAPE OR TIMING as the observed temp.. Only brainless models of a complex thermal system would expect that.
When a forcing function takes a step to a higher value (like TSI did) and REMAINS at that increased value --- it doesn't mean the temperature is done climbing..
A thermal system with storage in it involves a system transfer with integrals. What is the response of an integral to a step function? It's a RAMP.. like the temperature change we saw in the 80s and 90s.
Why? Because as you said before there is still an imbalance in the amount of energy coming in and that going out.. EVEN IF ITS A CONSTANT AMOUNT --- the total amount of heat WILL ACCUMULATE linearly and thus drive the temperature higher. Most likely with a considerable time constant or delay. (this is all documented in the lit)
The shape of the forcing function never DID have to match the shape of the temperature curve.. You've just been misled by Climate Scientists who never took Linear Systems, Non-Linear Systems, Stochastic Systems, and are just NOW discovering energy storage, temporal delays, and Fourier combinations of periodic functions causing ramps and complex shapes.
Just because you see a pause in the warming doesn't mean that the forcing function paused at the same time. And similiarly, just because you see a pause in a forcing function, doesn't mean that the temperature is about to stall.
Raising the dial on the range does not ALONE control the temperature of the water in the pot. The temperature is determined by the imbalance between energy in and out over time. The water can continue to heat if the dial stays put and the energy in EXCEEDS the energy out.
It could even look like a hockey stick if you wanted it to be one...
Without moving the dial again.
Think more --- rely on the internet less.....
Two points:
1) You claimed there was no correlation between TSI and sunspots. That was why I threw that graph up there. You failed to even mention that point.
2) What solar parameter do you believe to have executed a step function?
3) That the result of the independent changes of a forcing function would map to its integral came in the 12th grade. Not only do I know it, but I'll bet you a dollar to a donut that every climate scientist on the face of the planet knows it.
You tried that one before. Why don't you show us this huuuge disconnnect - this complete lack of correlation - between sunspots and TSI.
Primarily needs to be in the correct units. And you're not gonna see an appreciable diff on a 30 yr scale.. You should know that. If the TSI increased 1.2W/m2 over 300 yrs, how much did it change on your 30 yr graph?
And here's the punchline --- which will go right thru your ears without further consideration.
NO ONE should be expecting a forcing function to have the SAME SHAPE OR TIMING as the observed temp.. Only brainless models of a complex thermal system would expect that.
When a forcing function takes a step to a higher value (like TSI did) and REMAINS at that increased value --- it doesn't mean the temperature is done climbing..
A thermal system with storage in it involves a system transfer with integrals. What is the response of an integral to a step function? It's a RAMP.. like the temperature change we saw in the 80s and 90s.
Why? Because as you said before there is still an imbalance in the amount of energy coming in and that going out.. EVEN IF ITS A CONSTANT AMOUNT --- the total amount of heat WILL ACCUMULATE linearly and thus drive the temperature higher. Most likely with a considerable time constant or delay. (this is all documented in the lit)
The shape of the forcing function never DID have to match the shape of the temperature curve.. You've just been misled by Climate Scientists who never took Linear Systems, Non-Linear Systems, Stochastic Systems, and are just NOW discovering energy storage, temporal delays, and Fourier combinations of periodic functions causing ramps and complex shapes.
Just because you see a pause in the warming doesn't mean that the forcing function paused at the same time. And similiarly, just because you see a pause in a forcing function, doesn't mean that the temperature is about to stall.
Raising the dial on the range does not ALONE control the temperature of the water in the pot. The temperature is determined by the imbalance between energy in and out over time. The water can continue to heat if the dial stays put and the energy in EXCEEDS the energy out.
It could even look like a hockey stick if you wanted it to be one...
Without moving the dial again.
Think more --- rely on the internet less.....
First off, there is no step function. You can look at all the potential inputs and there are no step functions. Solar cycles aren't a step function.
Yeah, but the forcing function actually has to go up and stay up, not oscillate about a mean. If it oscillates about a mean, then the forced function will oscillate without maintaining a steady upward trend.
If the input is sin(wt), the output will be sin(wt+theta). If the input is a square wave, the output will be a series of natural exponential increases and decreases in a sort of saw tooth form.
What does happen, in natural systems, is that is the input is a step function, the output is a natural exponential function that asymtotes. If the input is a square wave or sinusoidal input, the output is sinusoidal.
The only way to get a constant ramping output is to have a constant ramping input. Why? Because the output goes up an e^(-1/x) and ends up being asymptotic to some limiting value. This is typical of natural systems because natural systems have a rate of change that is proportional to the level. With the thermostat suddenly turned up, the temperature will increase rapidly at first, then increase slowly as the temperature begins to reach a new steady state value where the losses are equal to the inputs.
And, statistically, it will still show correlation given the correct lag. Sin correlates with cos, with a phase shift. What doesn't correlate with a sine is a constant slope.
A Fourier series creates a periodic function like a saw tooth or a square wave. And, it has to be an infinite series. There are no infinite series of periodic functions in the earth climate.
And, the resultant shape of the Fourier series is correlated with the periodic function that it produces because Fourier series is correlation.
You want to talk about the mathematics of convolution now?
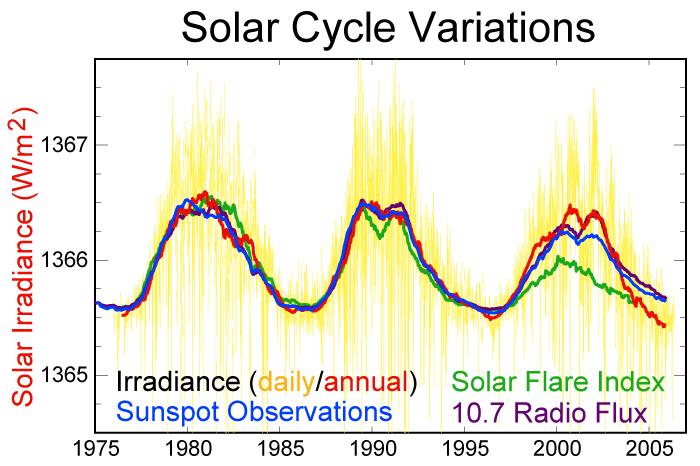
That we won't see an appreciable difference on a 30 year scale? Both sunspots and TSI have gone through three significant cycles on that graph, of an amplitude at least as large as anything TSI will do over a millenia and they are in virtually perfect synchrony. If you think there's a break at some scale or other, show it to us.
TSI has increased 0.5 W/m^2 since 1850.
Explain to me how a response function does not map to its forcing function one to one. What are you actually suggesting? Variable lagging? Variable sensitivity? Please explain why you think the response will be somehow nonlinear from forcing? And if that's your claim, you better have an excellent idea what's causing such effects, else you will never be able to make a case that the two are causally related.
That we won't see an appreciable difference on a 30 year scale? Both sunspots and TSI have gone through three significant cycles on that graph, of an amplitude at least as large as anything TSI will do over a millenia and they are in virtually perfect synchrony. If you think there's a break at some scale or other, show it to us.
TSI has increased 0.5 W/m^2 since 1850.
Why do you think it's been called the Solar Constant for centuries?? Because it varies slowly... NOT ON THE SCALE you depicted.. Sun spot number is a predictor of solar irradiation at anytime but it's baseline is removed and is not in W/m2. THey are not the same. TSI has increased MORE THAN a W/m2 since the last solar min in 17XX. And to put that into perspective --- the IPCC is only looking for about 1.6W/m2 to explain the whole current era warming. That's about 0.1% of the TSI number. So if variances THAT SMALL are all it takes it begs a further question...
I am intrigued by the fact that we not only consider the TSI to be a "constant", but we also ASSUME that the shape of its spectrum is ALSO invariant.. A burning furnace with all the complex pole inversions and cycling of our sun might imply that this spectral shape is also variant. This you cannot accurately measure from the surface of the earth. Because the very gases we are studying punch holes in that spectral distribution as it comes thru the atmos. They USED to climb mtns to go attempt measurements. NOW we have satellites. But we've only had spectrometers doing real time measurements up for about 15 years. Less than a complete solar cycle..
Imagine that when you convolve the incident spectral distribution with all it's complex lines and shapes that just ONE of the GHGases has a line of absorption at a place in that distribution where the sun's energy is changing.. It would modulate the GreenHouse effect. and How much would that line have to change in height or frequency? Very very little...
We don't know JACKSHIT about how this convolution would change over time..
What we DO KNOW is that we expect our "yellow" sun to go "orange" and eventually "red" before the "Game Over" sign appears. So we KNOW that the furnace spectrum is EXPECTED to vary.. We need 20 more years of SATELLITE spectrometry to look for changes.
Explain to me how a response function does not map to its forcing function one to one. What are you actually suggesting? Variable lagging? Variable sensitivity? Please explain why you think the response will be somehow nonlinear from forcing? And if that's your claim, you better have an excellent idea what's causing such effects, else you will never be able to make a case that the two are causally related.
Linear system theory.. Elemental view is you have a black box with a transfer function described by a state equation.. Let's use electrical analogies. Black box contains a resistor -- the output DOES MATCH the input for all forcing functions with a simple gain and offset. Pretty much totally correlated shapes.. That's the simple ass (wrong) CO2 climate model.
However --- you start adding components like capacitors and inductors with leading and lagging phase operators (delay, storage) and all of sudden, the output of that box looks NOTHING like the input stimulus.. You can make a FILTER or a DELAY LINE, or a radio reciever out of those elemental component models. Output BY DESIGN looks nothing like the input..
Put FEEDBACKS (positive and negative) around that black box and suddenly you can get shit to OSCILLATE or ring or compute differentials and integrals.. THAT almost guarantees incoherence between the input and the output. (even a resistor in a POSITIVE feedback will change more than gain or offset)..
Don't let the fact that I used electrical components throw you.. My daughter is 4th yr neuroscience and called me last week to complain that she has to become an electronics engineer to understand the analogies that are in her coursework.. RLC (resistor, capacitor, inductor) models and electrical feedback analogies also appear in thermo. The L and C components are just INTEGRALS and DIFFERENTIAL operators. Just like other natural phenomena. That's why Linear, Nonlinear, and Stochastic systems analysis is UNIVERSAL for all fields of study..
So I just gave you a list of the components that we KNOW are in the climate black box in my previous post.
And THEY not only have reactive components and feedback, but they also contain NON-LINEAR elements and effects. Also contains statistically driven components in the weather patterns and ocean currents and periodic shit that we know goes on..
So THE BOX WE'RE studying should NEVER HAVE BEEN EXPECTED to have an output result that HAD TO MATCH the stimulus.. Never, ever... That's Sesame Street science. You know where Big Bird sings --- "one of these things is not like the other"..
THAT'S what climate science brought us for 20 years by focusing solely on CO2 and stupid single numbers for "global averages"...
Sesame Street science expectations..
Primarily needs to be in the correct units. And you're not gonna see an appreciable diff on a 30 yr scale.. You should know that. If the TSI increased 1.2W/m2 over 300 yrs, how much did it change on your 30 yr graph?
And here's the punchline --- which will go right thru your ears without further consideration.
NO ONE should be expecting a forcing function to have the SAME SHAPE OR TIMING as the observed temp.. Only brainless models of a complex thermal system would expect that.
When a forcing function takes a step to a higher value (like TSI did) and REMAINS at that increased value --- it doesn't mean the temperature is done climbing..
A thermal system with storage in it involves a system transfer with integrals. What is the response of an integral to a step function? It's a RAMP.. like the temperature change we saw in the 80s and 90s.
Why? Because as you said before there is still an imbalance in the amount of energy coming in and that going out.. EVEN IF ITS A CONSTANT AMOUNT --- the total amount of heat WILL ACCUMULATE linearly and thus drive the temperature higher. Most likely with a considerable time constant or delay. (this is all documented in the lit)
The shape of the forcing function never DID have to match the shape of the temperature curve.. You've just been misled by Climate Scientists who never took Linear Systems, Non-Linear Systems, Stochastic Systems, and are just NOW discovering energy storage, temporal delays, and Fourier combinations of periodic functions causing ramps and complex shapes.
Just because you see a pause in the warming doesn't mean that the forcing function paused at the same time. And similiarly, just because you see a pause in a forcing function, doesn't mean that the temperature is about to stall.
Raising the dial on the range does not ALONE control the temperature of the water in the pot. The temperature is determined by the imbalance between energy in and out over time. The water can continue to heat if the dial stays put and the energy in EXCEEDS the energy out.
It could even look like a hockey stick if you wanted it to be one...
Without moving the dial again.
Think more --- rely on the internet less.....
First off, there is no step function. You can look at all the potential inputs and there are no step functions. Solar cycles aren't a step function.
Yeah, but the forcing function actually has to go up and stay up, not oscillate about a mean. If it oscillates about a mean, then the forced function will oscillate without maintaining a steady upward trend.
If the input is sin(wt), the output will be sin(wt+theta). If the input is a square wave, the output will be a series of natural exponential increases and decreases in a sort of saw tooth form.
What does happen, in natural systems, is that is the input is a step function, the output is a natural exponential function that asymtotes. If the input is a square wave or sinusoidal input, the output is sinusoidal.
The only way to get a constant ramping output is to have a constant ramping input. Why? Because the output goes up an e^(-1/x) and ends up being asymptotic to some limiting value. This is typical of natural systems because natural systems have a rate of change that is proportional to the level. With the thermostat suddenly turned up, the temperature will increase rapidly at first, then increase slowly as the temperature begins to reach a new steady state value where the losses are equal to the inputs.
And, statistically, it will still show correlation given the correct lag. Sin correlates with cos, with a phase shift. What doesn't correlate with a sine is a constant slope.
A Fourier series creates a periodic function like a saw tooth or a square wave. And, it has to be an infinite series. There are no infinite series of periodic functions in the earth climate.
And, the resultant shape of the Fourier series is correlated with the periodic function that it produces because Fourier series is correlation.
You want to talk about the mathematics of convolution now?
Are you a PROFESSION CON ARTIST?? Or just the victim of poor on-line degree?
From henceforce ye shall be knownst as Mr. Snowjob.. Particularly for your hiliarously deconvoluted vision of Fourier transforms or the relation to correlation.. (there IS a relation -- but Fourier analysis IS NOT correlation my conniving parasite).
The TSI has taken an approximation of a step function since the 1700 and is now sitting at a relative MAXIMUM value for about 40 years or so.. In the temporal world of climate change -- a ramp up to 1.2W/m2 over 300 years with an appreciable pause can be roughly modeled as in the "step function family"...
Here's the situation.. The thermal system of the earth's climate is NOT a simple transfer transfer function.. We do however -- know a great deal about what's in that box. To wit...
1) The system contains heat energy storage element in it largest absorber (the oceans). This implies a reactive element based on integrals of the forcing function.. There may be other storage elements of shorter duration as well on land and in the atmos itself.
2) There are known delays in response to forcing functions.. These are excellently displayed in the deep historical records to the resolution of the proxies. This also adds complexity to the system transfer function. It is EXPECTED that a ball as large and complex as the earth will have hefty thermal time constants and delays. There's no way around that..
3) There are both Linear and NonLinear elements present in the system. Things like temp threshholds where ice starts to viciously melt are HIGHLY NON-LINEAR elements. The presence of non-linear elements further guarantees that the response will almost certainly NOT LOOK LIKE THE STIMULUS.
4) We know there are feedbacks, both positive and negative with their time constants and "gains or sensitivities"..
5) We also realize that despite the climate insistence on making everything a "global average" --- there are many distinct climate zones with their own unique set of gains, sensitivities and feedbacks. So the "black box transfer function" is actually multiple series/parallel paths further complicating the expected response.
6) We are faced with a whole range of POSSIBLE stimuluses although climate science has focused solely on CO2 unless they need a raft of excuses to escape upon.. So developing a COMPOSITE stimulus for this system is as daunting as analyzing the system itself..
Given those six ((and there are probably many other "guesses" at what's "in the box")), ANY scientist will tell you that it is POSITIVELY CERTAIN --- that a system composed of those elements is NOT REQUIRED to have a response that looks, or is shaped, or correlates with, the stimulus that is forcing it.. Make that read --- Any scientist with sufficient PHYSICS or ENGINEERING skills...
To channel the IPCC --- I am 98% CERTAIN that the OBSERVED HISTORICAL TEMPERATURE record for the earth climate does NOT require a curve fitted, matching forcing function..
I imagine that soon (maybe in my lifetime) the fledgling climate scientists will acknowledge this as they realize HOW MUCH MODELING they have left "out of the box"...
....
I imagine that soon (maybe in my lifetime) the fledgling climate scientists will acknowledge this as they realize HOW MUCH MODELING they have left "out of the box"...
That we won't see an appreciable difference on a 30 year scale? Both sunspots and TSI have gone through three significant cycles on that graph, of an amplitude at least as large as anything TSI will do over a millenia and they are in virtually perfect synchrony. If you think there's a break at some scale or other, show it to us.
TSI has increased 0.5 W/m^2 since 1850.
Why do you think it's been called the Solar Constant for centuries?? Because it varies slowly... NOT ON THE SCALE you depicted.. Sun spot number is a predictor of solar irradiation at anytime but it's baseline is removed and is not in W/m2. THey are not the same. TSI has increased MORE THAN a W/m2 since the last solar min in 17XX. And to put that into perspective --- the IPCC is only looking for about 1.6W/m2 to explain the whole current era warming. That's about 0.1% of the TSI number. So if variances THAT SMALL are all it takes it begs a further question...
I am intrigued by the fact that we not only consider the TSI to be a "constant", but we also ASSUME that the shape of its spectrum is ALSO invariant.. A burning furnace with all the complex pole inversions and cycling of our sun might imply that this spectral shape is also variant. This you cannot accurately measure from the surface of the earth. Because the very gases we are studying punch holes in that spectral distribution as it comes thru the atmos. They USED to climb mtns to go attempt measurements. NOW we have satellites. But we've only had spectrometers doing real time measurements up for about 15 years. Less than a complete solar cycle..
Imagine that when you convolve the incident spectral distribution with all it's complex lines and shapes that just ONE of the GHGases has a line of absorption at a place in that distribution where the sun's energy is changing.. It would modulate the GreenHouse effect. and How much would that line have to change in height or frequency? Very very little...
We don't know JACKSHIT about how this convolution would change over time..
What we DO KNOW is that we expect our "yellow" sun to go "orange" and eventually "red" before the "Game Over" sign appears. So we KNOW that the furnace spectrum is EXPECTED to vary.. We need 20 more years of SATELLITE spectrometry to look for changes.
Explain to me how a response function does not map to its forcing function one to one. What are you actually suggesting? Variable lagging? Variable sensitivity? Please explain why you think the response will be somehow nonlinear from forcing? And if that's your claim, you better have an excellent idea what's causing such effects, else you will never be able to make a case that the two are causally related.
Linear system theory.. Elemental view is you have a black box with a transfer function described by a state equation.. Let's use electrical analogies. Black box contains a resistor -- the output DOES MATCH the input for all forcing functions with a simple gain and offset. Pretty much totally correlated shapes.. That's the simple ass (wrong) CO2 climate model.
However --- you start adding components like capacitors and inductors with leading and lagging phase operators (delay, storage) and all of sudden, the output of that box looks NOTHING like the input stimulus.. You can make a FILTER or a DELAY LINE, or a radio reciever out of those elemental component models. Output BY DESIGN looks nothing like the input..
Put FEEDBACKS (positive and negative) around that black box and suddenly you can get shit to OSCILLATE or ring or compute differentials and integrals.. THAT almost guarantees incoherence between the input and the output. (even a resistor in a POSITIVE feedback will change more than gain or offset)..
Don't let the fact that I used electrical components throw you.. My daughter is 4th yr neuroscience and called me last week to complain that she has to become an electronics engineer to understand the analogies that are in her coursework.. RLC (resistor, capacitor, inductor) models and electrical feedback analogies also appear in thermo. The L and C components are just INTEGRALS and DIFFERENTIAL operators. Just like other natural phenomena. That's why Linear, Nonlinear, and Stochastic systems analysis is UNIVERSAL for all fields of study..
So I just gave you a list of the components that we KNOW are in the climate black box in my previous post.
And THEY not only have reactive components and feedback, but they also contain NON-LINEAR elements and effects. Also contains statistically driven components in the weather patterns and ocean currents and periodic shit that we know goes on..
So THE BOX WE'RE studying should NEVER HAVE BEEN EXPECTED to have an output result that HAD TO MATCH the stimulus.. Never, ever... That's Sesame Street science. You know where Big Bird sings --- "one of these things is not like the other"..
THAT'S what climate science brought us for 20 years by focusing solely on CO2 and stupid single numbers for "global averages"...
Sesame Street science expectations..
I am familiar with RLC circuits.
Sunspot number is not given in W/m^2 ?!?! Well blow me down! Who'd a thunk.
By direct measurement, the sun's forcing is a very small fraction of the forcing determined for greenhouse effects. No matter what the relationship between forcing and response might be, 1.5 W/m^2 will have more effect than will 0.07 W/m^2.
I'm also curious why the response to direct solar heating should have a vastly more complex response correlation than longwave trapping and reradiation by greenhouse gases distributed throughout the atmosphere. For that matter, what is the logic behind rejecting AGW - whose components are determinant, whose forcing amplitude is sufficient and whose apparent response is relatively linear and instead fixating on a source that, by measure, has inadequate power to do that job and works through some complex and variable function that you have yet to delineate or explain.
Your comments regarding complex effects require a signal component seriously lacking on the time scale of interest here: frequency. Both TSI and the Earth's average temperature over the last 150 years (like any time-variant signal) could be FFT-ed and produce some spectral components, but the amplitude of any of them would be insignificant in comparison to heat content's simple non-oscillatory rise over time. Thus the consequence of a filter in your circuit - one for whose creation you've yet to even suggest a mechanism - would have almost no discernible effect over the time scale of interest.
Perhaps, however, you're on to the cause of the apparent long cycle (~60 years) in the PDO that caused the 1941-1979 hiatus and the current one as well; when more of the sun's trapped heat gets sequestered in the deep ocean. But, that's an oscillation. The Earth's growing heat content, at least on the scale of the Industrial Revolution, is not oscillatory. It's just growing.
GHGs in the Earth's atmosphere (considered in a steady state) maintain it's temperature approximately 33C (59F) higher than it would be without them. Why you should go to such lengths to reject the idea that additional GHGs (a 40% increase in CO2) could have the effect observed eludes me completely. But, carry on. Thinking hard - and learning from it - is good for our health.
