Top 1 percent took record share of US income in 2012

SO?

leftards, why do you care so much about others people money?

That's why I never put Dean or Wry on ignore. They serve as a reminder of what a mind filled with hate, envy and ignorance sounds like

I don't care about other people's money, per se. I do care of its impact on my country, especially in terms of politics, polices and propaganda. Envy has no bearing on my opinions, I'm well set, I retired at age 56, have traveled extensively nationally and internationally, bought a home for one of my sons and his wife; paid off all of my other son's school loans and established IRA's for both (I match what each contributes per year).

I don't hate anyone, not even you CF, for you are the archetype of the callous conservative; to dumb or too lazy to think about problems or issues creatively you simply parrot those demagogues who appeal to you emotionally. Pity is the one emotion I have for you and Stephanie, Willow Tree and other simple members of the echo chamber.

Feel free to call me names, suggest I'm ignorant and label me a commie or libtard, it bothers me not at all. I'll keep on keeping on, offering my opinions and literally laughing at your responses. Someday you might post something of significance or even something thoughtful. On that day I'll giver you a positive rep. Until then I'll continue to laugh at and pity you.

Money made by one man is not taken from another man. Value is exchanged. Some have more things of value than others. Why is Michael Jordan a multi millionaire? Did he steal his money from coal miners and auto workers?
 
dimocrap scum are so fond of telling the world about how smart they are.... Why don't you guys get rich and prove it?

If it's so easy, I mean.......

The point isn't about how easy or difficult it is to get rich. The point is about how difficult it is now, as opposed to decades passed, just to support a family. The wealthy are reaping massive increases in the national income even as the average citizens are experiencing a decrease in their share of the national income AND a declining standard of living.

College tuition in this country is up 500% since 1985.

Even as productivity rates have gone way up, workers income levels have stagnated. And when your income level stagnates even as prices are going up, what the hell do you think happens? Your money doesn't go as far as it used to.

The facts are there if a person is just willing to investigate them instead of turning to sources of information which do little more than obfuscate the truth, if they're not downright lying about what's happening and why.

any idea who operates the colleges and why tuition keeps going up?

There is more than one reason why tuition has been going up. But a BIG reason is because, at public universities at least, gov't financial support for education got repeatedly slashed as state gov'ts tried to balance their budgets. And the result of that kind of public policy decision is that it essentially requires parents and students to either load up on massive amounts of debt, or it locks them out of one of few tried and true avenues of upward mobility.

And then who goes to these universities in the place of middle class American students? The children of wealthy foreigners, that's who. The end result is that while conservatives are worried about who's coming across the Rio Grande border to take jobs at some Purdue chicken processing plant somewhere, wealthy students from foreign countries are getting visas to go to our universities and either take the better paying jobs in our own country six years later, or they're going back to their country to compete against American businesses complements of a university system generations of Americans built and financed.

But you guys want to blame liberals for your problems?

totally wrong, when colleges realized that the govt was giving student loans for whatever tuition costs were, and that the loans did not have to be paid back, tuition went up----------like magic :eusa_whistle:
 
he pay gap between the richest 1 percent and the rest of America widened last year, making a record.

The top 1 percent of U.S. earners collected 19.3 percent of household income in 2012, their largest share in Internal Revenue Service figures going back a century.

U.S. income inequality has been growing for almost three decades. But until last year, the top 1 percent's share of pre-tax income had not yet surpassed the 18.7 percent it reached in 1927, according to an analysis of IRS figures dating to 1913 by economists at the University of California, Berkeley, the Paris School of Economics and Oxford University.

One of them, Emmanuel Saez of the University of California, Berkeley, said the incomes of the richest Americans might have surged last year in part because they cashed in stock holdings to avoid higher capital gains taxes that took effect in January.

Last year, the incomes of the top 1 percent rose 19.6 percent compared with a 1 percent increase for the remaining 99 percent.

What else can be said, the powerful line their pockets while chastising and hurting workers.
Top 1 percent took record share of US income in 2012 - NBC News.com

You know the federal reserve banks are the true 1%. Of course, there are other huge companies, who just got a big break from Obama and don't have to participate in Obamacare for another year. I didn't hear one damn liberal bitch about the wealthiest of the wealthy getting such a sweet deal. Middle class business owners are laying people off to save themselves from going bankrupt. And the liberals don't give a shit about them. Only us peons will be forced to purchase insurance or face fines, or as the ads are calling them, 'unnecessary taxes.' Yup, Obama's solution to people not being able to afford to buy insurance is to simply force them to buy it. And the costs are going up. And Obama and congress gave themselves a break and won't be forced to participate because it's too expensive for them and they are better than the rest of us.
 
any idea who operates the colleges and why tuition keeps going up?

There is more than one reason why tuition has been going up. But a BIG reason is because, at public universities at least, gov't financial support for education got repeatedly slashed as state gov'ts tried to balance their budgets. And the result of that kind of public policy decision is that it essentially requires parents and students to either load up on massive amounts of debt, or it locks them out of one of few tried and true avenues of upward mobility.

And then who goes to these universities in the place of middle class American students? The children of wealthy foreigners, that's who. The end result is that while conservatives are worried about who's coming across the Rio Grande border to take jobs at some Purdue chicken processing plant somewhere, wealthy students from foreign countries are getting visas to go to our universities and either take the better paying jobs in our own country six years later, or they're going back to their country to compete against American businesses complements of a university system generations of Americans built and financed.

But you guys want to blame liberals for your problems?

totally wrong, when colleges realized that the govt was giving student loans for whatever tuition costs were, and that the loans did not have to be paid back, tuition went up----------like magic :eusa_whistle:

You don't know what you're talking about.

Student loans cannot be erased in a bankruptcy. Did you know that?

If there was any sorry trend that started regarding education and gov't guaranteed student loans back in the 80s and 90s, it involved a combination of private for-profit colleges and banks. You know, private enterprise? See, all kinds of unaccredited schools sprang up across the country offering fairly worthless degrees to unsuspecting kids and their parents. And with the whole gov't guaranteed student loan process, they went to banks who knew they couldn't lose money. So the banks lent to anyone and everyone. Either the student (or their parents) paid back the loan, or the gov't made good on the debt. Meanwhile, both the students, their parents, and the taxpayers got shafted. That's one of the reasons (and there are thousands of reasons) why regulation is necessary to protect the consumer AND the taxpayers from unscrupulous businesses.
 
Actually I gave the only fact in this discussion, it's you and your buds who are blowing opinion out of your posteriors.

The top 1% earn 20% of the income and pay 40% of the taxes. IRS data. The problem is what exactly? How much should they pay?

When a wealthy person's share of the national income is skyrocketing, and their tax RATE has actually declined over a period of several decades (check the tax tables over the last 50 years if you don't believe me), then complaining about paying 40% of all federal income taxes is a red herring because they're not only MAKING more money than they ever did before, they're KEEPING more of that income (both the previous level of income and the increase of income) than they ever did before because the marginal tax rate is less than half of what it used to be.

The wealthiest man in America has a tiny fraction the wealth as a percent of our economy of the wealthiest men in America a century ago. Sorry the facts don't support your claim without cherry picking and narrowly defining them.

A great question to ask yourself is why is it government's job to decide how much wealth anyone can create? I'm seriously not jealous of what anyone else has, I guess that's why it doesn't bother me.

As for your first paragraph, I never made any claim about the relative wealth of men one hundred years ago. But the abuses by monopolies like the railroads which had no competition in most areas and by men like Andrew Carnegie during the gilded age eventually led to gov't intervention as TR and the trust busters leveled the playing field.

As for the second paragraph, that's another red herring. Gov't doesn't decide on wealth, but it does set tax policy. Unfortunately, for several decades now, wealthy Americans have been using their paid access to law makers to further tilt the laws and the tax policy in favor of themselves (and I understand that) over average Americans which has ultimately hurt the American economy as a whole.

Now, perhaps average Americans (if they can afford to do it) should form some kind of PAC since the American system is evidently now overwhelmingly a "pay-to-play" system as opposed to a representational republic. But the Congress STILL has a responsibility to promote the general welfare, and sometimes that means not giving the rich minority everything they want if it hurts the nation as a whole. That's true even if they're willing to pay for it, which they obviously have been up to this point.
 
Voodoo wrecked and IS WRECKING the nonrich to the point where demand for products and services has dried up, along with their savings...before the corruption and cronyism housing and credit meltdown of 2008...

Memorize the facts, hater dupes:
1. WORKERS past 63 years worker productivity has grown by 2.0% per year.But after 1980, workers received a smaller share every year. Labor’s share of income (1992 = 100%):1950 = 101%1960 = 105%1970 = 105%1980 = 105% – Reagan1990 = 100%2000 = 96%2007 = 92%A 13% drop since 1980A 13% drop since 1980

2. THE TOP 10% GET A LARGER SHARE.Share of National Income going to Top 10%:1950 = 35%1960 = 34%1970 = 34%1980 = 34% – Reagan1990 = 40%2000 = 47%2007 = 50%

TO MAKE UP FOR THE LOSS.Household Debt as percentage of GDP:1965 = 46%1970 = 45%1980 = 50% – Reagan1990 = 61%2000 = 69%2007 = 95% An increase of 16% since Reagan.

3. WORKERS COMPENSATED FOR THE LOSS OF INCOME BY SPENDING THEIR SAVINGS.The savings Rose up to Reagan and fell during and after.1950 = 6.0%1960 = 7.0%1970 = 8.5%1980 = 10.0% – Reagan1982 = 11.2% – Peak1990 = 7.0%2000 = 2.0%2006 = -1.1% (Negative = withdrawing from savings)

Household Debt as percentage of GDP:1965 = 46%1970 = 45%1980 = 50% – Reagan1990 = 61%2000 = 69%2007 = 95%A 45% increase after 1980.

5. SO THE GAP BETWEEN THE RICHEST AND THE POOREST HAS GROWN.Gap Between the Share of Capital Income earned by the top 1%and the bottom 80%:1980 = 10%2003 = 56%A 5.6 times increase.

6. AND THE AMERICAN DREAM IS GONE.The Probably of Moving Up from the Bottom 40% to the Top 40%:1945 = 12%1958 = 6%1990 = 3%2000 = 2%A 10% Decrease.

Links:1 = ftp://ftp.bls.gov/pub/special.requests/pf/totalf1.txt1 = https://www.clevelandfed.org/Researc...s/No7Nov04.pdf1 = Clipboard01.jpg (image)2 – Congratulations to Emmanuel Saez | The White House3 = http://www.demos.org/inequality/imag...ving_thumb.gif3 = http://www.bea.gov/national/nipaweb/...&LastYear=20104 = http://www.prudentbear.com/index.php...or-debt-of-gdp4 = FRB: Z.1 Release--Financial Accounts of the United States--June 6, 20135/6 = Wealth And Inequality In America - Business Insider

From Keith Olbermann's lips through yours. The rich bastards you hate who earn 20% of the income still pay 40% of the taxes. 99 out of 100 people pay only 1 1/2 times the other one. We're good. Chillax.

The Top 1% own approximately to 35.4 % of this nations wealth and they pay around 36.7% of the taxes.
This viral video is right: We need to worry about wealth inequality
What Do the Top 1% Really Pay in Taxes? | Tax Foundation
 
SO?

leftards, why do you care so much about others people money?

That's why I never put Dean or Wry on ignore. They serve as a reminder of what a mind filled with hate, envy and ignorance sounds like

I don't care about other people's money, per se. I do care of its impact on my country, especially in terms of politics, polices and propaganda. Envy has no bearing on my opinions, I'm well set, I retired at age 56, have traveled extensively nationally and internationally, bought a home for one of my sons and his wife; paid off all of my other son's school loans and established IRA's for both (I match what each contributes per year).


.


that's all good but it still does not give you a right to other's people money.

You did not earn it and you have no say in how somebody is earning/spending.

Have you ever looked into the actual names of those who most benefited?

The vast majority are Democrats and Democrat campaign contributors. Heck, just the pardons for that corrupted couple by Clinton make me puke - the epitome of leftist hypocrisy and corruption.

Yet you never whine about cleaning the ranks of your own - NEVER.

And you know perfectly well that all the bitching about taxes ALWAYS ends up at hitting with higher INCOME taxes of the middle and upper middle class - because the very rich will ALWAYS find the loopholes and they are too few to make the difference.

So stop pretending and just say the truth - you and other leftards want to tax much more those who make 150-200-300K, not the ones who make 20 million.

If that would be true, that your aim is the real rich ones, not the 200-250K makers - YOU would have been the ones stomping your feet when obama lied and lied and lied about taxing the "millionaires" while setting up the drastic increase at 200K per year - which is NOT even an upper middle class anymore, just solid middle class.
 
he pay gap between the richest 1 percent and the rest of America widened last year, making a record.

The top 1 percent of U.S. earners collected 19.3 percent of household income in 2012, their largest share in Internal Revenue Service figures going back a century.

U.S. income inequality has been growing for almost three decades. But until last year, the top 1 percent's share of pre-tax income had not yet surpassed the 18.7 percent it reached in 1927, according to an analysis of IRS figures dating to 1913 by economists at the University of California, Berkeley, the Paris School of Economics and Oxford University.

One of them, Emmanuel Saez of the University of California, Berkeley, said the incomes of the richest Americans might have surged last year in part because they cashed in stock holdings to avoid higher capital gains taxes that took effect in January.

Last year, the incomes of the top 1 percent rose 19.6 percent compared with a 1 percent increase for the remaining 99 percent.

What else can be said, the powerful line their pockets while chastising and hurting workers.
Top 1 percent took record share of US income in 2012 - NBC News.com

IRS figures, while accurate, may not be the best statistics to use in determining the “income share” of the 1%. As stated in your article:

The income figures include wages, pension payments, dividends and capital gains from the sale of stocks and other assets. They do not include so-called transfer payments from government programs such as unemployment benefits and Social Security.


Since tax rates on not only ordinary income but also capital gains as well as the 3.8% medicare tax on “unearned income” (dividends, interest and capital gains) were raised, of course any wealthy individual who had a stock portfolio or property with a significant gain built in would sell before the tax rates were raised by 60% on those gains beginning in 2013 (15% in 2012 vs 20% + 3.8% medicare tax in 2013) unless he intended to hold the asset for an extended period of time where the time value of money would eliminate any advantage. However, are you any “richer” by selling an asset you already own for what it’s worth? Of course not, it just becomes “taxable income” then; you’re just as wealthy with 100 shares of Apple at $500/share as you are with $50,000 cash; it’s just that in the latter case, the IRS identifies it as income.

In addition, the comparison with 1927 is not valid without considering the unemployment benefits and Social Security as well as welfare and other government transfers that exist today and did not in 1927. If you are trying to gauge income inequality, how could you exclude programs that were specifically designed to combat that very thing?
 
I wonder how many poster here realize that their wages have been virtually flat for the past three decades. I think they see their income going up and think they are moving on up. But in real terms and Real Dollars, most have seen flat wages.
I would image if more people had a clue about the fact that they are spinning their wheels as far as real growth of their income, they wouldn't be defending those who have benefited from the three decades of flat wages.
Below is explanation of Real Dollars versus Constant Dollars, etc:
================================================
Current versus Constant (or Real) Dollars

In order to accurately compare income over time, users should adjust the summary measures (medians, means, etc.) for changes in cost of living. The Census Bureau uses the Bureau of Labor Statistics' (BLS) Consumer Price Index (CPI-U) to adjust for changes in the cost of living.1

Current dollars is a term describing income in the year in which a person, household, or family receives it. For example, the income someone received in 1989 unadjusted for inflation is in current dollars.

Constant or real dollars are terms describing income after adjustment for inflation. The Dictionary of Business and Economics defines constant dollar values and real income as shown below.

Constant-dollar value (also called real-dollar value) is a value expressed in dollars adjusted for purchasing power. Constant-dollar values represent an effort to remove the effects of price changes from statistical series reported in dollar terms. The result is a series as it would presumably exist if prices were the same throughout as they were in the base year-in other words, as if the dollar had constant purchasing power.

Real Income. The purchasing power of the income of an individual, group, or nation, computed by adjusting money income to price changes. A comparison between incomes earned during 1970 and 1980, for example, would be pointless unless 1970 and 1980 price levels were identical. Using a price index showing, for example, that average consumer prices increased by 50 percent between those years, it becomes clear that $1,000 in 1980 bought what $667 bought in 1970. Thus, even if total income actually doubled, real income would double only if prices remained constant.

EXAMPLE:
The median household income in 1989 in current dollars is $28,906. If you compared that with the 1990 median household income of $29,943, there appears to be an increase. If you adjusted that 1989 income for changes in the cost of living (converted it to 1990 constant or real dollars), the resulting 1989 median household income is $30,468 (now a 1989-to-1990 comparison of income shows a decline of 1.7 percent).

Footnote:
1.The Census Bureau uses BLS' experimental Consumer Price Index (CPI-U-X1) for 1967 through 1982 and the CPI-U for 1983 through 1998. The Census Bureau derived the CPI-U indexes for years before 1967 by applying the 1967 CPI-U-X1-to-CPI-U ratio to the 1947 to 1966 CPI-U indexes.
Historical Income Tables - Current versus Constant (or Real) Dollars - U.S Census Bureau
================================================
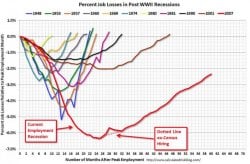
One of the big reasons the Middle Class is shrinking is because of flat wage growth. Interestingly, because the Middle Class is the consumer class and consumer spending drives the US economy by 70%, flat wages have effected the length of our nations recovery. The chart below demonstrates I'm not throwing shit at the wall, hoping it will stick. Please note the last three recessions have taken much longer to recover than previous recoveries, all coincide with the flat wage phenomena . A coincidence?
 

Attachments

  • $Screen Shot 2013-02-01 at 10.29.42 AM.jpg
    $Screen Shot 2013-02-01 at 10.29.42 AM.jpg
    75.2 KB · Views: 39
Voodoo wrecked and IS WRECKING the nonrich to the point where demand for products and services has dried up, along with their savings...before the corruption and cronyism housing and credit meltdown of 2008...

Memorize the facts, hater dupes:
1. WORKERS past 63 years worker productivity has grown by 2.0% per year.But after 1980, workers received a smaller share every year. Labor’s share of income (1992 = 100%):1950 = 101%1960 = 105%1970 = 105%1980 = 105% – Reagan1990 = 100%2000 = 96%2007 = 92%A 13% drop since 1980A 13% drop since 1980

2. THE TOP 10% GET A LARGER SHARE.Share of National Income going to Top 10%:1950 = 35%1960 = 34%1970 = 34%1980 = 34% – Reagan1990 = 40%2000 = 47%2007 = 50%

TO MAKE UP FOR THE LOSS.Household Debt as percentage of GDP:1965 = 46%1970 = 45%1980 = 50% – Reagan1990 = 61%2000 = 69%2007 = 95% An increase of 16% since Reagan.

3. WORKERS COMPENSATED FOR THE LOSS OF INCOME BY SPENDING THEIR SAVINGS.The savings Rose up to Reagan and fell during and after.1950 = 6.0%1960 = 7.0%1970 = 8.5%1980 = 10.0% – Reagan1982 = 11.2% – Peak1990 = 7.0%2000 = 2.0%2006 = -1.1% (Negative = withdrawing from savings)

Household Debt as percentage of GDP:1965 = 46%1970 = 45%1980 = 50% – Reagan1990 = 61%2000 = 69%2007 = 95%A 45% increase after 1980.

5. SO THE GAP BETWEEN THE RICHEST AND THE POOREST HAS GROWN.Gap Between the Share of Capital Income earned by the top 1%and the bottom 80%:1980 = 10%2003 = 56%A 5.6 times increase.

6. AND THE AMERICAN DREAM IS GONE.The Probably of Moving Up from the Bottom 40% to the Top 40%:1945 = 12%1958 = 6%1990 = 3%2000 = 2%A 10% Decrease.

Links:1 = ftp://ftp.bls.gov/pub/special.requests/pf/totalf1.txt1 = https://www.clevelandfed.org/Researc...s/No7Nov04.pdf1 = Clipboard01.jpg (image)2 – Congratulations to Emmanuel Saez | The White House3 = http://www.demos.org/inequality/imag...ving_thumb.gif3 = http://www.bea.gov/national/nipaweb/...&LastYear=20104 = http://www.prudentbear.com/index.php...or-debt-of-gdp4 = FRB: Z.1 Release--Financial Accounts of the United States--June 6, 20135/6 = Wealth And Inequality In America - Business Insider

From Keith Olbermann's lips through yours. The rich bastards you hate who earn 20% of the income still pay 40% of the taxes. 99 out of 100 people pay only 1 1/2 times the other one. We're good. Chillax.

The Top 1% own approximately to 35.4 % of this nations wealth and they pay around 36.7% of the taxes.
This viral video is right: We need to worry about wealth inequality
What Do the Top 1% Really Pay in Taxes? | Tax Foundation

That stat is crap because it ignores home equity and the present value of future payouts for social security and medicare, which is a huge percentage of the assets of a lot of the population. You can prove whatever you want with numbers if you go in with an agenda, which is what you did.

Also, "wealth" was already taxed, so it's irrelevant.
 
he pay gap between the richest 1 percent and the rest of America widened last year, making a record.

The top 1 percent of U.S. earners collected 19.3 percent of household income in 2012, their largest share in Internal Revenue Service figures going back a century.

U.S. income inequality has been growing for almost three decades. But until last year, the top 1 percent's share of pre-tax income had not yet surpassed the 18.7 percent it reached in 1927, according to an analysis of IRS figures dating to 1913 by economists at the University of California, Berkeley, the Paris School of Economics and Oxford University.

One of them, Emmanuel Saez of the University of California, Berkeley, said the incomes of the richest Americans might have surged last year in part because they cashed in stock holdings to avoid higher capital gains taxes that took effect in January.

Last year, the incomes of the top 1 percent rose 19.6 percent compared with a 1 percent increase for the remaining 99 percent.

What else can be said, the powerful line their pockets while chastising and hurting workers.
Top 1 percent took record share of US income in 2012 - NBC News.com


see bold emphasis, yes that has a lot do with it, now, are we going backwards and claiming the rise of the stock market or equities values is a bad thing? becasue every lefty here, that I can recall(?), uses that as an Obama talking point prop, the market broke 15K etc etc etc .


and anyway, you do realize that the 'safety net' outlays are the highest in history too, right? And, since there is no basket of $$ that runs out when its earned by someone else, I fail to see a point here and thats aside, from someones else's point, who mentioned those folks also pay a huge proportion of the federal revenue collected via income tax........
 
When a wealthy person's share of the national income is skyrocketing, and their tax RATE has actually declined over a period of several decades (check the tax tables over the last 50 years if you don't believe me), then complaining about paying 40% of all federal income taxes is a red herring because they're not only MAKING more money than they ever did before, they're KEEPING more of that income (both the previous level of income and the increase of income) than they ever did before because the marginal tax rate is less than half of what it used to be.

The wealthiest man in America has a tiny fraction the wealth as a percent of our economy of the wealthiest men in America a century ago. Sorry the facts don't support your claim without cherry picking and narrowly defining them.

A great question to ask yourself is why is it government's job to decide how much wealth anyone can create? I'm seriously not jealous of what anyone else has, I guess that's why it doesn't bother me.

As for your first paragraph, I never made any claim about the relative wealth of men one hundred years ago. But the abuses by monopolies like the railroads which had no competition in most areas and by men like Andrew Carnegie during the gilded age eventually led to gov't intervention as TR and the trust busters leveled the playing field.

As for the second paragraph, that's another red herring. Gov't doesn't decide on wealth, but it does set tax policy. Unfortunately, for several decades now, wealthy Americans have been using their paid access to law makers to further tilt the laws and the tax policy in favor of themselves (and I understand that) over average Americans which has ultimately hurt the American economy as a whole.

Now, perhaps average Americans (if they can afford to do it) should form some kind of PAC since the American system is evidently now overwhelmingly a "pay-to-play" system as opposed to a representational republic. But the Congress STILL has a responsibility to promote the general welfare, and sometimes that means not giving the rich minority everything they want if it hurts the nation as a whole. That's true even if they're willing to pay for it, which they obviously have been up to this point.

OMG, you said 50 years and I said 100. LOL...

:lmao:
 
Voodoo wrecked and IS WRECKING the nonrich to the point where demand for products and services has dried up, along with their savings...before the corruption and cronyism housing and credit meltdown of 2008...

Memorize the facts, hater dupes:
1. WORKERS past 63 years worker productivity has grown by 2.0% per year.But after 1980, workers received a smaller share every year. Labor’s share of income (1992 = 100%):1950 = 101%1960 = 105%1970 = 105%1980 = 105% – Reagan1990 = 100%2000 = 96%2007 = 92%A 13% drop since 1980A 13% drop since 1980

2. THE TOP 10% GET A LARGER SHARE.Share of National Income going to Top 10%:1950 = 35%1960 = 34%1970 = 34%1980 = 34% – Reagan1990 = 40%2000 = 47%2007 = 50%

TO MAKE UP FOR THE LOSS.Household Debt as percentage of GDP:1965 = 46%1970 = 45%1980 = 50% – Reagan1990 = 61%2000 = 69%2007 = 95% An increase of 16% since Reagan.

3. WORKERS COMPENSATED FOR THE LOSS OF INCOME BY SPENDING THEIR SAVINGS.The savings Rose up to Reagan and fell during and after.1950 = 6.0%1960 = 7.0%1970 = 8.5%1980 = 10.0% – Reagan1982 = 11.2% – Peak1990 = 7.0%2000 = 2.0%2006 = -1.1% (Negative = withdrawing from savings)

Household Debt as percentage of GDP:1965 = 46%1970 = 45%1980 = 50% – Reagan1990 = 61%2000 = 69%2007 = 95%A 45% increase after 1980.

5. SO THE GAP BETWEEN THE RICHEST AND THE POOREST HAS GROWN.Gap Between the Share of Capital Income earned by the top 1%and the bottom 80%:1980 = 10%2003 = 56%A 5.6 times increase.

6. AND THE AMERICAN DREAM IS GONE.The Probably of Moving Up from the Bottom 40% to the Top 40%:1945 = 12%1958 = 6%1990 = 3%2000 = 2%A 10% Decrease.

Links:1 = ftp://ftp.bls.gov/pub/special.requests/pf/totalf1.txt1 = https://www.clevelandfed.org/Researc...s/No7Nov04.pdf1 = Clipboard01.jpg (image)2 – Congratulations to Emmanuel Saez | The White House3 = http://www.demos.org/inequality/imag...ving_thumb.gif3 = http://www.bea.gov/national/nipaweb/...&LastYear=20104 = http://www.prudentbear.com/index.php...or-debt-of-gdp4 = FRB: Z.1 Release--Financial Accounts of the United States--June 6, 20135/6 = Wealth And Inequality In America - Business Insider

From Keith Olbermann's lips through yours. The rich bastards you hate who earn 20% of the income still pay 40% of the taxes. 99 out of 100 people pay only 1 1/2 times the other one. We're good. Chillax.

The Top 1% own approximately to 35.4 % of this nations wealth and they pay around 36.7% of the taxes.
This viral video is right: We need to worry about wealth inequality
What Do the Top 1% Really Pay in Taxes? | Tax Foundation

Is that federal income tax again, the favorite Pub BS...
__________________
YUP, AS ALWAYS, PATHETIC HATER DUPE, count all taxes, and the nonrich are getting screwed...
 
From Keith Olbermann's lips through yours. The rich bastards you hate who earn 20% of the income still pay 40% of the taxes. 99 out of 100 people pay only 1 1/2 times the other one. We're good. Chillax.

The Top 1% own approximately to 35.4 % of this nations wealth and they pay around 36.7% of the taxes.
This viral video is right: We need to worry about wealth inequality
What Do the Top 1% Really Pay in Taxes? | Tax Foundation

That stat is crap because it ignores home equity and the present value of future payouts for social security and medicare, which is a huge percentage of the assets of a lot of the population. You can prove whatever you want with numbers if you go in with an agenda, which is what you did.

Also, "wealth" was already taxed, so it's irrelevant.

agreed...and we have had this out before.....Wealth, Income, and Power- G. William Domhoff, University of California

pretty constant despite all of the recessions a depression etc.....

bottom 99 top 1
1922 63.30% 36.70%
1929 55.80% 44.20%
1933 66.70% 33.30%
1939 63.60% 36.40%
1945 70.20% 29.80%
1949 72.90% 27.10%
1953 68.80% 31.20%
1962 68.20% 31.80%
1965 65.60% 34.40%
1969 68.90% 31.10%
1972 70.90% 29.10%
1976 80.10% 19.90%
1979 79.50% 20.50%
1981 75.20% 24.80%
1983 69.10% 30.90%
1986 68.10% 31.90%
1989 64.30% 35.70%
1992 62.80% 37.20%
1995 61.50% 38.50%
1998 61.90% 38.10%
2001 66.60% 33.40%
2004 65.70% 34.30%
2007 65.40% 34.60%
2012 64.60% 35.40%

average 67.49% 32.51%


Distribution of wealth - Wikipedia, the free encyclopedia


I averaged it for us....note the 2007 and 2012 differential....;)
 
According to the Congressional Budget Office, between 1979 and 2007 incomes of the top 1% of Americans grew by an average of 275%. During the same time period, the 60% of Americans in the middle of the income scale saw their income rise by 40%. Since 1979 the average pre-tax income for the bottom 90% of households has decreased by $900, while that of the top 1% increased by over $700,000, as federal taxation became less progressive. From 1992-2007 the top 400 income earners in the U.S. saw their income increase 392% and their average tax rate reduced by 37%.[19] In 2009, the average income of the top 1% was $960,000 with a minimum income of $343,927.[20][21][22]

In 2007 the richest 1% of the American population owned 34.6% of the country's total wealth, and the next 19% owned 50.5%. The top 20% of Americans owned 85% of the country's wealth and the bottom 80% of the population owned 15%. From 1922 to 2010, the share of the top 1% varied from 19.7% to 44.2%, the big drop being associated with the drop in the stock market in the late 1970s. Ignoring the period where the stock market was depressed (1976-1980) and the period when the stock market was overvalued (1929), the share of wealth of the richest 1% remained extremely stable, at about a third of the total wealth.[23] Financial inequality was greater than inequality in total wealth, with the top 1% of the population owning 42.7%, the next 19% of Americans owning 50.3%, and the bottom 80% owning 7%.[24] However, after the Great Recession which started in 2007, the share of total wealth owned by the top 1% of the population grew from 34.6% to 37.1%, and that owned by the top 20% of Americans grew from 85% to 87.7%. The Great Recession also caused a drop of 36.1% in median household wealth but a drop of only 11.1% for the top 1%, further widening the gap between the 1% and the 99%.[18][23][24] During the economic expansion between 2002 and 2007, the income of the top 1% grew 10 times faster than the income of the bottom 90%. In this period 66% of total income gains went to the 1%, who in 2007 had a larger share of total income than at any time since 1928.

Dan Ariely and Michael Norton show in a study (2011) that US citizens across the political spectrum significantly underestimate the current US wealth inequality and would prefer a more egalitarian distribution of wealth, raising questions about ideological disputes over issues like taxation and welfare.[25]


Distribution of wealth - Wikipedia, the free encyclopedia

notice the way HARDING, COOLIDGE, AND REAGAN screwed the nonrich...
 
The pay gap between the richest 1 percent and the rest of America widened last year, making a record.

Top 1 percent took record share of US income in 2012 - NBC News.com


Which means... What?

That they're getting smarter and you're getting more stupid?

No, Man.

It means that taxes in the US are complicated and unfair.
Tax Code, Regulations and Official Guidance

It means that spending the resources that Americans spend to do the fucking yearly paperwork makes us look really stupid from space.
Google Search: Profitability, H & R Block, Jackson Hewitt, Liberty


It means that congress NEVER should have been given the power to customize the tax code for individuals and industries with memorable check-books around election time.


Fair and simple taxes, public budgets that are balanced by law, transparency in all things politics, then build an economy that your kids can drive to the stars.


Still not rocket science, y'all.
:smoke:
 
Not to mention the WORST, W- 'During the economic expansion between 2002 and 2007, the income of the top 1% grew 10 times faster than the income of the bottom 90%. In this period 66% of total income gains went to the 1%, who in 2007 had a larger share of total income than at any time since 1928.' PUBS SUQ.
 
The 400 richest Americans control an amount of capital equal to 50% of the nations' total privately owned wealth.

And the Republicans are just fine with that.
 

Forum List

Back
Top