What? No hockey stick for Hydrological Climate Change???

I thought posting facts and science was against the rules here..

As we know the religion known as AGW proves that incorrect computer models are to be norm and not actual observations.

Hey -- give our warmer buds time to go panting to skepscience to see what to say about this..
I'm thrilled the literature seems to have opened up.. You wouldn't see papers like this in Nature 10 years ago.
It would have been rejected for certain..

it would have been rejected

and the one who penned it burned at the stake

--LOL
 
You're leaping to all sort of conclusions not in evidence. But first -- I find nothing odd about limitations on accurately measuring the entire surface temperature of the Earth over long time spans. It is what it is. We already have battles over satellite estimates versus 10,000 surface thermometer readings. Battles that amount to TENTHS of a degree. What makes you think that before 1916 we had better spatial coverage and enough sample points to divine GLOBAL temperature with any degree of accuracy. We KNOW what we can adequately measure. And these Paleo-proxies all have FATAL weaknesses that don't allow them to tell us what the VARIANCE is on surface temperature.
MAKE me embarrassed. Tell me something I don't know --- because of forum rules --- let's restrict that to the proxy studies. Whereupon the LIES that they PROVE our little 1degC experience in your lifetime IS unprecedented. When in fact they CANNOT prove that at all...

Well, restating your point, again and again, doesn't really make it more compelling. The current rise is "unprecedented" as we've seen nothing like it in the historical record of the last thousand - or even 10,000 - years. Everybody knows that the paleo-record has its weaknesses, as it smoothes out short-term fluctuations in weather patterns - and yet Ljungqvist concludes from the absence of short-term weather fluctuations that the models over-predict short-term weather fluctuations. If that doesn't strike you as a grave scientific fluke, I don't know what will. Moreover, concluding from the graph Crick posted above, the variability over the last 10,000 years was 0.6°C, which is also when our species has developed and thrived. So, 1°C in temperature rise is huge, and 2 to 4°C would be enormous, and the consequences, climate scientists inform us, would be catastrophic.

I will tell you that CO2 has a KNOWN power to warm the GreenHouse. I totally buy that part. But in any Atmos Physics book you will see a derivation for the ACTUAL power of CO2.. And that's generally agreed to be about 1degC/doubling of concentration.. We have YET to hit the first doubling point since the Industrial Revolution. Won't hit it for at least another 15 to 20 years. You might have a lot of catching up to do before you accuse me of "jumping up and down" and "slaying dragons". I study.. I learn.. Because I can.. And it's clear to me that the public has been WAAAAAY misled about the ACTUAL science and what is ACTUALLY proven in the GW circus.

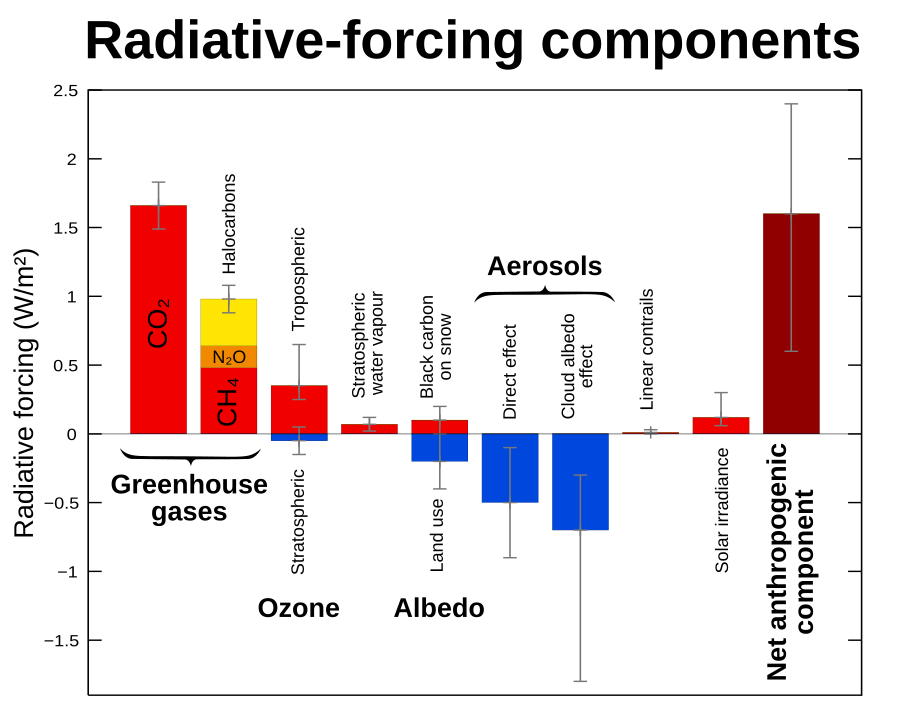
Now, there's a start. Were CO2 the only component of forcing, you'd have a point, but it is not.

900px-Radiative-forcings.svg.png


Yeah, it's pretty annoying to be accused of "jumping up and down" and "slaying dragons", isn't it? No more than being accused of hysteria or other varieties of being emotionally or mentally incompetent, I assure you. So, why don't we both cut the crap (leave that part of the climate hoax silliness to the bear and his ilk), and try to learn something about the benefits and shortcomings of Ljungqvist's study? After all, compiling a (comparatively) broad record of paleo-evidence should come with some insights, but maybe some of the conclusions he draws need to be rejected because the available evidence, spotty as it is, doesn't support them.

Can't do the whole enchilada in THIS thread.. There's a specific topic here. So let's discuss what is known about "proxy evidence" for past climate extremes. You are welcome to revive any of the HUNDREDS of threads on OTHER GW topics or start a specific topic yourself. The rules don't allow for running battles on EVERY aspect of GW "theory"...

I've FOCUSED on the insights in the Ljungqvist study. I'm the one who posted it. It demonstrates how LITTLE consensus there actually is when it comes to the exaggerated predictions that are made for the inevitable GW apocalypse. AND it suffers from the same frailties as all the other paleo-proxies. ALTHOUGH the variances that THEY found still exceed the "weather" extremes that we are measuring today. That says a lot if you know that Paleo proxies are really really bad at measuring natural extremes. Michael Mann --- the felonious Hockey Checker told you that..
 
regemcrufull.jpg


FCT, still wondering where you see evidence that the Arctic has been melting for thousands of years.

Another skep shit science graph huh?? No error bars to confuse the kiddies..

Listen carefully BullWinkle.. YOU WILL NOT SEE any multi-hundred year variances in a Paleo-Proxy reconstruction. Just because it's a graph -- doesn't mean that it has sub 1 deg fidelity. You are stuck in SkepShit land and denying the confessions of both Marcott and now Mann as to WHAT those graphs actually "prove".

Where is the bump for the Roman/Med warm periods? Where are the grapes growing in Greenland? Where is the little ice age? AND -- far as I know -- that huge bump in the reconstructed data WAS warm enough to melt ice. YOU DON'T KNOW where the non-linear break for "melting ice" IS in that highly smoothed "mean temperature" reconstruction..

You've been duped into believing that climate system has almost NO variance in it. And nature just might provide an example of "climate variance" for you if you live another 30 or 50 years when/if the sun actually DOES go into it's next Minimum in the upcoming solar cycles.
 
Another skep shit science graph huh?? No error bars to confuse the kiddies..

Listen carefully BullWinkle.. YOU WILL NOT SEE any multi-hundred year variances in a Paleo-Proxy reconstruction.

Listen carefully. Your "Since you can't absolutely disprove my completely unsupported claims of magic, my magic has to be correct!" brand of science is justifiably laughed out of the room by any real scientists. Repeating your incantations again won't change that. You can't just assume your magic must be correct. You have to show it.

You are stuck in SkepShit land

You are too emotionally invested in hating your perceived enemies to be rational.

and denying the confessions of both Marcott and now Mann as to WHAT those graphs actually "prove".

Yes, demonize the official enemies of the cult! Rally the faithful! The cult must have enemies to survive!

Where is the bump for the Roman/Med warm periods?

Why would there be a global bump for two local warmups?

Where are the grapes growing in Greenland?

The urban legend is mutating and evolving. It used to be "wheat growing in Greenland." Now it's now up to "grapes growing in Greenland". At this rate, it will soon be "bananas growing in Greenland."

Where is the little ice age?

The whole "local vs. global" thing keeps giving you major problems.

AND -- far as I know -- that huge bump in the reconstructed data WAS warm enough to melt ice. YOU DON'T KNOW where the non-linear break for "melting ice" IS in that highly smoothed "mean temperature" reconstruction.

If that made any sense at all, it would no doubt be a strawman.

You've been duped into believing that climate system has almost NO variance in it.

Again, you might want to support your magical theory that there just has to have been massive unseen short-term variance all the time. You'll get less laughter that way.

And nature just might provide an example of "climate variance" for you if you live another 30 or 50 years when/if the sun actually DOES go into it's next Minimum in the upcoming solar cycles.

So how many more years of steady warming will it take for you to admit that you've been as wrong as it's possible for a person to be? That is, is your theory disprovable in any way, or is it entirely pseudoscience?
 
Can't do the whole enchilada in THIS thread.. There's a specific topic here. So let's discuss what is known about "proxy evidence" for past climate extremes. You are welcome to revive any of the HUNDREDS of threads on OTHER GW topics or start a specific topic yourself. The rules don't allow for running battles on EVERY aspect of GW "theory"...

I've FOCUSED on the insights in the Ljungqvist study. I'm the one who posted it. It demonstrates how LITTLE consensus there actually is when it comes to the exaggerated predictions that are made for the inevitable GW apocalypse. AND it suffers from the same frailties as all the other paleo-proxies. ALTHOUGH the variances that THEY found still exceed the "weather" extremes that we are measuring today. That says a lot if you know that Paleo proxies are really really bad at measuring natural extremes. Michael Mann --- the felonious Hockey Checker told you that.

I am not interested in doing the whole enchilada either. What interests me is the connection between the paleo-record, and predictions, or, if you will, what kind of clues and conclusions that record actually supports.

I find, you are still all hung up about the regional variances, a failing monsoon here, and a drought in another century and on another (sub-) continent there, and misinterpret that as global variability. That would be almost like "I am freezing my ass of today, so we're experiencing global cooling." (Not that you would ever say anything like that.)

There actually seems to be very little consensus on the exact interpretation of proxy data, too, as the conclusion regarding temperatures / climate from tree growth, composition of sediments, or ice cores is far from straight-forward:

figure-6-10.jpeg


So, perhaps as a first step we can acknowledge that regional variations might even out, and result in a far smoother global temperature curve than the one you seem to imagine.


"A number of studies that have attempted to produce very large spatial-scale reconstructions have come to the same conclusion: that medieval warmth was heterogeneous in terms of its precise timing and regional expression (Crowley and Lowery, 2000; Folland et al., 2001; Esper et al., 2002; Bradley et al., 2003a; Jones and Mann, 2004; D’Arrigo et al., 2006)."​

box-6-4-figure-1.jpeg
 
So how many more years of steady warming will it take for you to admit that you've been as wrong as it's possible for a person to be? That is, is your theory disprovable in any way, or is it entirely pseudoscience?


Hard science statistcaly? a good another 1000 years.

What you have is JUNK statistics.NO hard data.

Your type is the one to emoitionaly involved to see new data arrives every day.You want to "BELIVE" it so much your throwing out the baby with the bath water

And if it does get colder in the next few hundred years and the means average itself out you will just say oops my bad.


Your type doesn't care about science one bit, you just have a hunch and uses any bullshit information to support it.


.
 
Can't do the whole enchilada in THIS thread.. There's a specific topic here. So let's discuss what is known about "proxy evidence" for past climate extremes. You are welcome to revive any of the HUNDREDS of threads on OTHER GW topics or start a specific topic yourself. The rules don't allow for running battles on EVERY aspect of GW "theory"...

I've FOCUSED on the insights in the Ljungqvist study. I'm the one who posted it. It demonstrates how LITTLE consensus there actually is when it comes to the exaggerated predictions that are made for the inevitable GW apocalypse. AND it suffers from the same frailties as all the other paleo-proxies. ALTHOUGH the variances that THEY found still exceed the "weather" extremes that we are measuring today. That says a lot if you know that Paleo proxies are really really bad at measuring natural extremes. Michael Mann --- the felonious Hockey Checker told you that.

I am not interested in doing the whole enchilada either. What interests me is the connection between the paleo-record, and predictions, or, if you will, what kind of clues and conclusions that record actually supports.

I find, you are still all hung up about the regional variances, a failing monsoon here, and a drought in another century and on another (sub-) continent there, and misinterpret that as global variability. That would be almost like "I am freezing my ass of today, so we're experiencing global cooling." (Not that you would ever say anything like that.)

There actually seems to be very little consensus on the exact interpretation of proxy data, too, as the conclusion regarding temperatures / climate from tree growth, composition of sediments, or ice cores is far from straight-forward:

figure-6-10.jpeg


So, perhaps as a first step we can acknowledge that regional variations might even out, and result in a far smoother global temperature curve than the one you seem to imagine.


"A number of studies that have attempted to produce very large spatial-scale reconstructions have come to the same conclusion: that medieval warmth was heterogeneous in terms of its precise timing and regional expression (Crowley and Lowery, 2000; Folland et al., 2001; Esper et al., 2002; Bradley et al., 2003a; Jones and Mann, 2004; D’Arrigo et al., 2006)."​

box-6-4-figure-1.jpeg

Hell no.. Has nothing to do with WEATHER at all. You are not absorbing the DETAILS about proxy limitations. LONG TERM GLOBAL proxies remove virtually ANY VARIANCE that would detect our 100 year event..

Jones can MAKE that statement because all those different studies -- use almost the SAME proxy data. They just covered varying DISTANCES in time and lended different processing techniques. And ALL of them fail to detect events SHORTER than about 300 years. That's not weather. And those gaps in temporal resolution are at least 3 times LARGER than our entire modern instrumented record.

And it NOT REGIONAL either. In FACT -- Mann admits that HIS FAMOUS hockey stick is HEAVILY loaded for just the Northern Hemi. But that didn't stop him from EXTRAPOLATING to the entire globe when talking to the media. These exaggerated claims made for the work cannot be cashed with the results in their papers.


Let that soak in and try again...
In the meantime -- Here's a photo of Phil Jones -- hard at work at Hadley CRU for your enjoyment. His "lost data sets" are SOMEWHERE in those hoarding piles....


3706-1438458869-4a38dc9b67062a19ab286f6acc9718c2.jpg
 
Hell no.. Has nothing to do with WEATHER at all. You are not absorbing the DETAILS about proxy limitations. LONG TERM GLOBAL proxies remove virtually ANY VARIANCE that would detect our 100 year event..

Jones can MAKE that statement because all those different studies -- use almost the SAME proxy data. They just covered varying DISTANCES in time and lended different processing techniques. And ALL of them fail to detect events SHORTER than about 300 years. That's not weather. And those gaps in temporal resolution are at least 3 times LARGER than our entire modern instrumented record.

And it NOT REGIONAL either. In FACT -- Mann admits that HIS FAMOUS hockey stick is HEAVILY loaded for just the Northern Hemi. But that didn't stop him from EXTRAPOLATING to the entire globe when talking to the media. These exaggerated claims made for the work cannot be cashed with the results in their papers.

Heavens, just before you reminded us this is about the Ljungkvist study, and now you're going on and on about the Hockey Stick. The connection between that Stick and the Ljungkvist study does elude me at that time.

As soon as you come up with even the possibility of a forcing event causing a spike temperatures in Medieval times comparable to what we're seeing, AND explain how this didn't show up anywhere in the records, I am willing to listen to what you are saying about "remove virtually ANY VARIANCE that would detect our 100 year event." Which is, again, a 250-year gathering nightmare.

Oh, and BTW, do you have a quote for this: "Mann admits that HIS FAMOUS hockey stick is HEAVILY loaded for just the Northern Hemi"? Including Mann admitting that the NH was not weighed down to arrive at an about equal weight for all regions in order to compute a global average? Thanks in advance.

How would you go about distributing only about 200 sample points --- mostly from the N.H. to give any type of "GLOBAL" average. You don't have many ice cores or 500 year old PRESERVED trees in the tropics do you?

Those studies ARE REGIONAL studies. Yet you accused me of being concerned with REGIONAL issues and monsoons.. Don't need to fetch SHIT for you.. The graphs you posted are CLEARLY labeled either NH (you know what that means??) or show REGIONAL locations.

And I thought you read this thread?? Did ya miss the part where Mann steps out on FACEBOOK and starts criticizing the Lindqvist study because of "the inherent limitations in Paleo proxy studies"? That's how we got onto proxies in general and Mann being a world class deviant and hypocrite..

Need me to fetch that post? Or do you want to hear the same deal from Marcott?

Response by Marcott <i>et al</i>.

Q: What do paleotemperature reconstructions show about the temperature of the last 100 years?

A: Our global paleotemperature reconstruction includes a so-called “uptick” in temperatures during the 20th-century. However, in the paper we make the point that this particular feature is of shorter duration than the inherent smoothing in our statistical averaging procedure, and that it is based on only a few available paleo-reconstructions of the type we used. Thus, the 20th century portion of our paleotemperature stack is not statistically robust, cannot be considered representative of global temperature changes, and therefore is not the basis of any of our conclusions. Our primary conclusions are based on a comparison of the longer term paleotemperature changes from our reconstruction with the well-documented temperature changes that have occurred over the last century, as documented by the instrumental record. Although not part of our study, high-resolution paleoclimate data from the past ~130 years have been compiled from various geological archives, and confirm the general features of warming trend over this time interval (Anderson, D.M. et al., 2013, Geophysical Research Letters, v. 40, p. 189-193; http://www.agu.org/journals/pip/gl/2012GL054271-pip.pdf).

Q: Is the rate of global temperature rise over the last 100 years faster than at any time during the past 11,300 years?

A: Our study did not directly address this question because the paleotemperature records used in our study have a temporal resolution of ~120 years on average, which precludes us from examining variations in rates of change occurring within a century. Other factors also contribute to smoothing the proxy temperature signals contained in many of the records we used, such as organisms burrowing through deep-sea mud, and chronological uncertainties in the proxy records that tend to smooth the signals when compositing them into a globally averaged reconstruction. We showed that no temperature variability is preserved in our reconstruction at cycles shorter than 300 years, 50% is preserved at 1000-year time scales, and nearly all is preserved at 2000-year periods and longer. Our Monte-Carlo analysis accounts for these sources of uncertainty to yield a robust (albeit smoothed) global record. Any small “upticks” or “downticks” in temperature that last less than several hundred years in our compilation of paleoclimate data are probably not robust, as stated in the paper.

 
Thus, the 20th century portion of our paleotemperature stack is not statistically robust, cannot be considered representative of global temperature changes, and therefore is not the basis of any of our conclusions. Our primary conclusions are based on a comparison of the longer term paleotemperature changes from our reconstruction with the well-documented temperature changes that have occurred over the last century

Here's the part you seem to have missed, indicating that the relevant, last portion of the Hockey Stick wasn't construed out of paleo-data. And with that, your whole argument about spotty paleo-data invalidating the Hockey Stick seems to be falling apart. I also note you didn't come up with any way of forcing compelling a temperature spike like the one we're seeing.

Those studies ARE REGIONAL studies. Yet you accused me of being concerned with REGIONAL issues and monsoons

Weren't you the one going on and on about the Medieval warm Period and the Little Ice Age? Regional phenomena? Yes, you were:

"You can more easily see the signature of the "little ice age" and the Medieval and Roman Warm periods"​

And still you hope to see that reflected in global temperature data. I'd think, they, as regional phenomena, aren't as dispositive for the global energy balance as you think they are, as they may well be, and very likely are, the result of inter-regional transfers of energy, and the resulting changes in precipitation patterns. In this sense, the NH is not a "region" (such as, for instance, Central Europe, India, or the American Midwest).

Finally, I have to note, you still seem to misunderstand the sense of Mann's facebook posting, seemingly out of an insatiable need to insult a world-renowned scientist. That I find a bit scurrilous, to be honest. All Mann is saying is that the data Ljungkvist is using does likely not support the conclusions he is drawing.
 
1) The important point is that Paleo data CANNOT be compared to modern instrumented records less than 300 or 400 years long. Isn't me that's foggy on that point. These climate activist heroes attempted to DO THAT. By tacking on the modern instrumentation record to their BARREN proxy results. So when these Paleo people make sweeping generalizations COMPARING the 2 things in either RATES or MAGNITUDES --- they LIED and misrepresented their work to the public.

2) The MedWarmPer. and the LIA were GLOBAL events. The individual proxies for these events are found ALL over the globe. They DISAPPEAR in long period studies because of smoothing and harmonizing the crappy assortment of proxies that are selected.

3) Your last paragraph is a real belly laugh. Because BOTH of those guys work is based largely on the same sparse proxies. There's not that many to use. Marcott used used just 75, Mann even less. In no fashion did I misunderstand that Mann attempted to dismiss the EMBARRASSING results of the Hydro Cycle study that this thread is about. ALL proxy studies have the same weaknesses. So Mann criticizing Lundqvist was a SIGNED CONFESSION that Mann greatly exaggerated the statements made on behalf of his OWN work..

Only reason you would miss that -- is that you don't understand the limitations being referred to and/or you don't remember the magnitude of the exaggerations MADE in the media over these proxy studies that are NOT backed by the science behind them..

4) I NEVER expect or hope to see HISTORICAL temperature or rainfall data from tree rings, ice cores, and mudbugs that COULD be compared to our modern records. That's not on the table because of limitations in these proxies for thermometers and rain gauges. YOU WISH there was a way to say that our recent temperature history is UNPRECEDENTED in Magnitude or Rates.. Butt there is no data set with the spatial/temporal accuracy to honest make that declaration..

5) The Hydo cycle study which is the topic of this thread was interesting because it illustrates how LITTLE consensus there actually is in "climate science". 2 dominant OPINIONS are that GW will "make wet areas wetter and dry areas driers" and GW will "make all areas wetter". And YET -- Lindqvist read the proxy tea leaves and determines that probably NEITHER projection was correct because the hydro variance he found in his study showed VERY LITTLE reliance on "global temperature" and that the Variances he saw historically were LARGER than what we're measuring with our current "warming".. Thus you can make outrageous exaggerations out of proxy studies for ANY opinion that suites your fancy. And M. Mann -- not liking the Lindqvist verdict comes along and takes a HUGE crap on paleo studies in general..

You can't get better comedy material than that.. Can you??? :2up:

1. Heavens, of course these records can be compared, just as you can compare temperature graphs taking a measure every minute to graphs taking a measure once per hour. You just have to keep in mind the latter will miss some extremes. And, of course, for the times prior to 1850 we have next to no direct temperature measurements, so we have to use the proxies we can find to create a historical record with which to compare what we're measuring.

2) "The MedWarmPer. and the LIA were GLOBAL events." Nope, they weren't, at the very least we don't have data whereupon to base such statement.

3) "So Mann criticizing Lundqvist was a SIGNED CONFESSION that Mann greatly exaggerated the statements made on behalf of his OWN work." No, he did not. In order to assert that you have to presuppose that Mann's own work is based on the paleo-record, and nothing else, as if measurements during the last century weren't the most important clues supporting Mann's work.

4) Exactly, there is probably nothing to be had by way of medieval or pre-historical data that would be comparable in precision to the modern record. Again, take "unprecedented" to mean that there's nothing comparable to today's warming to be found in the historical data, and finish off this point, finally. It's irrelevant for our prospects anyway, except for some comical outrage over a word you need to nurture. I find that unbecoming.

5) There's basic agreement on the foundation of climate science, with the boundaries and frontiers being in more or less dispute. That is so in every science, including physics, I can think of. However, your misunderstandings may help your bemusement, but don't reveal anything about the science:

"2 dominant OPINIONS are that GW will "make wet areas wetter and dry areas driers" and GW will "make all areas wetter"."​

Nope: GW will "make wet areas wetter and dry areas drier" and GW will in both areas increase the frequency of extreme precipitation events. These two are absolutely compatible. See, for instance, an arid region getting 10 to 15 days of light to middling rain a year now, and three days of extreme rain in, say, 50 years, and almost no rain in between. Over the year, this region will see drier conditions, and also extreme flooding during that time. I find it's time for you to wrap your head around this.
 
You have displayed an amazing ignorance of facts for someone so invested in the topic.

Starting with the fact in #1 that the paleo data is equivalent to 1 sample every 400 years or so. So how does one compare that record to all that data taken every hour or day with precision?
(You can't --- Mann and Marcott have told you so)..

AND you have 1000s of globally positioned instruments (or satellites) to get better coverage than just 50 places in a paleo study that are MOSTLY all North. Hemi..

You cannot CLAIM the present warming is UNprecedented -- if there is no comparably sampled and accurate historic record. What part of that don't you understand??

If you ran a 100 year moving average over the TOTAL temperature record from 1800, our warming blip would disappear. That's the EQUIVALENT ability of proxy data to DIVINE similar events, It can not..

Exaggerated claims were made. Retractions issued after the media -- public information damage was done.
So you're STILL gonna claim that our 100 year event is UNPRECEDENTED and exceptional in the course of history -- EVEN THO -- you have nothing to back up that claim?

Let's leave at that. I want to see if you even understand the implications of that Marcott interview that I posted. Seems you don't -- so I'm wasting time because you don't wanna understand how duped you've been by the media hype and the fantastical pronouncements of "climate science"..

BTW ---- CLIMATIC "wet and dry" is NOT a day to day tally of rainfall. Not even a year to year tally of rainfall -- so you're CREATING fictions that don't matter to the discussion..

Seems like we STILL need "better warmers" who actually understand the details and the issues.
 
Just for the record. So you can't say that you've never seen proxies for the MWPeriod all over the world ------


Medieval Warm Period - Wikipedia, the free encyclopedia


The MWP has been noted in Chile in a 1500-year lake bed sediment core . [33]

Adhikari and Kumon (2001), whilst investigating sediments in Lake Nakatsuna in central Japan, finding a warm period from AD 900 to 1200 that corresponded to the Medieval Warm Period and three cool phases, of which two could be related to the Little Ice Age.[34] Another research in northeastern Japan shows that there is one warm/humid interval from AD 750 to 1200, and two cold/dry intervals from AD 1 to 750 and 1200 to present.[7] Ge et al. studied temperatures in China during the past 2000 years; they found high uncertainty prior to the 16th century but good consistency over the last 500 years, highlighted by the two cold periods 1620s–1710s and 1800s–1860s, and the warming during the 20th century. They also found that the warming during the 10–14th centuries in some regions might be comparable in magnitude to the warming of the last few decades of the 20th century which was unprecedented within the past 500 years.[35]

A 1979 study from the University of Waikato found that "Temperatures derived from an 18O/16O profile through a stalagmite found in a New Zealand cave (40.67°S, 172.43°E) suggested the Medieval Warm Period to have occurred between AD 1050 and 1400 and to have been 0.75 °C warmer than the Current Warm Period."[36] The MWP has also been evidenced in New Zealand by an 1100-year tree-ring record.[37]

A reconstruction based on ice cores found the Medieval Warm Period could be distinguished in tropical South America from about 1050 to 1300, followed in the 15th century by the Little Ice Age. Peak temperatures did not rise as high as those from the late 20th century, which were unprecedented in the area during the study period going back around 1600 years.[

Plenty of linked references in the Wiki for you to start reading. .The deal is -- INDIVIDUAL proxies have inherently better resolution when you don't attempt to AGGREGATE them with different types for the entire globe. THUS some of the INDIVIDUAL proxy work is more enlightening in terms of samples around the globe.

From one of my favorite institutes.. I've been there for conferences.

New Temperature Reconstruction from Indo-Pacific Warm Pool

A new 2,000-year-long reconstruction of sea surface temperatures (SST) from the Indo-Pacific warm pool (IPWP) suggests that temperatures in the region may have been as warm during the Medieval Warm Period as they are today.

The IPWP is the largest body of warm water in the world, and, as a result, it is the largest source of heat and moisture to the global atmosphere, and an important component of the planet’s climate. Climate models suggest that global mean temperatures are particularly sensitive to sea surface temperatures in the IPWP. Understanding the past history of the region is of great importance for placing current warming trends in a global context.

The study is published in the journal Nature.

Temperature reconstructions suggest that the Northern Hemisphere may have been slightly cooler (by about 0.5 degrees Celsius) during the 'Medieval Warm Period' (~AD 800-1300) than during the late-20th century. However, these temperature reconstructions are based on, in large part, data compiled from high latitude or high altitude terrestrial proxy records, such as tree rings and ice cores, from the Northern Hemisphere (NH). Little pre-historical temperature data from tropical regions like the IPWP has been incorporated into these analyses, and the global extent of warm temperatures during this interval is unclear. As a result, conclusions regarding past global temperatures still have some uncertainties.

Oppo comments, “Although there are significant uncertainties with our own reconstruction, our work raises the idea that perhaps even the Northern Hemisphere temperature reconstructions need to be looked at more closely.”


Oppo cautions that the reconstruction contains some uncertainties. Information from three different cores was compiled in order to reconstruct a 2,000-year-long record. In addition sediment data have an inherent uncertainty associated with accurately dating samples


So sorry you won't be able to claim ignorance about the MWP being a global event anymore. Unless of course -- you are a denier !!!!! :banana: How many more you want to read. I've got dozens of them..
 
The MWP exceeded the temporal resolution of that proxy. Big whoop. That has nothing to do with individual versus group proxies. Proxy data aren't thrown together in a bag and poured out on the table. Each is treated individually according to its characteristics: its scaling factors, its range, it's temporal resolution and so forth.

You've got to stop assuming that folks with PhDs who've been doing this sort of stuff all their lives and are following on other PhDs who did it all their lives, know no more than do you.
 
Just for the record. So you can't say that you've never seen proxies for the MWPeriod all over the world ------


Medieval Warm Period - Wikipedia, the free encyclopedia

Heavens, flacaltenn...

"Despite uncertainties, especially for the period prior to 1600 for which data are scarce, the warmest period of the last 2,000 years prior to the 20th century very likely occurred between 950 and 1100. Proxy records show peak warmth occurred at different times for different regions, indicating that the Medieval Warm Period was not a time of globally uniform change."​

From your own link. My argument was, peak warm periods at different times occurring in different regions of the world lead to a smoother global warming curve. Lo and behold, your own link supports my argument, as different regional warming events the world over different times mostly even out.

And then, the LIA:

"The NASA Earth Observatory notes three particularly cold intervals: one beginning about 1650, another about 1770, and the last in 1850, each separated by intervals of slight warming.[5] The Intergovernmental Panel on Climate Change Third Assessment Report considered the timing and areas affected by the LIA suggested largely independent regional climate changes, rather than a globally synchronous increased glaciation. At most there was modest cooling of the Northern Hemisphere during the period."​

The same thing here, not a global event (of any significance). And that's pretty much what I told you.

Plenty of linked references in the Wiki for you to start reading. .The deal is -- INDIVIDUAL proxies have inherently better resolution when you don't attempt to AGGREGATE them with different types for the entire globe. THUS some of the INDIVIDUAL proxy work is more enlightening in terms of samples around the globe.

Yeah, I understand your argument, and the problem with that is, knowing that some region experienced a cold or warm spell doesn't really tell us anything about the world's climate, and does not shed a light on our future - which is, after all, what climate science is all about.

It seems clear by now, you'd like to have the current GLOBAL warming interpreted as some kind of "blip", the likes of which happens almost all the time, no worries. But, some singular proxy won't tell you that. And nope, a single proxy won't tell you that the globe was warming at the current rate at any other time during the last 1000 years in the way it did during the last decades. And that's why your insistence on "can't say 'unprecedented'" doesn't make any sense: There is still no evidence whatsoever for a precedent. And you, well informed as you are, can't come up with any kind of forcing that might have created a precedent, and still not show up in the (proxy) records.
 
Last edited:
People who have the science on their side can discuss it calmly and rationally. Those who can't do that, they scream that everyone who disagrees with them is a fraud.

So, let's read Dr. Donat well-reasoned criticism of the new paper.

Wet and dry: Models on climate extremes questioned
---
"It seems to me that the researchers' claim of discrepancies between climate models and proxies during the most recent century is based on an “apple-to-oranges-comparison”. They use proxies of water availability (that is affected by both precipitation and evaporation) but compare against modelled precipitation only. The model simulations show increased precipitation over the past 100 years, consistent with an intensification of the hydrological cycle as temperatures rise related to increasing greenhouse gases in the atmosphere. With increasing temperatures, however, also the amount of evaporated water may increase, and this may compensate the increases in precipitation. This means that the water availability proxies and modelled precipitation are not reasonably comparable over the last century (which is the only period where their comparison seems to point to discrepancies between proxies and models).
---
 
I've got 20 individual from OTHER places not in the N.Hemi that say the MWP has a SIGNIFICANT signature all over the world. Delays ARE expected. Because the climate system is too huge and has too much storage capability to turn on a dime (or a decade).. In fact this planet doesn't have a "global" climate system.. It has several distinctly different climate zones that all respond differently to forcings on their equilibriums.

There is natural variances in most systems with enough chaotic content WITHOUT external forcings. You really don't need to find ONE variable and blame short./medium trends on that.. Like I said --- the BASIC warming power of CO2 is about 1 deg/doubling. All this other hysteria is invented theory. And underlying all that IS a natural variance that we probably won't understand for decades. Every El Nino reminds how chaotic the heat distribution and storage system really is.. And the sun MAYBE ready to display what happens when it's level goes from a local maximum (about 1960) into a quite low multi-decade minimum.. Just the random periods of the dozens of KNOWN cyclical cycles (ie AMO/PDO/ENSO/Rossby/ArcticOscillation/SolarVariation,MJO,Milankovich, etc) could occasionally align to create large FRACTIONS of a degree (or more) changes in "global" surface temps. Look up "Fourier synthesis" to understand the math of constructing linearly climbing ramps from an assortment of repeating sinusoidal functions.

The "forcing" can be combinations of these periodic functions -- and the shape of the resultant temperature change doesn't have to look like any one of them.. EXPECTING the climate to have a single primary driver that LOOKS LIKE the temperature curve is juvenile.. And so is reducing the ENTIRE GW deathwatch to a single stupid Global Mean Annual Surface Temperature.. That's NOT climate science. That's proselytizing the masses. A PR campaign for political/economic/sociological goals.

If it turns out that the 1deg/doubling is closer to the truth than the hysterical older pronouncements of 6 or 8DegC by 2100 (accomplished by assigning SUPER powers to CO2 through magic "climate sensitivity" multipliers), then there is no impending crisis. Because this circus never would have made the front page at that rate.

BTW -- the multiple LOWs of the LIA was a known feature. It was NOT because of "regional delays" that would mask a "Global" signature. But to dismiss the LIA and MWP and RWP as regional would be silly. Since TODAY, GW in the Arctic is at least 2 to 4 times more severe than anywhere else on the planet.

You wouldn't appreciate me waving my hands *jumping up and down* and telling you that today's GW is largely an ARCTIC phenomenon wouldya?

A LOT of the Global talking points are based on proxy evidence. I'm convinced that you can find a justification for any old hare-brained theory reading tree rings and mudbugs and ice. We've OVERplayed all of that "interesting" stuff and NEGLECTED to learn much about ocean storage of heat, thermal distribution and delays, and variations in other parts of the GreenHouse that we still don't know much about.
 
The MWP exceeded the temporal resolution of that proxy. Big whoop. That has nothing to do with individual versus group proxies. Proxy data aren't thrown together in a bag and poured out on the table. Each is treated individually according to its characteristics: its scaling factors, its range, it's temporal resolution and so forth.

You've got to stop assuming that folks with PhDs who've been doing this sort of stuff all their lives and are following on other PhDs who did it all their lives, know no more than do you.

Flac is giving you very basic stuff.. and neither you or Old E has a clue to what hes trying like hell to show you.. The tinfoil hats and blinders you two are wearing have cut off blood flow.
 
I've got 20 individual from OTHER places not in the N.Hemi that say the MWP has a SIGNIFICANT signature all over the world.

We're familiar with that dishonest cherrypicking fallacy pioneered by the "CO2 Science" website. They take proxies that have a warm bump in them somewhere, which don't even line up at the same time, and then declare that proves a global MWP. And in the process, they ignore the vastly more numerous proxies that don't show any warm bump at all.
 

Forum List

Back
Top