WSJ: The World Bakes Under Extreme Heat

LOL!!!

So to you there are CONSTANT ocean currents that NEVER CHANGE and THEY CAUSE all the "melting" and "freezing?"

This is pathetic.

Earth climate data today

All land within 600 miles of a pole is COVERED WITH ICE

All land outside 600 miles of a pole is NOT


And OCEAN CURRENTS are responsible?????


You cannot make this shit up. The IQ required to believe either the "glacials" or the "Solar Cycle" is the same IQ needed to believe the "official version" of 911 IQ<5
You literally posted a graphic which showed the polar regions being isolated from warmer marine currents and you don't even realize that's what it was showing.

So I'll ask you again... The polar regions are thermally isolated from warmer marine currents. Yes or no?

I'll even provide the graphic YOU keep using.

d6aa0304c70bd26d5e210a8f82acdc9e.jpg


And add one of my own showing the polar regions being thermally isolated from warmer marine currents.

thermally isolated polar regions.png
 
We are still asking for all you "experts" to answer the following question:


Why is there ice age glacier south of Arctic Circle on Greenland and no such ice age glacier north of Arctic Circle on Alaska?


Y'all have had months to come up with an answer, and to date you have all failed...

$20 trillion wasted on the Co2 fraud and the Co2 fraud cannot explain A MAP OF THE ARCTIC....
Not sure why you think I believe in AGW. I've been arguing the planet is uniquely configured for colder temperatures.
 
And the "thermal isolation" is OCEAN CURRENTS that change like the wind....

And Antarctica thaws and freezes every hundred years like Dennis Quaid said... and never moves either... and don't notice we got 800k years of ice core data by drilling about halfway through the 2.5 mile thick ice....

LOL!!!!
The polar regions being thermally isolated from warmer marine currents is why the planet is uniquely configured for colder temperatures.
 
There's a lot of wasted food, and 'food waste', in the developed world that can be turned into fuel. Even "Second Harvest" can't deal with all the vegetables that are left in the fields because they aren't cosmetically perfect.
Tell me how this wasted food gets collected and turned into fuel. I don't think you have thought this through.
 
Not sure why you think I believe in AGW. I've been arguing the planet is uniquely configured for colder temperatures.

11:37 last Night
I've never argued against a GHG effect. It's their silly feedbacks that predict runaway warming that I object to. Plus I think the planet being warmer in the middle of an ice age when the vast majority of the past 1 million years has been extremely cold isn't necessarily a bad thing.

Admitting GHG effect is admitting AGW as it's humans that exploded them, which inarguably drove/drives the GHGs.
You are such a strange and DISHONEST creature.
Delusional.

(Short duplicitous excuse coming below)
`
 
Like I said, you are a scientific illiterate.
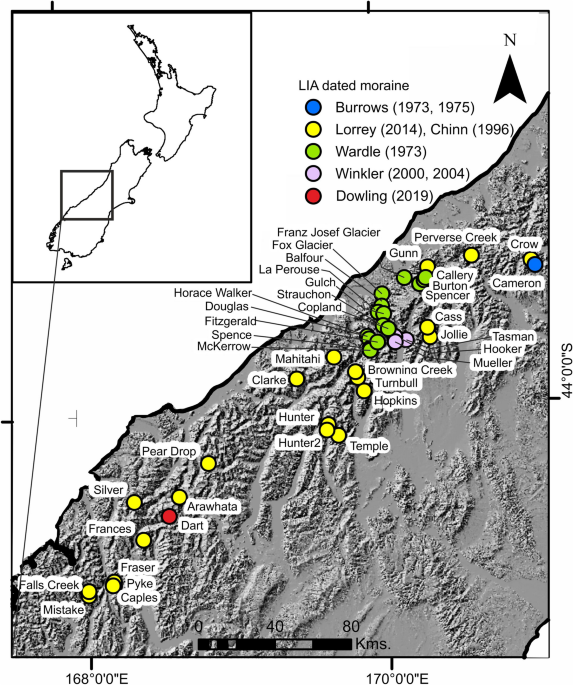
"Little Ice Age (LIA) austral summer temperature anomalies were derived from palaeoequilibrium line altitudes at 22 cirque glacier sites across the Southern Alps of New Zealand. Modern analog seasons with temperature anomalies akin to the LIA reconstructions were selected, and then applied in a sampling of high-resolution gridded New Zealand climate data and global reanalysis data to generate LIA climate composites at local, regional and hemispheric scales. The composite anomaly patterns assist in improving our understanding of atmospheric circulation contributions to the LIA climate state, allow an interrogation of synoptic type frequency changes for the LIA relative to present, and provide a hemispheric context of the past conditions in New Zealand. An LIA summer temperature anomaly of −0.56 °C (±0.29 °C) for the Southern Alps based on palaeo-equilibrium lines compares well with local tree-ring reconstructions of austral summer temperature. Reconstructed geopotential height at 1,000 hPa (z1000) suggests enhanced southwesterly flow across New Zealand occurred during the LIA to generate the terrestrial temperature anomalies. The mean atmospheric circulation pattern for summer resulted from a crucial reduction of the ‘HSE’-blocking synoptic type (highs over and to the west of NZ; largely settled conditions) and increases in both the ‘T’- and ‘SW’-trough synoptic types (lows passing over NZ; enhanced southerly and southwesterly flow) relative to normal. Associated land-based temperature and precipitation anomalies suggest both colder- and wetter-than-normal conditions were a pervasive component of the base climate state across New Zealand during the LIA, as were colder-than-normal Tasman Sea surface temperatures. Proxy temperature and circulation evidence were used to corroborate the spatially heterogeneous Southern Hemisphere composite z1000 and sea surface temperature patterns generated in this study. A comparison of the composites to climate mode archetypes suggests LIA summer climate and atmospheric circulation over New Zealand was driven by increased frequency of weak El Niño-Modoki in the tropical Pacific and negative Southern Annular Mode activity."

"In addition, we computed a (linear) trend surface of the Equilibrium Line Altitude (ELA) for the LIA based on 22 cirque glaciers previously studied24,49, which compared favourably with the neoglacial ELA proposed by Porter50 for a transect between Mt Cook and Jollie Glacier (Fig. SI 1). By discriminating the land above this LIA ELA trend surface, we scrutinised the landscape to find many low-relief moraines, trimlines (Fig. 2), and more subtle geomorphological evidence that helped us to infer a LIA glacier outline for a total of 400 glaciers. The subtle evidence included stripped bedrock at elevations beneath surrounding vegetated hillslopes, locally-depressed treelines, boulder trains running sub-parallel to contours, truncated fan toe slopes and gully heads. Whilst there are > 3,150 glaciers in the Southern Alps in the 1978 inventory, a vast majority constitute smaller portions of formerly larger (and more contiguous) LIA glaciers. We did not map where moraines or trimlines were absent, such as is common in Fiordland for example where the hard crystalline rock and steep slopes makes the creation and preservation of such features unlikely. More details on the volume loss calculations, which are limited to glacier ablation areas (Fig. SI 2), are given in the SI."

"the end of the Little Ice Age (here defined as 1500–1850 CE). The Little Ice Age (LIA) was characterised by generally cooler global climates, particularly in the northern hemisphere (Marcott et al., 2013). There was no globally coherent cold phase associated with the full extent of the LIA, however the period 1571–1722 CE was globally cooler and included a window between 1594 and 1677 CE (termed the “peak LIA”) where a large majority of proxy records indicate cooling (Neukom et al., 2014). On the Australian continent, the small number and sparse distribution of temperature reconstructions hamper firm conclusions about temperature variability over the last millennium, with the majority of tree ring records being located either in the cool climates of Tasmania, or indeed New Zealand, augmented by a small number of (shorter) coral records from the tropics. These data suggest that ∼1500–1900 CE was characterised by cooler Australian climates relative to the rest of the millennium (Gergis et al., 2016)."


DURRRRRRRRRRRRRRRRRRRRR


Has beak and birdbrain, can cut and paste...


Antarctica's glaciers have 800k years worth of ice core data, Greenland's have 130k, each about halfway down the glacier. All this dramatic Dennis Quaid 3 days of ice age stuff is pretty pathetic. The attempt to cook a "solar cycle" is absolutely laughable. Whatever happened, Medieval Warm or Little Ice Age, didn't stop either ice age from continuing on... most likely because there really isn't a strong case of either, and there is absolutely NO CASE AT ALL for "solar cycle."

When asked about WHAT INSTRUMENTS were used to obtain the sunspot data in 1670 that was first recorded 200 years later... LOL!!!

Our resident Zionist Fascist traitor here couldn't even attempt an answer....
 
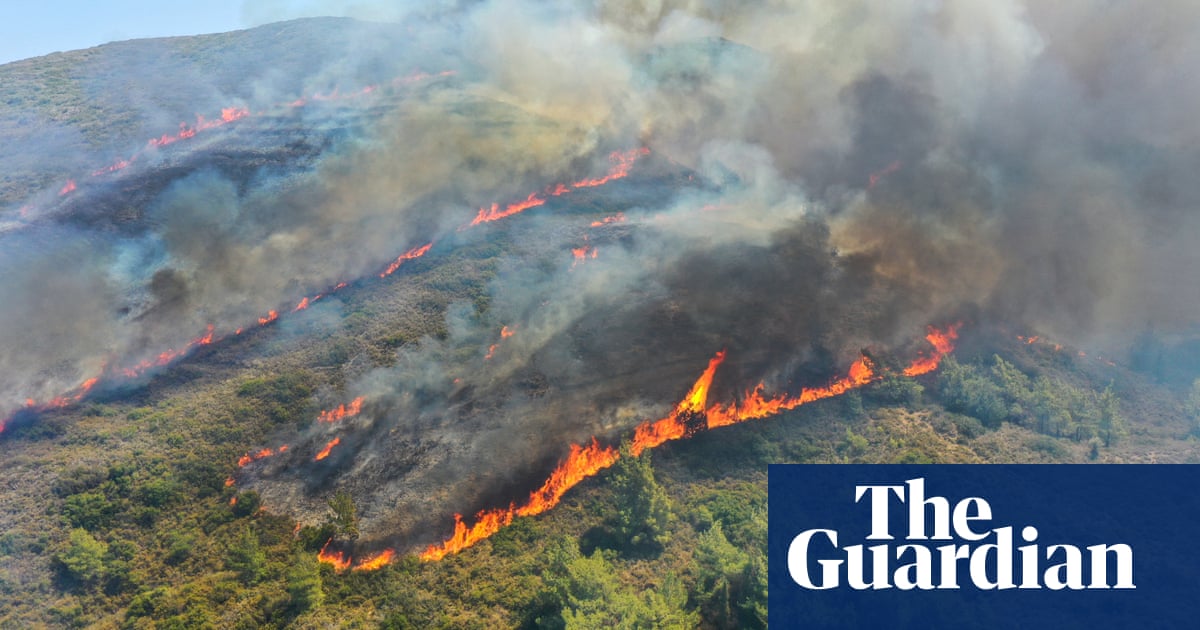
I remember recently when Europe was going to suffer a dreadful heatwave, but things went a little quiet. So did it get hot -


And as for the fires in Greece, the Greek authorities claim -


They lie, they lie, and the global media elites lie with them...

The Weather Channel is 95% climate bullshit 24/7 now..

THEY ARE WORRIED WE ARE GETTING A CLUE, FINALLY....
 
The polar regions being thermally isolated from warmer marine currents is why the planet is uniquely configured for colder temperatures.


One Earth polar circle has 9+ times the ice of the other, is on average 50F colder on the surface than the other, and calves or puts 9 times the ice into the oceans vs. the other...

Antarctica is a continent centered on a pole, and it has no liquid water, even though the Co2 fraud claims it is "melting"

Your opinion of the Arctic is laughable since YOU CANNOT EXPLAIN A MAP OF THE ARCTIC...

Colder temperatures = two polar continents = two Antarcticas

Warmer temperatures = no polar continents

LAND MOVES

NOT THAT HARD TO FIGURE OUT
 
You literally posted a graphic which showed the polar regions being isolated from warmer marine currents and you don't even realize that's what it was showing.

So I'll ask you again... The polar regions are thermally isolated from warmer marine currents. Yes or no?

I'll even provide the graphic YOU keep using.

d6aa0304c70bd26d5e210a8f82acdc9e.jpg


And add one of my own showing the polar regions being thermally isolated from warmer marine currents.
View attachment 812859


Antarctica is a continent. It has wind, not ocean current, since there is NO OCEAN there...

Arctic has arrows on your images going in and coming out. If what you were claiming was true, icebergs from Greenland would float to the North Pole and stay there, not float SOUTH and sink ocean liners...


Your brain does not work...
 
The exact modeling system used to estimate Tuesday’s temperature has only been used since 1979, but scientists are able to estimate average temperatures going back tens of thousands of years by using instrument-based global temperature records, tree rings and ice cores, climate scientist Paulo Ceppi told the Washington Post.
So when you go to that WaPo page, which is usually behind a paywall for me, is says:
Tuesday was the hottest day on Earth since at least 1979, with the global average temperature reaching 62.92 degrees Fahrenheit (17.18 degrees Celsius), according to data from the U.S. National Centers for Environmental Prediction.
I'd call that 4 significant digits,..
As a result, some scientists believe July 4 may have been one of the hottest days on Earth in about 125,000 years, due to a dangerous combination of climate change causing global temperatures to soar, the return of the El Niño pattern and the start of summer in the Northern Hemisphere.
And I'd call that 3 significant digits,..
Finally, looking at the link under "according to the data" or "Data Source & Information" - makes plain that the numbers being reported are the weighted and averaged raw data:
Climate Reanalyzer is NOT a model. This "Daily 2-meter Air Temperature" page shows area-weighted daily means calculated from the 2-meter air temperature variable from the Climate Forecast System version 2 and Climate Forecast System Reanalysis, which are publically available products of the NOAA National Centers for Environmental Prediction. The purpose of the interactive chart and maps on this page is to provide daily snapshots of temperature as estimated from the Climate Forecast System. The mean global temperature increases in early July 2023, estimated from the Climate Forecast System, should NOT be taken as "official" observational records. It is important to note that much of the elevated global mean temperature signal was associated with weather patterns in the Southern Hemisphere that brought warmer-than-usual air over portions of the Antarctic.
The consistency and small deviation from the norm shown in the chart over the years indicates that at least 3 significant digits are fitting and reasonable.
 
11:37 last Night


Admitting GHG effect is admitting AGW as it's humans that exploded them, which inarguably drove/drives the GHGs.
You are such a strange and DISHONEST creature.
Delusional.

(Short duplicitous excuse coming below)
`
Admitting there is a GHG effect doesn't mean buying into their ridiculous computer models which have feedbacks that are 2 to 3 times the GHG effect of CO2.
 
One Earth polar circle has 9+ times the ice of the other, is on average 50F colder on the surface than the other, and calves or puts 9 times the ice into the oceans vs. the other...

Antarctica is a continent centered on a pole, and it has no liquid water, even though the Co2 fraud claims it is "melting"

Your opinion of the Arctic is laughable since YOU CANNOT EXPLAIN A MAP OF THE ARCTIC...

Colder temperatures = two polar continents = two Antarcticas

Warmer temperatures = no polar continents

LAND MOVES

NOT THAT HARD TO FIGURE OUT
Each pole has a different threshold for glaciation because they are isolated differently. Each pole has a different response to glaciation because they have different surrounding landmass distributions.
 
Antarctica is a continent. It has wind, not ocean current, since there is NO OCEAN there...

Arctic has arrows on your images going in and coming out. If what you were claiming was true, icebergs from Greenland would float to the North Pole and stay there, not float SOUTH and sink ocean liners...


Your brain does not work...
That's nice. Antarctica has a lower threshold for glaciation than the north pole because it has a continent parked on top of it whereas the north pole has an ocean parked on it. But the north pole has land surrounding it so when the glaciation threshold is reached glaciers can spread farther because there is surrounding land which the south pole doesn't have.
 
Each pole has a different threshold for glaciation because they are isolated differently. Each pole has a different response to glaciation because they have different surrounding landmass distributions.


Not quite.

What happens is this. Land moves to within 600 miles of a pole. Annual snowfall ceases to fully melt during "summer" and starts to stack.

Stack for 1 million years - Greenland
Stack for 40 million years - Antarctica

The two continent specific ice ages of our time.

Ocean currents have nothing to do with it. Earth climate change is 99% about where land is. Two polar oceans, Earth has no ice.
There's no might about it. You can clearly see the thresholds on the oxygen isotope curve. The threshold for extensive glaciation at each pole is well established. So is the corresponding sea level.
 
The threshold for extensive glaciation at each pole is well established


Actually LAND MOVES.

Greenland moved NW for tens of millions of years before getting to 600 miles of the North Pole and hence entering its current continent specific ice age.

A static analysis is bullshit. As is most of what you post...
 
Actually LAND MOVES.

Greenland moved NW for tens of millions of years before getting to 600 miles of the North Pole and hence entering its current continent specific ice age.

A static analysis is bullshit. As is most of what you post...
Of course the plates move. It's the movement of the plates - which thermally isolated the poles from warmer marine currents - that the planet became configured for bipolar glaciation. So as temperatures naturally cooled for millions of years eventually the threshold for glaciation was reached. First at the southern pole and then later - at an even cooler temperature - the northern pole.
 
Of course the plates move. It's because the plates thermally isolated the poles from warmer marine currents that configured the planet for bipolar glaciation. So as temperatures naturally cooled for millions of years eventually the threshold for glaciation was reach. First at the southern pole and then later at the northern pole.


Then WHY was Greenland COMPLETELY GREEN 2 million years ago and before....?????

If it was "thermally isolated" it should not have froze....
 
Then WHY was Greenland COMPLETELY GREEN 2 million years ago and before....?????

If it was "thermally isolated" it should not have froze....
You are off on some tangent. That has absolutely nothing to do with what I just wrote. If you are trying to argue what I wrote is wrong, I'm just going to trot out the oxygen isotope curve and walk you though what that data is saying. Then I'll march out the sea level data that matches what I am saying too.
 

Forum List

Back
Top