- Feb 22, 2017
- 109,147
- 37,934
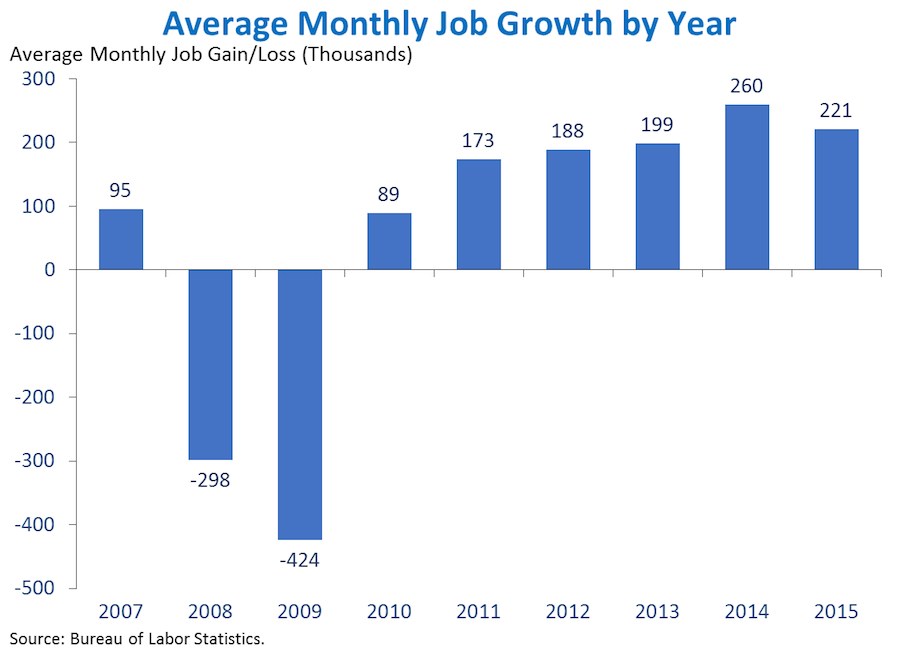
Seriously? You have the gall to put THAT chart up and then say the leveling began around 2014??Hey, you dumb, embarrassing fucking rube, talking about the workforce participation having "leveled off..." check this out:Unemployment has been going down for 8 years. You dumb fucking rubes are only choosing to acknowledge it now.
No, dumb fuck rubes do not understand that unemployment can go down in relation to workforce participation. In other words, when surveyed, if people claim they are not employed nor looking for work, they don't count in the unemployment statistics. The only people that count are those who are unemployed and looking for work.
Now that the workforce participation has leveled off, we can get a more accurate view of what our economy really is.
Americans not in labor force when Trump took office: 95,161,653
Americans not in labor force now: 95,404,331
U.S. National Debt Clock : Real Time
It does vary month to month, but the "trend" itself is now leveled off compared to the last ten years or so.
Here is the last 10 years of the participation rate...the leveling began around 2014
View attachment 159881
It bottomed out in 2015, and then stabilized. It has been free fall for 10 years ---- in fact, if you look closely at your chart, it would appear that the loss rate INCREASED in 2014.
In Jan of 2014 the rate was 62.9. In Oct of 2017 the rate was 62.7 During that time period the lowest it got was 62.4 the highest it got was 63.1. So, yes that does seem to be pretty level to me.